Canadians' Access to Cash Before and During the COVID-19 Pandemic
←
→
Page content transcription
If your browser does not render page correctly, please read the page content below
Staff Discussion Paper/Document d’analyse du personnel—2022-15
Last updated: July 14, 2022

Canadians’ Access to
Cash Before and During
the COVID-19 Pandemic
by Heng Chen and Marie-Hélène Felt

Currency Department
Bank of Canada, Ottawa, Ontario, Canada K1A 0G9

hchen@bankofcanada.ca
mfelt@bankofcanada.ca

Bank of Canada staff discussion papers are completed staff research studies on a wide variety of subjects relevant to
central bank policy, produced independently from the Bank’s Governing Council. This research may support or
challenge prevailing policy orthodoxy. Therefore, the views expressed in this paper are solely those of the authors and
may differ from official Bank of Canada views. No responsibility for them should be attributed to the Bank.

DOI: https://doi.org/10.34989/sdp-2022-15 | ISSN 1914-0568                                     ©2022 Bank of Canada
Acknowledgements

We thank colleagues at the Bank of Canada, especially Jason Allen, Jean-Frédéric Demers,
Walter Engert, Kim P. Huynh, Gerald Stuber and Daneal O’Habib as well as Jerry Buckland
(University of Winnipeg), Barry Scholnick (University of Alberta) and Stephen Wild (Financial
Consumer Agency of Canada) for their helpful comments and suggestions. We also thank
Maren Hansen for excellent editorial assistance.

                                               i
Abstract
This paper studies Canadians’ access to cash using the geographical distribution of automated
banking machines (ABMs). We find that over 97% of urban Canadians have access to ABMs in
their communities, while 92% of rural people have access to at least one ABM. During the
pandemic, there have been no sustained adverse effects on cash accessibility through ABMs.
Topics: Financial Services, Regional economic developments
JEL codes: J15, O1, R51
ii1. Introduction
According to the Bank of Canada Act, “it is the duty of the Bank to make adequate arrangements for the
issue of its notes in Canada and the supply of those notes as required for circulation in Canada.” To fulfill
this responsibility, the Bank must monitor the cash distribution infrastructure and understand how changes
to that system might affect Canadians’ access to cash. This paper focuses on the retail side of the cash
distribution system and examines how the COVID-19 pandemic has affected cash accessibility. We study
Canadians’ access to cash before and during the pandemic by measuring how close they are to automated
banking machines (ABMs). Some of these machines are owned by deposit-taking financial institutions (FIs);
others—so-called white label (WL) ABMs—belong to independent service operators. All FI branches have
at least one ABM. 1 Therefore, tracking access to FI and WL ABMs provides a reliable way to measure cash
accessibility in Canada.
In the next section, we provide background information on the Canadian cash distribution system. Section
3 sets out the metric we use to track the impact of COVID-19 on Canadians’ access to cash through ABMs.
In Section 4, we discuss future work with the distance-based metric and other non-spatial components
affecting cash access. Conclusions are in Section 5.
2. The Canadian cash distribution system
The Canadian cash distribution system consists of both wholesale and retail elements.
(a) Wholesale cash distribution
Through the Bank Note Distribution System (BNDS), the Bank supplies financial institutions with the bank
notes they need to meet public demand. More specifically, the Bank distributes bank notes wholesale to
financial institutions at distribution centres located in regional distribution points (RDPs) across Canada. FIs
can withdraw notes from the BNDS to meet the demand for cash, or they can deposit surplus notes. The
same distribution system is used to return bank notes that are considered unfit for further circulation. See
Bilkes (1997) for more details on the BNDS.
(b) Retail cash distribution
A primary means for Canadians to obtain cash is through withdrawals from ABMs. Of course, they can also
get cash as part of transactions at a point of sale, for example, as change or through cashback. 2 In this
paper, we measure access to the geographical network of ABMs and changes over time in that network.
Cash is an important method of payment in Canada. Chen et al. (2021a) show that over one-fifth of the
volume of all purchases in late 2020 was made with cash, as was 40% of the volume of low-value transactions
(below $15). At the same time, using cash for payments has been declining over a longer period (Chen et
al. 2021a). Declining cash usage for payments might result in reduced use of cash access points such as
ABMs. This, in turn, would reduce economies of scale in such networks and increase related costs, which
could trigger some rationalization of the cash distribution network, and so adversely affect access to cash.
Maintaining an effective retail cash distribution system could be particularly important for crisis periods.
Several authors have emphasized that cash demand typically increases during stress or crisis periods—a
phenomenon seen over time in various countries and episodes (Bech et al. 2018; Engert, Fung and Hendry
1
Engert and Fung (2019) study cashless or tellerless bank branches, where teller services such as cash withdrawals, deposits and
cheque-cashing are instead provided via ABMs.
2
This paper focuses on consumers’ access to cash, instead of merchants’ access. This is because, in addition to using ABMs and
bank branches, merchants can also manage their cash logistics through cash-in-transit operators or innovations such as Smart
Safe. Consumers don’t have all of those options.
12018; and Rösl and Seitz 2021). More generally, cash is especially useful during a crisis, and proactive
measures to sustain cash might be worthwhile (Engert, Fung and Segendorf 2019). Since reversing a
restructuring of the cash distribution infrastructure could be difficult once it is well advanced, it is important
to have a good understanding of these developments and consider whether proactive responses to sustain
this network would be reasonable.
3. A metric of cash accessibility and its application to COVID-19
3.1 Density-based metric
To measure access to ABMs, we develop a density-based metric, which, roughly speaking, counts the
number of ABMs in a geographic area. This metric is based on the quarterly Mastercard ABM location data,
which provides rich information for each ABM in Canada including its physical address, owner name and
location type. For example, an on-site FI ABM is located at an FI branch, a stand-alone FI ABM is unattached
to an FI branch and a WL ABM is in a shopping center, gas station, etc. We map the locations of all ABMs
through their longitudes and latitudes into the census subdivisions (CSDs) in the 2016 Statistics Canada
Census of Population. CSD is the term Statistics Canada uses to refer to municipalities or comparable areas
for statistical reporting and aggregation. There are about 5,100 CSDs in Canada, and we compute the
number of ABMs in each. Note that our metric covers all CSDs in Canada and complements previous work
in Chen and Strathearn (2020) and Chen et al. (2021b), which focus on urban CSDs and First Nations
locations (special types of CSDs), respectively.
We classify each ABM as either an FI ABM or a WL ABM (as described in Chen et al. 2021b). Compared with
FI ABMs, WL ABMs usually have limited functionality. For example, WL ABMs are unlikely to accept deposits,
are subject to lower withdrawal limits and dispense a more limited range of denominations. WL ABMs also
generally charge incremental fees, such as a network access fee and a convenience fee (Scholnick et al.
2008).
The CSDs contain rich demographic and socioeconomic information, such as average age, income,
educational attainment of residents, and urban or rural locations. We classify CSD locations into urban and
rural following Statistics Canada. In this regard, an urban centre has a population of at least 1,000 and a
population density of 400 persons or more per square kilometre, based on the Census. All areas outside of
such population centres are classified as rural. Taken together, urban and rural areas cover all of Canada.
Urban centres are further classified into three groups, according to their populations:
1. small population centres with a population between 1,000 and 29,999
2. medium population centres with a population between 30,000 and 99,999
3. large urban population centres with a population of 100,000 or more
3.2 Cash access during the COVID-19 pandemic
Overall, the number of FI ABMs across Canada declined by 1.06% from November 2019 to February 2022.
The number of WL ABMs decreased by 7.79% from February 2020 to August 2020. 3 However, they then
increased, so that by February 2021 they surpassed the number prior to the pandemic. Because of these
developments, the total number of ABM cash access points increased during the pandemic, as illustrated in
Chart 1.
3
Dahlhaus and Welte (2021) find that, during the pandemic, consumers made more withdrawals from ABMs that were linked to
their financial institution than from other ABMs. This could be partially explained by a larger decline of WL ABMs than that of FI
ABMs.
2Chart 1: Number of automated banking machines in Canada during the pandemic
Charts 2a and 2b consider how the distribution of ABMs changed across CSDs in Canada during the
pandemic. We group CSDs as follows: those with FI ABMs (regardless of whether there are also WL ABMs
in the same CSD), those with only WL ABMs and those without any ABMs at all. These classifications are
mutually exclusive.
Chart 2a shows the distribution of CSDs according to type of ABM. We see at February 2022 that about
30% of CSDs in Canada have FI ABMs, while another 23% of CSDs have only WL ABMs. In almost half of
CSDs throughout Canada, there are no ABMs at all. (Note that this chart does not take into account
population; we consider that below.) The percentage distributions are fairly stable from 2019 to 2022, except
for slight deviations in May and August 2020, which appear to reflect short-term impacts of the pandemic.
In February 2022, the distribution shown in Chart 2a is very similar to that observed before the pandemic.
Chart 2b reports the percentage of the population with ABMs in their residential CSD. Because the Canadian
population is very unevenly distributed across CSDs, inferences from Chart 2b are quite different than
suggested above in Chart 2a. We see that 92% of Canadians live in CSDs with at least one FI ABM, while
about 5% live in CSDs with only WL ABMs. Finally, only 3% of the population live in CSDs with no ABMs of
any type. Further, these proportions were stable during this period, which, based on this metric, indicates
that the pandemic did not impair access to cash.
In sum, these data show that almost all Canadians (97%) live in a community with at least one ABM, and
there have been no sustained adverse affects on such cash access during the pandemic. Access for a small
share (3%) was initially negatively affected, but this effect has tended to reverse over time.
3Chart 2a: Percentage of census subdivisions with at least one automatic banking machine (ABM),
by type of ABM
Chart 2b: Percentage of the Canadian population with at least one automatic banking machine
(ABM) in their census subdivision, by type of ABM
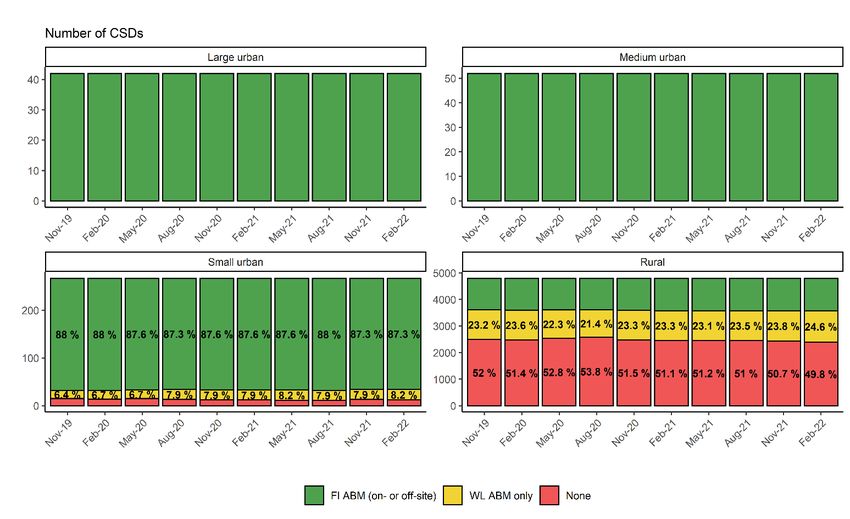
4Charts 3a and 3b show the percentages of CSDs that have an ABM according to type of urban—large,
medium or small population centres—and rural CSDs. The latter CSDs have very small populations.
Chart 3a confirms our previous observation. Almost 90% of small urban centres and 100% of medium and
large urban centres have FI ABMs. Not surprisingly, CSDs without any ABMs are largely rural, with very small
populations and low population density. Over half of rural CSDs have no ABMs. About a quarter of CSDs
situated in rural areas have FI ABMs, while more than 20% have WL ABMs only.
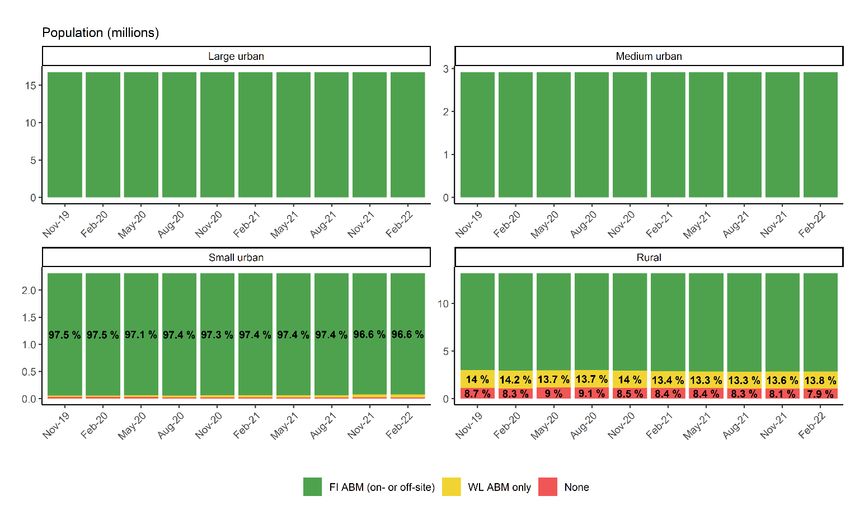
Chart 3b weights the information in the preceding chart by population, so we see the percentages of the
populations in each of these CSD types that have at least one ABM in their communities. This chart shows
that all Canadians living in large and medium population centres, and the vast majority of Canadians living
in small population centres, have at least one FI ABM in their community. As regards the rural CSDs, 78% of
rural Canadians have at least one FI ABM in their CSD. Another 14% of rural Canadians have only WL ABMs,
while 8% of people living in rural CSDs do not have any ABMs at all.
In sum, these data show that most or all Canadians living in urban can access cash from at least one FI ABM.
In rural CSDs, 92% of Canadians have cash access through at least one ABM in their community, while 8%
do not have any ABMs.
Chart 3a: Proportion of census subdivisions having automated banking machines
5Chart 3b: Proportion of populations having automatic banking machines
A caveat on these charts: The data show that Canadians generally have good access to cash through ABMs.
Some people, however, might face challenges or barriers that inhibit their access to ABMs, such as a physical
disability or poor access to transportation, even in locations where ABMs are plentiful (Buckland 2012).
Furthermore, it is worthwhile studying the “cash-accessing deserts” for low-income and minority
neighbourhoods, which are similar to the “banking desert” discussed in the literature (Morgan, Pinkovskiy
and Yang 2016 and Kreiss 2021). 4 In our ongoing work on access to cash, we will study these aspects further
to understand these aspects better.
4. Future work
Our current density-based metric has a few limitations. This metric disregards the geographic distribution
of both ABMs and consumers within a CSD. The metric also does not account for consumers’ proximity to
ABMs in other CSDs.
Regarding the geographic distribution of ABMs within a CSD, Chen and Strathearn (2020) document that
bank branches and ABMs tend to cluster within a CSD, so that simply counting the number of ABMs might
overstate cash accessibility. Consider a situation where two ABMs are located very near to each other. In
this case, our current metric would count two cash-access points. However, from consumers’ perspectives,
these two ABMs might be treated as a single access point. In other words, counting each ABM separately
in a cluster of ABMs might overstate effective cash accessibility.
For the geographic distribution of consumers within a CSD, our metric counts only the number of ABMs
within a CSD without regard for the location of consumers. It seems reasonable that ABMs within a CSD
4
A cash-accessing desert is an area with very few or no ABMs.
6would be distributed close to population clusters, just as ABMs across Canada focus on the most populous
CSDs, as shown above. It would, however, be useful to refine our measurement to take into account within-
CSD population distribution.
Finally, our density-based metric ignores the fact that consumers can travel outside of their CSD to access
cash, which might be more convenient than accessing cash within their own residential CSD. Or consider a
case where there is no ABM in a consumer’s CSD, but one close by within an adjacent CSD. In this case, our
metric would assign zero cash access to the consumer’s residential CSD, which is understated.
To overcome these limitations, our next step is to develop a distance-based metric that accounts for
geographic distributions of both ABMs and consumers’ residential locations (e.g., Stix 2020). We plan to
compute the travel distance between a household, proxied by pseudo-household demographic distribution
derived from the Census, and their corresponding nearest ABM (which could be inside or outside their
CSD). 5
Besides improving upon the current spatial density-based metric, it would be worthwhile incorporating
other non-spatial ingredients into the future metric. These include functionalities (i.e., opening hours and
the ability to accept deposits) and fees (i.e., foreign and surcharge fees). In fact, the current split between FI
ABMs and WL ABMs provides a natural distinction for such non-spatial ingredients. Taking fees as an
example, Donze and Dubec (2009, 2011) show that fees could boost WL ABM deployment and benefit
consumers if the travel costs to reach cash are high: consumers benefit from a better but more expensive
service. Once we have this integrated metric, we plan to rank CSDs across Canada by their “cash accessibility
scores”; see Tischer, Evans and Davies (2019) for a similar example in the city of Bristol. 6
5. Conclusions
This paper develops a density-based metric to monitor Canadians’ access to cash through ATMs, with a
particular emphasis on the most recent period during the pandemic (from November 2019 to February
2022). We find that:
• Almost all Canadians (97%) have access to at least one ABM (and probably many more) in their
communities.
• Over 97% of Canadians who live in urban have access to ABMs in their communities, while 92% of
people living in rural areas have at least one ABM in their CSD.
• There appears to have been no sustained adverse effect on such access during the pandemic.
We plan to conduct further work to improve our metric and deepen our understanding of key issues raised
in this study.
5
The literature on measuring cash accessibility usually assumes that consumers only withdraw or deposit cash from the ABM nearest
to their residential locations. However, this assumption does not account for strategic behaviours such as withdrawing or
depositing cash on the way to work, while shopping or doing other errands where these routes or places might be much further
away from their residential locations (Chen, Strathearn and Voia 2021).
6
Even with the integrated metric combining travel distance, functionalities and fees, it does not account for the interactions
between consumers and the ABM network; see Huynh, Nicholls and Shcherbakov (2019, 2022) for the two-sided payment market.
For example, in response to the increased WL ABMs, consumers may withdraw their cash less often to avoid ABM usage fees.
Such adjustments would reduce the revenue of WL ABM owners, which could reduce the number of WL ABMs. Hence, the risk of
missing such interactions when using only the supply-side metric is that it might overstate the importance of the policy of
focusing on this side. See Allcott et al. (2019) on the impact of neighborhood environment on nutritional inequality: they find that
policies to increase the supply of healthy groceries do not play an important role in reducing nutritional inequality. This is because
the entry of a new supermarket nearby tends to increase local variety but fails to improve healthy eating.
7References
Allcott, H., R. Diamond, J. P. Dubé, J. Handbury, I. Rahkovsky and M. Schnell, M. 2019. ”Food Deserts and
the Causes of Nutritional Inequality.” The Quarterly Journal of Economics 134 (4): 1793–1844.
Bech, M., U. Faruqui, F. Ougaard and C. Picillo. 2018. “Payments Are A-changin' But Cash Still Rules.” BIS
Quarterly Review (March): 67–80.
Bilkes, G. 1997. “The New Bank Note Distribution System.” Bank of Canada Review (Summer): 41–54.
Buckland, J. 2012. Hard Choices: Financial Exclusion, Fringe Banks, and Poverty in Urban Canada. Toronto:
University of Toronto Press.
Chen, H., W. Engert, M.-H. Felt, K. P. Huynh, G. Nicholls, D. O’Habib and J. Zhu. 2021a. “Cash and COVID-
19: The Impact of the Second Wave in Canada.” Bank of Canada Staff Discussion Paper No. 2021-12.
Chen, H., W. Engert, K. P. Huynh and D. O'Habib, D. 2021b. “An Exploration of First Nations Reserves and
Access to Cash.” Bank of Canada Staff Discussion Paper No. 2021-8.
Chen, H. and M. Strathearn. 2020. “A Spatial Model of Bank Branches in Canada.” Bank of Canada Staff
Working Paper No. 2020-4.
Chen, H., M. Strathearn and M. Voia. 2021. “Consumer Cash Withdrawal Behaviour: Branch Networks and
Online Financial Innovation.” Bank of Canada Staff Working Paper No. 2021-28.
Dahlhaus, T., and A. Welte. 2021. ‘’Payment Habits During COVID-19: Evidence from High-Frequency
Transaction Data.’’ Bank of Canada Staff Working Paper No. 2021-43.
Donze, J. and I. Dubec. 2009. “Paying for ATM Usage: Good for Consumers, Bad for Banks?” The Journal of
Industrial Economics 57 (3): 583-612.
Donze, J. and I. Dubec. 2011. “ATM Direct Charging Reform: The Effect of Independent Deployers on
Welfare.” Review of Network Economics 10 (2): 1–23.
Engert, W. and B. S. C. Fung. 2019. “Cashless Bank Branches in Canada.” Bank of Canada Staff Analytical
Note No. 2019-29.
Engert, W., B. S. C. Fung and S. Hendry. 2018. “Is a Cashless Society Problematic?” Bank of Canada Staff
Discussion Paper No. 2018-12.
Engert, W., B. S. C. Fung and B. Segendorf. 2019. “A Tale of Two Countries: Cash Demand in Canada and
Sweden.” Bank of Canada Staff Discussion Paper No. 2019-7.
Huynh, K. P., G. Nicholls and O. Shcherbakov. 2019. “Explaining the Interplay between Merchant
Acceptance and Consumer Adoption in Two-Sided Markets for Payment Methods.” Bank of Canada Staff
Working Paper No. 2019-32.
Huynh, K. P., G. Nicholls and O. Shcherbakov. 2022. “Equilibrium in Two-Sided Markets for Payments:
Consumer Awareness and the Welfare Cost of the Interchange Fee.” Bank of Canada Staff Working Paper
No. 2022-15.
Kreiss, K. M. 2021. “Bank Branches and COVID-19: Where Are Banks Closing Branches During the
Pandemic?” FEDS Notes, Washington: Board of Governors of the Federal Reserve System.
Morgan, D. P., M. L. Pinkovskiy and B. Yang. 2016. “Banking Deserts, Branch Closings, And Soft
Information.” Liberty Street Economics No. 20160307, Federal Reserve Bank of New York.
8Rösl, G. and F. Seitz. 2021. “Cash and Crises: No Surprises by the Virus.” Goethe University Frankfurt
Institute for Monetary and Financial Stability Working Paper No. 150.
Scholnick, B., N. Massoud, A. Saunders, S. Carbo-Valverde and F. Rodríguez-Fernández. 2008. “The
Economics of Credit Cards, Debit Cards and ATMs: A Survey and Some New Evidence.” Journal of Banking
and Finance 32 (8): 1468–1483.
Stix, H. 2020. “A Spatial Analysis of Access to ATMs in Austria.” Austrian Central Bank Monetary Policy &
The Economy Q3/20: 39–59.
Tischer, D., J. Evans and S. Davies. 2019. “Mapping the Availability of Cash: A Case Study of Bristol's
Financial Infrastructure.” University of Bristol.
9You can also read


