CALIBRATION OF THE FIRST DETECTOR FLIGHT MODELS FOR THE HERMES CONSTELLATION AND THE SPIRIT MISSION
←
→
Page content transcription
If your browser does not render page correctly, please read the page content below
Calibration of the first detector flight models for the
                                                         HERMES constellation and the SpIRIT mission
                                                      Riccardo Campanaa , Giulia Baronia,b , Giovanni Della Casac , Giuseppe Dilillod ,
                                                 Ezequiel J. Marchesinia , Francesco Ceraudod , Alejandro Guzmáne , Paul Heddermane , and
                                                                                      Yuri Evangelistad
                                                                                      a
                                                                                   INAF/OAS, Bologna, Italy
                                                        b
                                                         University of Bologna, Department of Physics and Astronomy, Bologna, Italy
arXiv:2210.13860v1 [astro-ph.IM] 25 Oct 2022

                                                c
                                                  University of Udine, Department of Mathematical, Physical and Computer Sciences, Udine,
                                                                                              Italy
                                                                                   d
                                                                                     INAF/IAPS, Rome, Italy
                                                e
                                                  Eberhard Karls Universität, Institute for Astronomy and Astrophysics, Tübingen, Germany

                                                                                               ABSTRACT
                                               HERMES (High Energy Rapid Modular Ensemble of Satellites) is a space-borne mission based on a constellation
                                               of six 3U CubeSats flying in a low-Earth orbit, hosting new miniaturized instruments based on a hybrid Silicon
                                               Drift Detector/GAGG:Ce scintillator photodetector system sensitive to X-rays and γ-rays. Moreover, the HER-
                                               MES constellation will operate in conjunction with the Australian-Italian Space Industry Responsive Intelligent
                                               Thermal (SpIRIT) 6U CubeSat, that will carry in a Sun-synchronous orbit (SSO) an actively cooled HERMES
                                               detector system payload. In this paper we provide an overview of the ground calibrations of the first HERMES
                                               and SpIRIT flight detectors, outlining the calibration plan, detector performance and characterization.
                                               Keywords: CubeSat, HERMES, Gamma-ray detectors, Scintillators, Silicon Drift Detectors

                                                                                          1. INTRODUCTION
                                               The HERMES-Technologic and Scientific pathfinder∗ (HERMES-TP/SP)1–3 project involves a constellation of
                                               six 3U nanosatellites hosting simple but innovative X-ray detectors for the monitoring of cosmic high energy
                                               transients, such as Gamma Ray Bursts and the electromagnetic counterparts of Gravitational Wave events. The
                                               main objective of HERMES-TP/SP is to prove that accurate position of high energy cosmic transients can be
                                               obtained using miniaturized hardware, with cost at least one order of magnitude smaller than that of conventional
                                               scientific space observatories and development time as short as a few years.
                                                   The HERMES-TP project is funded by the Italian Ministry for education, university and research and the
                                               Italian Space Agency. The HERMES-SP project is funded by the European Union’s Horizon 2020 Research
                                               and Innovation Programme under Grant Agreement No. 821896. The constellation should be tested in orbit in
                                               ∼2023–24.
                                                  HERMES-TP/SP is intrinsically a modular experiment that can be naturally expanded to provide a global,
                                               sensitive all sky monitor for high energy transients. As such, one HERMES detector will fly onboard the SpIRIT
                                               (Space Industry Responsive Intelligent Thermal ) mission,4 designed by the University of Melbourne.
                                                   The foreseen detector for this experiment employs the solid-state Silicon Drift Detectors (SDD) developed
                                               by INFN and FBK in the framework of the ReDSoX Collaboration† . These devices, characterized by a very
                                               low intrinsic electronic noise, are sensitive to both X-ray and optical photons. Hence they can be exploited
                                               in the so-called “siswich” architecture, acting both as direct X-ray detectors (the operative “X-mode”) and as
                                                 On behalf of the HERMES collaboration.
                                                 Further author information: send correspondence to R.C., E-mail: riccardo.campana@inaf.it
                                                 ∗
                                                   https://www.hermes-sp.eu
                                                 †
                                                   http://redsox.iasfbo.inaf.it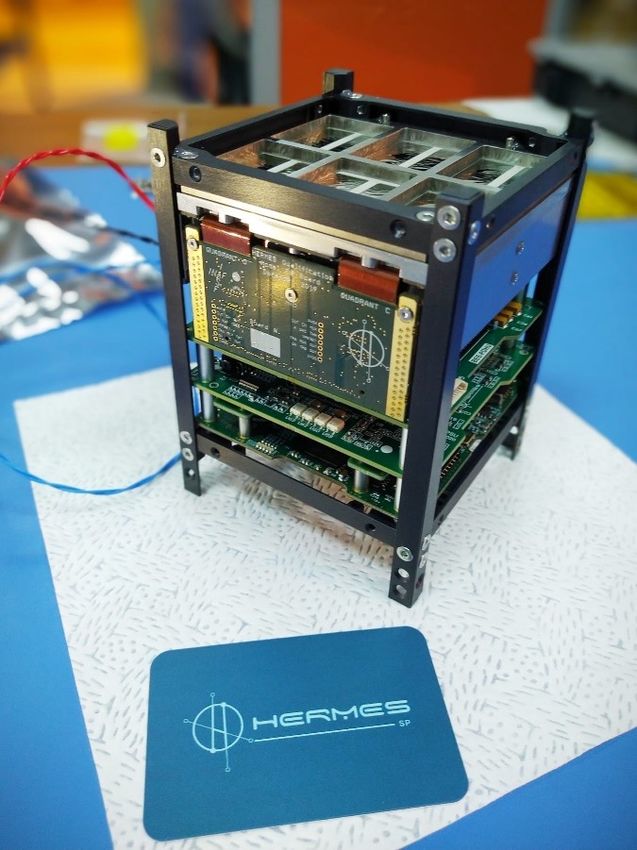
photodetectors for the scintillation light produced by the absorptions of a γ-ray in a scintillator cyrstal (“S-
mode”). This allows for the realisation of a single, compact experiment with a sensitivity band from a few keV
up to a few MeVs for X and γ-rays, and with a high temporal resolution (
prepares therefore an event record containing timestamp information, the address and the amplitude of each
triggering channel, which is stored in a buffer and then transferred through a serial interface to the Payload Data
Handling Unit (PDHU).
   Usually, when an X-ray interaction in the SDD silicon bulk occurs, only one triggering channel is present
(X-mode event). Otherwise, if the incoming photon is absorbed in a scintillator crystal, the two channels reading
out the crystal are triggered (S-mode event).

                               3. HERMES CALIBRATION OVERVIEW
The main aim of the X-mode calibration is the determination of the electronic gain and offset for each channel.
When an X-ray is absorbed in the SDD silicon bulk, on average one electron is produced every 3.65 eV of
deposited energy (assuming as an average value the one calculated for a temperature of 300 K and at an energy
of 5.9 keV5 ). Consequently, there is a linear relation between the X-ray energy and the signal amplitude in
electrons. The gain and offset are defined as the slope and intercept of the linear fit between the measurements
in a recorded spectrum of known photon line energies, expressed in electrons:

                                 y[ADC] = x[e− ] × Gain[ADC/e− ] + Offset[ADC]                                  (1)

The calibration of a given recorded amplitude A in units of [e−] is then performed by:

                                                           A[ADC] − Offset
                                                A[e− ] =                                                        (2)
                                                               Gain

   For X-mode events, the amplitude can be therefore expressed in keV as:

                            3.65[eV/e− ]                                           A[ADC] − Offset
              A[keV] =                   A[e− ] = 0.00365[keV/e− ]A[e− ] = 0.00365                              (3)
                           1000[eV/keV]                                                Gain

    On the other hand, the main aim of the S-mode calibration is the verification of the effective light output for
each channel. The effective light output LY is defined as the number of electrons produced at the SDD anode for
unit of energy absorbed in the scintillator crystal and is measured in [e− /keV]. As such, it is the product between
the intrinsic light yield (i.e., the number of scintillation photons produced per unit of absorbed γ-ray energy),
the optical contact efficiency (the fraction of scintillation photons able to reach the SDD surface window, which
may change from one channel to another) and the SDD quantum efficiency (the fraction of scintillation photons
able to produce one electron of charge in the active silicon bulk; on average, one optical photon produces an
electron). The effective light output is known to be a non-proportional quantity, i.e., its value depends also on
the energy. This effect is being characterized on the same HERMES scintillator crystals with a dedicated setup
(Campana et al., 2022, in preparation) and parameterized in the scientific pipeline. The effective light output
also depends on the temperature, with an expected ∼20% increase by going from room temperature to −20 ◦ C.
Therefore, the signal amplitude for S-mode events is expressed in keV as:

                                               A[e− ]           1       A[ADC] − Offset
                              A[keV] =                   =                                                      (4)
                                            LY [e− /keV]   LY [e− /keV]     Gain

where LY is the light output for the given channel (and the given temperature).
    To reconstruct the event read out by two channels (a, b) optically connected to the same crystal, its amplitude
is given by:

                                 Aa [e− ]
                                      + Ab [e− ]
            Atot [keV] =         −
                        LYa           + LYb [e− /keV]
                               [e /keV]
                                                                                                                (5)
                                                        Aa [ADC] − Offseta   Ab [ADC] − Offsetb

                                      1
                      =                                                    +
                        LYa [e− /keV] + LYb [e− /keV]         Gaina                Gainb
4. CALIBRATION SETUP
The calibration parameters to be determined are thus, for each channel, the electronic gain, the offset and the
effective light output. Each of these parameters will also be temperature-dependent, therefore a calibration
should be performed at different temperatures (spanning the foreseen operating temperature, which is ∼ 5 ◦ C
for HERMES and ∼ −15 ◦ C for SpIRIT). The calibration is performed by placing the flight unit in a suitable
temperature-controlled climatic chamber, and illuminating the detector with standard laboratory calibration
sources (e.g., 55 Fe, 109 Cd, 241 Am, 137 Cs).
Win 10 PC.
UPS SMT3000IC PL configuration and acquisition
Data storage
USB I/V/T monitoring
POWER
(220V)
USB
POWER PC-PDHU Interface
(220 V) Payload
I2C
Continuous power and USB
safe shut-down
Ethernet Mini-PC with RS-422
Serial-to-UART
Serial-to-I2C
Serial-to-USB
Power generation and
data logging
(I/V, 200 ms sampling)
Debug-UART
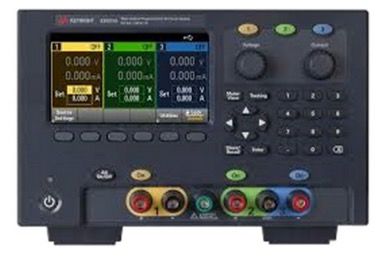
Keysight E36312A
EGSE
POWER
(5 V, 12 V, 3.3 V)
TESTO 174H
Environmental
monitoring
Figure 2. Sketch of the HERMES EGSE used for the calibrations.
The HERMES calibrations are performed in a class 10000 clean room at the INAF/IAPS laboratories in
Rome, Italy. The electronic ground segment equipment (EGSE) used is shown in Figure 2. The flight payload
unit is placed in the climatic chamber, and the PDHU is connected to a standard laboratory PC using a custom-
made interface. A desktop power supply provides the three power lines required by the payload (3.3 V, 5.0 V
and 12 V).
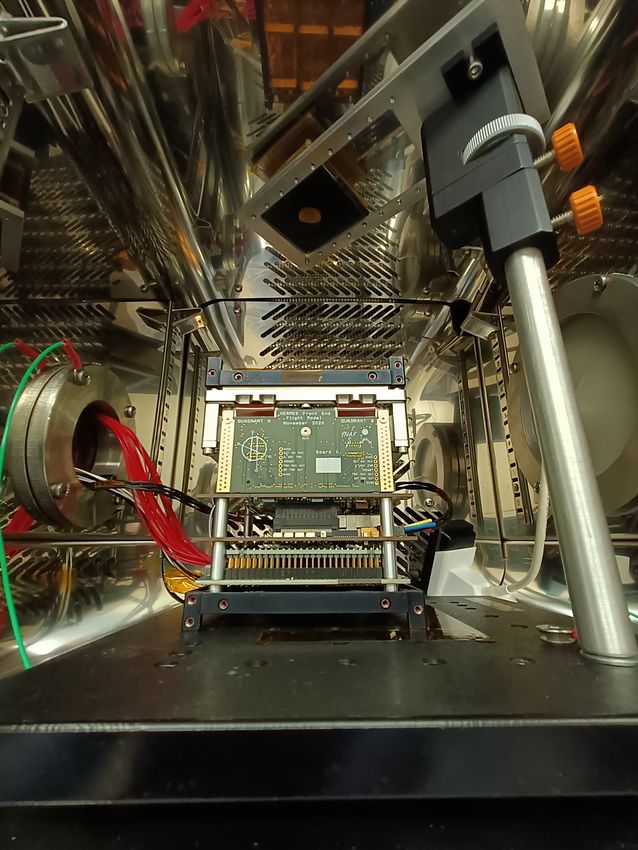
The climatic chamber has an available internal volume of around 1000 cm3 . The radioactive sources are
hosted on a custom-made, 3-D printed source holder. Suitable recesses allow to host the available radioactive
sources, using also specific adapters. A 3-D printed cover allows to fix the sources in place. The source holder
is mounted on a movable arm placed inside the climatic chamber, with the sources usually placed at 18–20 cm
from the detector top side, allowing for an almost uniform coverage of the detector plane (maximum off-axis
angle is ∼15◦ –20◦ ).
The calibration plan executed on the PFM and FM1 flight units can be summarized as follows:
1. Radioactive sources (55 Fe, 109 Cd, 241 Am, 137 Cs) are placed on the source holder. Usually, a measurement
is performed using several sources at once.
2. The climatic chamber is set at a given temperature. The temperature steps used are +20 ◦ C, +10 ◦ C,
0 ◦ C, −10 ◦ C, −20 ◦ C.
3. The payload is switched on and put in the Idle operative mode (all the quadrants configured and detector
high voltage ramped up).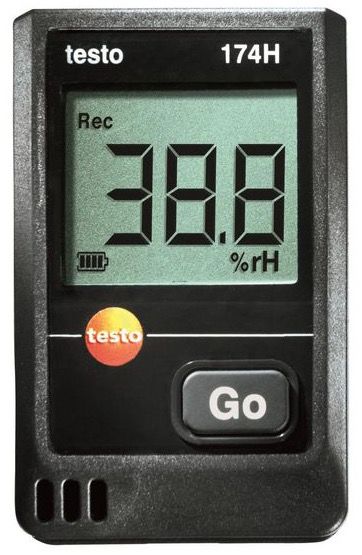
4. Once the payload is in a stable thermal environment (as monitored by the external and internal temperature
sensors) a data acquisition is performed, accumulating at least 105 counts for each radioactive source and
each channel.
5. Data is downloaded and analyzed.
6. The climatic chamber is set at an another temperature, and the sequence starts again.
Figure 3. HERMES FM1 unit placed inside the climatic chamber. The source holder is visible on the upper side.
5. DATA REDUCTION PIPELINE
The raw, binary data acquisition files are converted in a standard FITS “Level 0” format. An additional
conversion in a FITS “Level 0.5” format useful for further processing is also performed. The data calibration
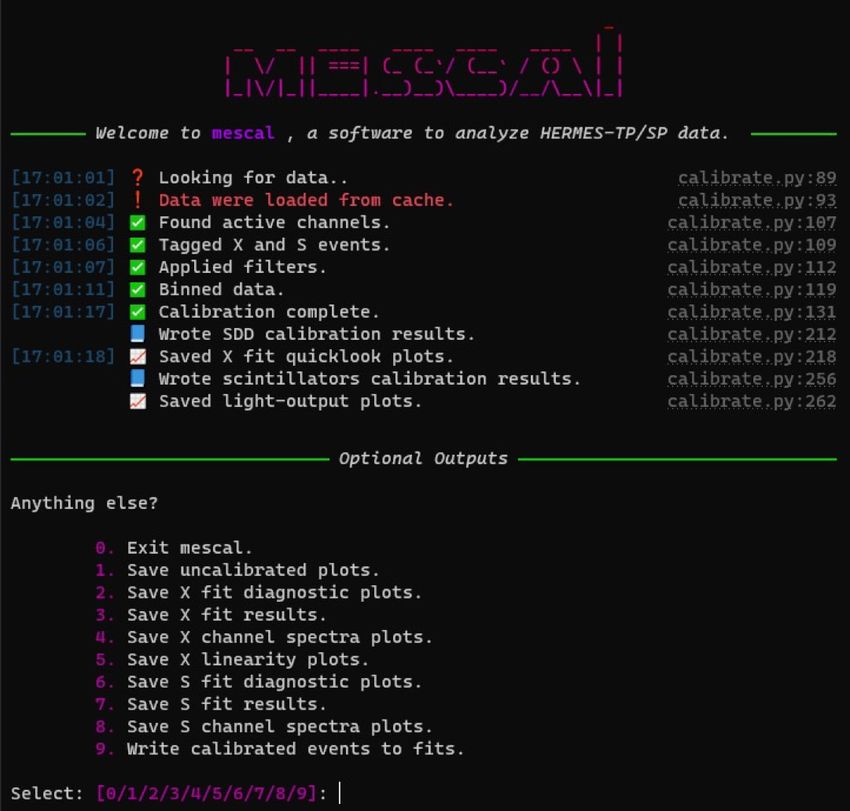
and analysis is performed using mescal, a custom-made highly automatized pipeline of Python scripts.
The mescal pipeline (Figure 4) requires a Level 0.5 input file, and to explicitly define the list of the radioactive
sources which were used for the calibration data acquisition. The given energy units for the calibration source
list will be the units of the output calibrated spectra. Then, the general algorithm proceeds as follows:
1. Data readout
The input data is readout and organized in a Python pandas data frame, i.e., a table with rows representing
a photon event and columns storing the relevant information.
2. Event type discrimination and tagging, multiplicity filtering and histogram building
Events are tagged as “X-mode” or “S-mode”, to discriminate between events generated directly in the
SDDs and events generated in the scintillators. The logic behind the event discrimination process consists
of looking at the list of the channels readout in the same trigger cycle, and tag events seen simultaneously
by both channels reading the same crystal as ‘S’, otherwise as ‘X’. Tags are defined and stored for each
individual event. It is worth noting that this tag does not consider event multiplicity. Two spectra are then
obtained, by building the histogram of ‘X’- and ‘S’-tagged events, respectively. These spectra only include
events with multiplicity of exactly 1, for the former, and with multiplicity of exactly 2 for the latter.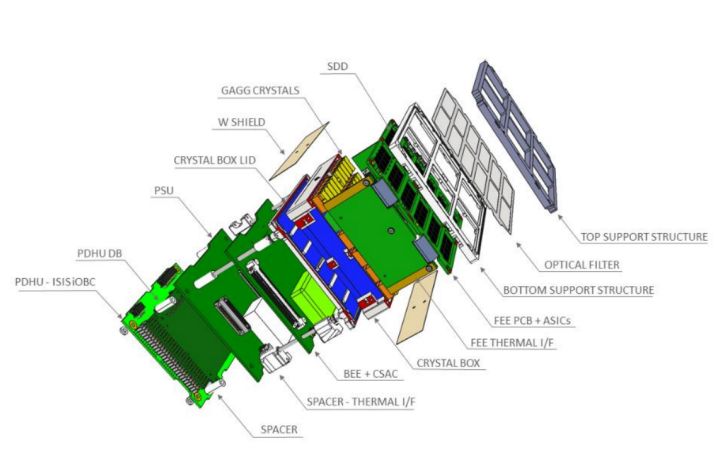
Figure 4. Left: block diagram of the mescal logic structure. Right: output option menu given by mescal.

3. X-mode calibration
   If at least one of the user-input radioactive sources is listed as a X-ray emitting calibration source, then the
   algorithm will attempt to perform energy calibration on the X-mode spectra. To achieve this, the relative
   differences between all known X-ray lines of all the radioactive sources are measured, in the energy space.
   Then, a peak-finding filter is run on the data. The peaks are chosen by comparing each local maxima to
   their immediate surroundings, defining a ranking of prominence for each line. These positions are used as
   input for a Gaussian-profile fitting algorithm (using the lmfit package), which returns the best-fit peak
   position and full-width half maximum (FWHM) for each line.
   The differences between these peak positions in the ADC space and in the energy space for each line are
   then compared, for different sets of N data lines, where N is the number of all the X-mode calibration
   lines that are being used. The set of N data lines with the smallest distance dispersion with respect to the
   calibration lines will be chosen, and identified with the respective calibration lines.
   The set of pairs composed of the ADC value for the centroid of a data line and the energy value of its
   corresponding calibration line are given as input to a least-squares linear fit algorithm. The fit will return
   gain, offset and their errors for each channel. The console will list for which channels, if any, this calibration
   step failed.
   Each event will then be separately calibrated for each channel in energy units, and a final calibrated X-mode
   event list will be created.
4. S-mode calibration
   If at least one of the user-input radioactive sources is listed as a γ-ray emitting calibration source, the
   algorithm will attempt to perform energy calibration on the S-mode spectra. Since the scintillator effective
   light output is referenced to the 661.67 keV 137 Cs line, the algorithm automatically uses the peak finding
   procedure to find this line, assuming it is the only line present. Then, a Gaussian-profile fitting algorithm
   is run on the position given by the peak finder, which returns the position of the center of the line and its
   FWHM.
   Then, for each channel, the algorithm takes the gain and offset parameters found during the X-mode
   calibration and converts the S-mode spectrum in units of electrons. This spectrum is then used to derive
   the light output for each single channel by fitting the 661.67 keV line.
   Finally, for each pair of channels reading the same crystal, the events are summed event-by-event in electrons
   and normalized to the sum of the light output of both coupled channels. This returns a crystal-summed
   event list in energy units. The console will list the channels, if any, for which this calibration step failed.
5. Visualization plots and output writing
The program will ask the user to define what results to write as output tables, and which plots to be saved
      as output (Figure 4).

                                                         6. OVERVIEW OF THE RESULTS
Figure 5 shows the measured distribution of gain and offset on the FM1 channels. The spread around the average
value is of a few percent, and consistent with the expectations.

                                                                                                             0.0010
                                  8
              Normalised counts

                                                                                         Normalised counts
                                                                                                             0.0008
                                  6
                                                                                                             0.0006

                                  4
                                                                                                             0.0004

                                  2
                                                                                                             0.0002

                                  0                                                                          0.0000
                                      0.55       0.60        0.65          0.70                                       15000 15250 15500 15750 16000 16250 16500
                                                 Gain    [ADC/e− ]                                                                  Offset [ADC]

Figure 5. Distribution of the measured gain and offset values on the HERMES FM1 payload, at a temperature of −10 ◦ C.

   Figure 6 shows the calibrated X-mode spectrum for a representative channel, showing the X-ray lines of the
55
  Fe and 109 Cd sources between ∼6 and ∼25 keV. The lower threshold is below 2 keV, while the resolution at 6
keV is ∼300 eV FWHM.

                                                             HERMES FM1 X-mode Quadrant B Channel 26
                                                      2000

                                                      1750
                                                                                                                               109 Cd

                                                      1500

                                                      1250
                                                                        55 Fe
                                             Counts

                                                      1000

                                                       750

                                                       500

                                                       250

                                                         0
                                                                    5             10                 15                20         25        30
                                                                                       Energy [keV]
Figure 6. X-mode calibrated spectrum of 55 Fe and 109 Cd radioactive sources for a representative channel, at a temperature
of −20 ◦ C.

   Figure 7 shows the S-mode spectrum for the whole detector, calibrated and summed over all the channels
and scintillator crystals, showing the γ-ray lines of the 137 Cs and 109 Cd sources at ∼662 and ∼88 keV.

                                                                         7. CONCLUSIONS
The first two HERMES flight models, PFM and FM1 (SpIRIT), have been successfully integrated and calibrated.
For each of the 120 detector channels, characteristics such as the gain, offset and effective light output have been
determined, also as a function of the operating temperature.
HERMES FM1 S-mode

                                                109 Cd
                                    20000

                                    15000

                           Counts
                                    10000

                                     5000                                          137 Cs

                                        0
                                            0        200        400          600            800
                                                              Energy [keV]
Figure 7. Summed S-mode calibrated spectrum of the whole FM1 HERMES detector, illuminated with 137 Cs and 109 Cd
radioactive sources, at a temperature of −20 ◦ C. The Cd 88 keV and Cs 662 keV lines (with Compton continuum) are
well apparent.

    The FM1 detector is presently being integrated with the SpIRIT spacecraft at the University of Melbourne
(Australia). The PFM will be integrated with the HERMES platform in September 2022 at Polytechnic of Milan.
At each stage of the full satellite integration suitable measurements will be performed to check and verify the
validity of the calibrations.
   The next five HERMES flight models (FM2 to FM6) will be integrated and calibrated in the second half of
2022.

                                                ACKNOWLEDGMENTS
This work has been carried out in the framework of the HERMES-TP and HERMES-SP collaborations. We
acknowledge support from the European Union Horizon 2020 Research and Innovation Framework Programme
under grant agreement HERMES-Scientific Pathfinder n. 821896 and from ASI-INAF Accordo Attuativo HER-
MES Technologic Pathfinder n. 2018-10-H.1-2020.

                                                         REFERENCES
[1] Fuschino, F., Campana, R., Labanti, C., Evangelista, Y., Feroci, M., Burderi, L., Fiore, F., Ambrosino,
    F., Baldazzi, G., Bellutti, P., Bertacin, R., Bertuccio, G., Borghi, G., Cirrincione, D., Cauz, D., Ficorella,
    F., Fiorini, M., Gandola, M., Grassi, M., Guzman, A., La Rosa, G., Lavagna, M., Lunghi, P., Malcovati,
    P., Morgante, G., Negri, B., Pauletta, G., Piazzolla, R., Picciotto, A., Pirrotta, S., Pliego-Caballero, S.,
    Puccetti, S., Rachevski, A., Rashevskaya, I., Rignanese, L., Salatti, M., Santangelo, A., Silvestrini, S.,
    Sottile, G., Tenzer, C., Vacchi, A., Zampa, G., Zampa, N., and Zorzi, N., “HERMES: An ultra-wide band X
    and gamma-ray transient monitor on board a nano-satellite constellation,” Nuclear Instruments and Methods
    in Physics Research A 936, 199–203 (Aug. 2019).
[2] Fiore, F. et al., “The HERMES-Technologic and Scientific Pathfinder,” Society of Photo-Optical Instrumen-
    tation Engineers (SPIE) Conference Series 11444, 11444–166 (2020).
[3] Evangelista, Y. et al., “The scientific payload on-board the HERMES-TP and HERMES-SP CubeSat mis-
    sions,” Society of Photo-Optical Instrumentation Engineers (SPIE) Conference Series 11444, 11444–168
    (2020).
[4] Auchettl, K., Trenti, M., Thomas, M., and Fiore, F., “The SpIRIT mission: Multiwavelength detection
    and follow-up of cosmic explosions with an Australian space telescope,” in [AAS/High Energy Astrophysics
    Division ], AAS/High Energy Astrophysics Division 54, 305.02 (Apr. 2022).
[5] Mazziotta, M. N., “Electron hole pair creation energy and Fano factor temperature dependence in silicon,”
Nuclear Instruments and Methods in Physics Research A 584, 436–439 (Jan. 2008).You can also read


