CAKEHAM MANOR ESTATE Coastal Process Analysis 2015 - Monitoring Report - The Southern Coastal Group ...
←
→
Page content transcription
If your browser does not render page correctly, please read the page content below
CAKEHAM MANOR ESTATE
Coastal Process Analysis 2015

Monitoring Report
Eastern Solent Coastal Partnership

                                                   c/o Havant Borough Council

                                                   Public Service Plaza

                                                   Civic Centre Road

                                                   Havant

                                                   PO9 2AX

                                                   Email: sam.cope@havant.gov.uk

                                    Document title: Cakeham Manor Estate: Coastal
                                                    Process Analysis

                                                   Monitoring Report

                                            Date: July 2015

                                          Version: Final

                                         Revision: 1

                                     Prepared by: Dr Samantha Cope – Coastal Project
                                                  Engineer

                                                   Clare Wilkinson – Coastal Engineer

                                      Checked by: Dr Andy Pearce – Operations Team
                                                  Leader

                                    Date checked: 01/07/2015

3 | Coastal Process Analysis 2015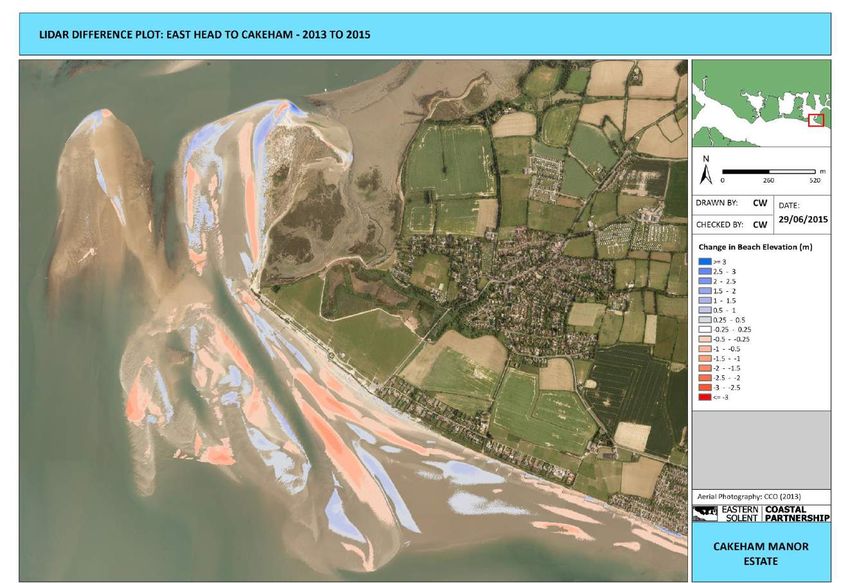
CONTENTS

          1.         INTRODUCTION ...................................................................................................8

               1.1     THE SITE ..................................................................................................................... 8

               1.2     HISTORICAL EVOLUTION ........................................................................................ 10

               1.3     FITZGERALD’s THEORY (2012) ................................................................................ 13

          2.         DECADAL EVOLUTION .....................................................................................14

               2.1     OFFSHORE CONDITIONS ........................................................................................ 14

               2.2       BEACH CHANGE ...................................................................................................... 20

                 2.2.1        Beach sediment type ........................................................................................... 20

                 2.2.2        Profile cross-section area change........................................................................ 22

                 2.2.3        Topographic difference plots ............................................................................... 22

               2.3     BEACH MANAGEMENT PRACTICES ....................................................................... 33

          3.         DISCUSSION.......................................................................................................36

          4.         MONITORING RECOMMENDATIONS ...............................................................40

          5.         CONCLUSIONS ..................................................................................................42

          6.         REFERENCES ....................................................................................................43

          7.         ACKNOWLEDGEMENTS ...................................................................................43

          8.         APPENDIX A: Historic Aerial Photography .....................................................44

          9.         APPENDIX B: Fitzgerald’s (2012) Theory .........................................................47

          10.        APPENDIX C: Topographic Profile Lines .........................................................47

          11.        APPENDIX D: Environment Agency Flood Zones ...........................................48

4 | Coastal Process Analysis 2015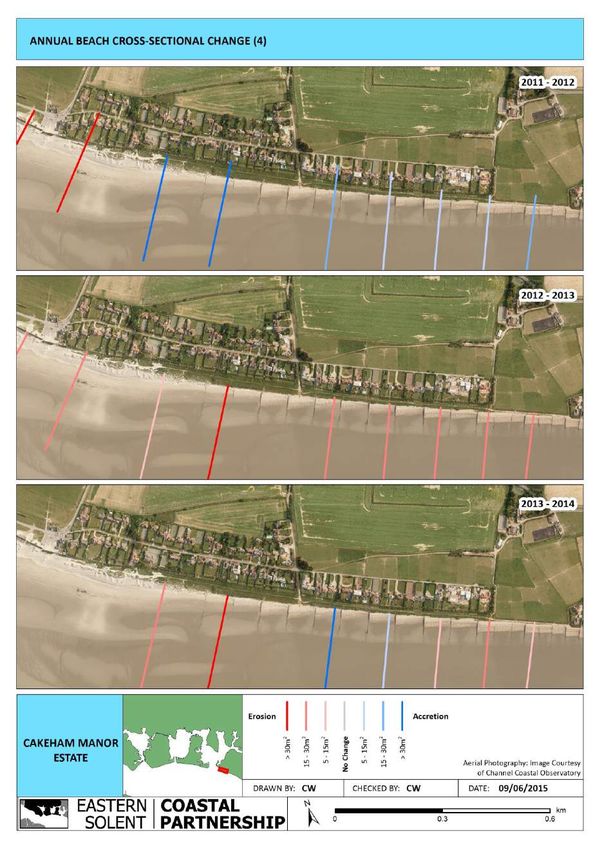
LIST OF FIGURES

         Figure 1.1: Oblique aerial photograph of Cakeham ..................................................................... 8

         Figure 1.2: Photograph location map of Cakeham Manor Estate ................................................ 9

         Figure 1.3: East Head to Pagham, West Sussex: Sediment Transport ..................................... 10

         Figure 1.4: Cakeham wider area photography comparison (1946 - 1994) ................................. 11

         Figure 1.5: Cakeham wider area photography comparison (2001 - 2013) ................................. 12

         Figure 1.6: Stable inlet conceptual model showing dominant longshore transport & wave
         dominated transport (Fitzgerald, 2012) ..................................................................................... 13

         Figure 2.1: Position of wave buoys ........................................................................................... 14

         Figure 2.2: Offshore significant wave height - 2003 to 2014 at Hayling Island wave buoy ......... 15

         Figure 2.3: Offshore significant wave height - 2008 to 2014 at Bracklesham Bay wave buoy ... 15

         Figure 2.4: Storms affecting Hayling Island between 2003 and 2014. ....................................... 17

         Figure 2.5: Storms affecting Bracklesham Bay between 2008 and 2014................................... 17

         Figure 2.6: Sediment type offshore of Cakeham frontage, 2014 ............................................... 19

         Figure 2.7: Change in position of sediment type (2001 - 2013) ................................................. 21

         Figure 2.8: Annual beach change (2003-2005) ......................................................................... 23

         Figure 2.9: Annual beach change (2005-2008) ......................................................................... 24

         Figure 2.10: Annual beach change (2008-2011) ....................................................................... 25

         Figure 2.11: Annual beach change (2011-2014) ....................................................................... 26

         Figure 2.12: Topographic difference plot (2003-2008) .............................................................. 27

         Figure 2.13: Topographic difference plot (2008-2012) .............................................................. 28

         Figure 2.14: Topographic difference plot (2012-2013) .............................................................. 29

         Figure 2.15: Topographic difference plot (2013-2015) .............................................................. 30

         Figure 2.16: Topographic difference plot (2003-2012) .............................................................. 31

         Figure 2.17: Topographic difference plot (2003-2014) .............................................................. 32

         Figure 2.18: Beach Management Activities around the Cakeham area ..................................... 35

         Figure 3.1: Difference plot of wider area around Cakeham Manor Estate: 2003 - 2015 ............ 38

         Figure 3.2: Main erosion hot spots identified from survey data (2003 – 2015) ......................... 39

         Figure 4.1: Low cliffed section at Cakeham .............................................................................. 40

5 | Coastal Process Analysis 2015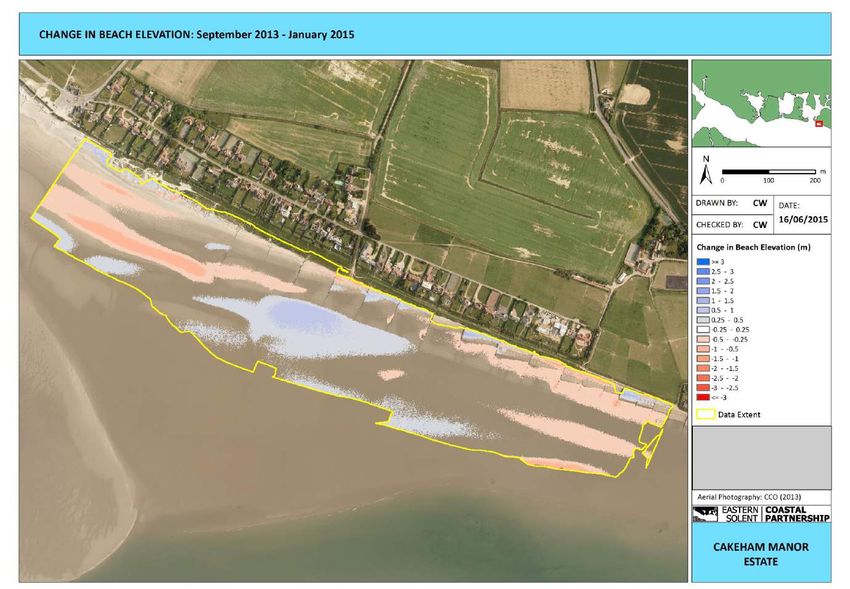
Figure 4.2: Proposed future beach monitoring for Cakeham Manor Estate ............................... 41

          Figure 8.1: Cakeham frontage photography comparison (1946 - 1994) .................................... 45

          Figure 8.2: Cakeham frontage photography comparison (2001 - 2013) .................................... 46

          Figure 11.1: Environment Agency flood zones 2 and 3 under a, “no defences” scenario .......... 48

6 | Coastal Process Analysis 2015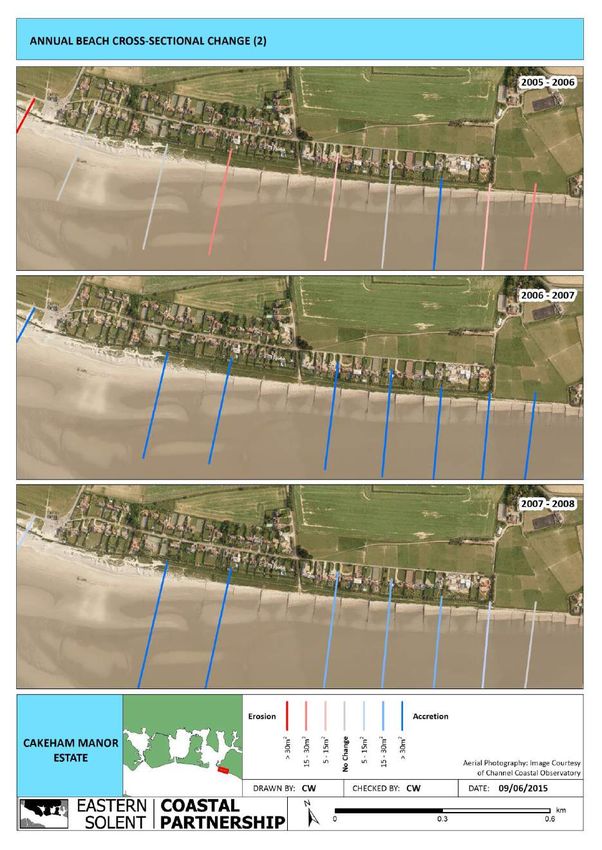
LIST OF TABLES

         Table 2.1: Annual wave statistics - Hayling Island wave buoy................................................... 16

         Table 2.2: Annual wave statistics - Bracklesham Bay wave buoy ............................................. 16

         Table 2.3: Tidal conditions for Chichester Harbour (Entrance), 2015 ........................................ 18

         Table 2.4: Beach management since 2000 between East Head and Bracklesham ................... 33

         Table 4.1: Survey schedule for the South-east Regional Coastal Monitoring Programme ......... 40

7 | Coastal Process Analysis 2015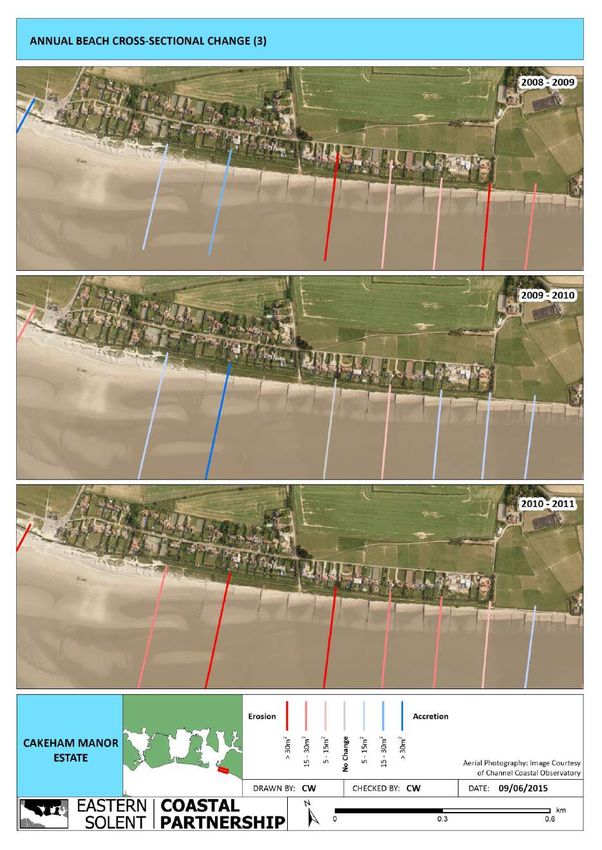
1. INTRODUCTION

        This coastal process report has been prepared by the Eastern Solent Coastal Partnership on
        behalf of Cakeham Manor Estate, summarising evolution of the coastline and the data available
        for monitoring coastal change. The report explores whether any additional data collection is
        required for;

              •   the western end of the frontage to establish if and when the coastline switches from
                  accretion to erosion, according to Fitzgerald’s (2012) theory

              •   the central and eastern section of the frontage, which are generally more vulnerable to
                  erosion (Figure 1.1 and 1.2).

        1.1       THE SITE
        The section of coastline to the east of the Chichester Harbour inlet, West Sussex is extremely
        dynamic in nature given the strong tidal currents, alignment to the dominant south-south-
        westerly wave approach and mixture of sand and shingle beaches. The area of interest is the
        Cakeham Manor Estate frontage, situated between West Wittering and East Wittering, both of
        which have distinct sediment types and coastal processes in operation (Figure 1.1 and 1.2).

                                                                           East Head Spit

                                                      West Wittering

                       Cakeham Manor Estate

                   East Wittering

        Figure 1.1: Oblique aerial photograph of Cakeham, looking towards East Head Spit and Hayling Island ©
        Cope, 2013

        The report presents the historical evolution of the site, with a focus on the last 12 years of data
        and records collected through the South-east Regional Coastal Monitoring Programme
        (www.channelcoast.org) and Chichester District Council, respectively. Recommendations for
        future monitoring and report writing are summarised.

8 | Coastal Process Analysis 2015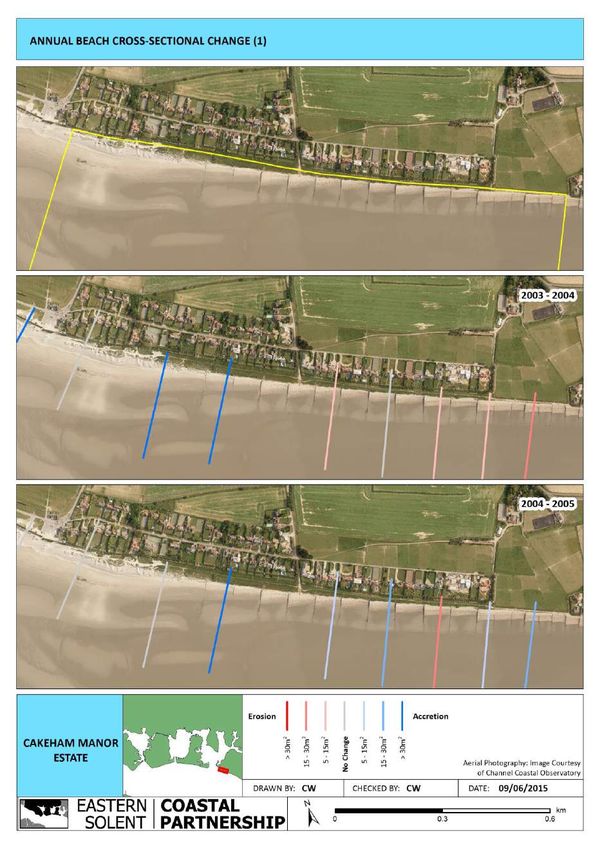
Figure 1.2: Photograph location map of Cakeham Manor Estate

9 | Coastal Process Analysis 2015
1.2     HISTORICAL EVOLUTION
        The West Wittering and west Cakeham frontage is adjacent to the Chichester Harbour ebb-delta
        and therefore has a wide sandy foreshore made up of onshore wave-driven sand bars and sand
        dunes. The area is very much dominated by onshore wind-blown sand and strong tidal
        currents. The east Cakeham and East Wittering frontage is comprised of a gravel beach with a
        lower sandy foreshore, dominated by longshore drift from east to west (Figure 1.2 and 1.3). The
        central section of the Cakeham frontage is situated at the inter-change between the two,
        composed of a wide sandy foreshore with a mixed sand and gravel upper beach, backed by low
        cliffs (Figure 1.2).

                            Cakeham

        Figure 1.3: East Head Spit to Pagham, West Sussex: Sediment Transport (Carter et al., 2004)

        Over time, East Head spit has accreted a large volume of sand and has pivoted at The Hinge
        from a swash-aligned to a drift-aligned feature (ABP, 2001). At the same time, the sand has
        accumulated at West Wittering and west Cakeham, forming prograding sand dune features
        which act as a natural sea defence to the land and properties behind (Figure 1.4 and 1.5;
        Figures 8.1 and 8.2 in Appendix A; Figure 2.7 in Section 2.2.1).

10 | Coastal Process Analysis 2015
Figure 1.4: Cakeham wider area photography comparison (1946 - 1994) 11 | Coastal Process Analysis 2015
Figure 1.5: Cakeham wider area photography comparison (2001 - 2013)

12 | Coastal Process Analysis 2015
Accretion and erosion cycles of the sand dunes and sandy foreshore at west Cakeham are very
            much linked into the wider Chichester Harbour ebb delta system, whilst accretion and erosion of
            the gravel beach at east Cakeham is determined more by longshore drift with some onshore
            feed.

            Cakeham Manor Estate is interested in monitoring these cycles to understand when coastal
            management intervention may be necessary. This is particularly true following the 2013/2014
            storms which eroded parts of the frontage, and a recent report by Fitzgerald (2012) outlining his
            theory on the cyclical nature of the sand component of the Chichester Harbour system.

            1.3      FITZGERALD’S THEORY (2012)
            Fitzgerald’s (2012) theory suggests that sediment is circulated in a counter-clockwise direction
            on the east of the Chichester Harbour inlet (Figure 1.6) and that the beaches experience
            repeated cycles of accretion and erosion relating to the 18.6 year tidal nodal cycle. Fitzgerald
            (2012) notes that accretionary phases last for 5-10 years, following a period of low tidal range.
            With the recent accretionary phase believed to have commenced in 2005 (Fitzgerald, 2012),
            Cakeham Manor Estate are concerned a period of erosion could commence soon (see
            Appendix B for additional detail).

            Additional evidence is required to prove this theory and Fitzgerald (2012) notes that these
            predictions are cautious forecasts.

            Figure 1.6: Stable inlet conceptual model showing dominant longshore transport & wave dominated
            transport (Fitzgerald, 2012)

13 | Coastal Process Analysis 2015
2. DECADAL EVOLUTION
Following establishment of the South-east Regional Coastal Monitoring Programme
(www.channelcoast.org) in 2002, it is now possible to analyse coastal change with more
certainty. Given the 12 years of data available, longer term trends, rather than seasonal
fluctuations can be determined.
When analysing beach volume change and cliff erosion, it is important to also consider the
offshore conditions as well as any coastal management practices. This section presents the
following:
2.1 Offshore conditions
2.2 Beach change
2.3 Beach management practices
2.1 OFFSHORE CONDITIONS
The Hayling Island and Bracklesham Bay directional wave buoys are located within close
proximity to Cakeham and were deployed in ~10mCD water depth in 2003 and 2008
respectively, as part of the South-east Regional Coastal Monitoring Programme (Figure 2.1).
Figure 2.1: Position of wave buoys
The wave buoys show a difference in dominant wave direction between the two locations. The
Hayling Island buoy has a predominant south-south-west wave approach (Figure 2.2), whilst the
Bracklesham Bay buoy has a more predominant south-west approach (Figure 2.3). Wave
energy from the west is low because of the sheltering effect of the Isle of Wight (Bray, 2010).
14 | Coastal Process Analysis 2015Offshore Wave Hs (m)
Hayling Island WB : 10/07/2003 - 31/12/2014
0
345 15
330 30 >= 0.00 < 0.50 (m)
315 45 >= 0.50 < 1.00 (m)
>= 1.00 < 1.50 (m)
300 60
>= 1.50 < 2.00 (m)
285 75
>= 2.00 < 2.50 (m)
>= 2.50 < 3.00 (m)
270 10% 90
>= 3.00 < 3.50 (m)
>= 3.50 < 4.00 (m)
255 105
>= 4.00 < 4.50 (m)
240 120 >= 4.50 < 5.00 (m)
>= 5.00 < 5.50 (m)
225 135
>= 5.50 < 6.00 (m)
210 150
195 165 >= 6.00 = 0.00 < 0.50 (m)
315 45 >= 0.50 < 1.00 (m)
>= 1.00 < 1.50 (m)
300 60
>= 1.50 < 2.00 (m)
285 75
>= 2.00 < 2.50 (m)
>= 2.50 < 3.00 (m)
270 10% 90
>= 3.00 < 3.50 (m)
>= 3.50 < 4.00 (m)
255 105
>= 4.00 < 4.50 (m)
240 120 >= 4.50 < 5.00 (m)
>= 5.00 < 5.50 (m)
225 135
>= 5.50 < 6.00 (m)
210 150
195 165 >= 6.00Table 2.1 and 2.2 present the maximum wave height per year for the Hayling Island and
Bracklesham Bay wave buoy respectively.
Table 2.1: Annual wave statistics - Hayling Island wave buoy (Mylroie and Evans, 2014)
Year Annual Maximum Hs
Date Amax (m)
2003 29-Nov-2003 10:00 2.68
2004 08-Jan-2004 10:30 3.64
2005 02-Dec-2005 17:00 3.53
2006 03-Dec-2006 08:00 3.42
2007 18-Jan-2007 13:00 3.58
2008 10-Mar-2008 08:00 3.79
2009 14-Nov-2009 13:30 3.36
2010 11-Nov-2010 08:30 3.25
2011 13-Dec-2011 01:00 3.77
2012 03-Jan-2012 08:30 3.32
2013 28-Oct-2013 06:00 3.73
2014 05-Feb-2014 14:30 4.13
Table 2.2: Annual wave statistics - Bracklesham Bay wave buoy (Mylroie and Evans, 2014)
Annual Maximum Hs
Year
Date Amax (m)
2008 09-Nov-2008 23:00 3.28
2009 23-Nov-2009 13:00 3.83
2010 31-Mar-2010 09:30 3.46
2011 13-Dec-2011 00:00 3.64+
2012 03-Jan-2012 09:00 3.67
2013 24-Dec-2013 02:00 4.13
2014 15-Feb-2014 00:00 4.47
Both tables show 2014 as being the year with the highest wave heights since the buoys were
deployed. Bradbury and Mason (2014) note that the storm on the 5th February 2014 recorded
as 4.13 m by the Hayling buoy (Table 2.1) had a return period of 1:50 years, whilst the storm on
the 15th February 2014, recorded by the Bracklesham buoy (Table 2.2) had a return period of
1:20 years.
The following storm charts show that the winter of 2013/2014 was the stormiest season on
record since the buoys were deployed. Not only were there many more storms during this
winter but they were larger than previous years (Bradbury and Mason, 2014).
16 | Coastal Process Analysis 2015Figure 2.4: Storms affecting Hayling Island between 2003 and 2014. 2014 storms are shown in red (Mylroie and Evans, 2014). Figure 2.5: Storms affecting Bracklesham Bay between 2008 and 2014. 2014 storms are shown in red (Mylroie and Evans, 2014) The tidal conditions for Chichester Harbour entrance are shown in Table 2.3. 17 | Coastal Process Analysis 2015
Table 2.3: Tidal conditions for Chichester Harbour (Entrance), 2015

                                 Tide Condition    Level (mCD)       Level (mOD)
                                 LAT               +0.2              -2.54
                                 MLWS              +0.9              -1.84
                                 MLWN              +1.9              -0.84
                                 MSL               +2.9              0.16
                                 MHWN              +4.0              1.26
                                 MHWS              +4.9              2.16
                                 HAT               +5.3              2.56

     Figure 2.6 presents mapping of the seabed sediment type offshore of Cakeham. The majority is
     sand with a coarse sediment bank to the east, in front of East Wittering (Evans and Colenutt,
     2015).

18 | Coastal Process Analysis 2015
Figure 2.6: Sediment type offshore of Cakeham frontage, 2014 (Evans and Colenutt, 2015) 19 | Coastal Process Analysis 2015
2.2 BEACH CHANGE
The following section analyses data from the South-east Regional Coastal Monitoring
Programme to show:
2.2.1 Beach sediment type
2.2.2 Profile cross-section area change
2.2.3 Topographic difference plots
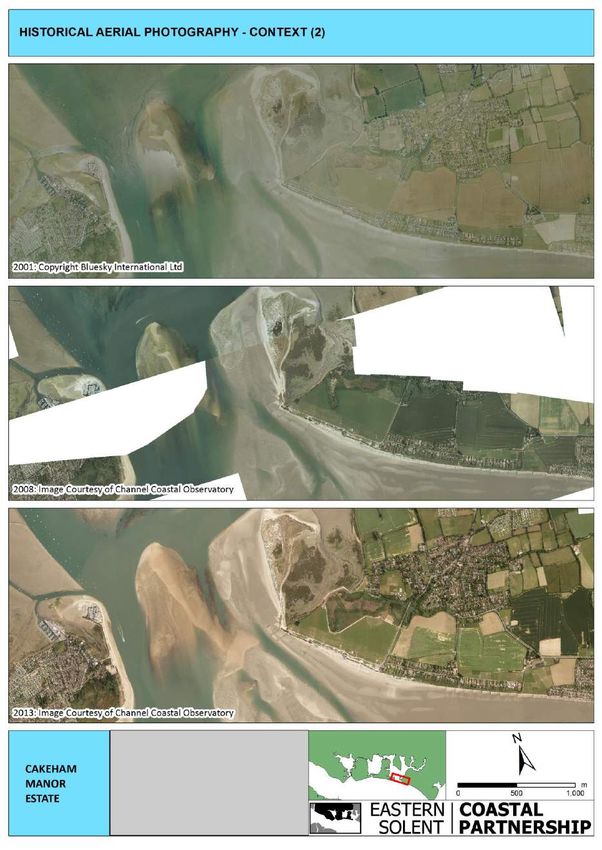
2.2.1 BEACH SEDIMENT TYPE
Beach sediment type changes were mapped from aerial photography flown in 2001, 2008 and
2013 (Figure 2.7). Sediment types identified include gravel, gravel and sand, sand and sand
dunes.
The sand dunes (mapped in green) have accreted to the east since the 2001 mapping. There
appears to be an area (circled in red) which switches between sand and mixed gravel and sand
as the gravel travels west and the sand progrades east. The gravel portion of the beach (grey)
appears to be more dominated by mixed gravel and sand in 2013 compared to other years.
20 | Coastal Process Analysis 2015Figure 2.7: Change in position of sediment type (2001 - 2013) 21 | Coastal Process Analysis 2015
2.2.2    PROFILE CROSS-SECTION AREA CHANGE
       The profile lines represent annual change on the beach at the position shown by the lines. The
       surveys are carried out using kinematic GPS by surveyors on the beach, with an accuracy of
       ±2cm. The lines represent accretion (blue) and erosion (red), and display actual change in m2.

       The difference in profile cross-sectional area is presented, showing change annually between
       2003 and 2014 (Figures 2.8 – 2.11). Additional information on interpretation of the profiles is
       presented in Appendix C; when analysing, “actual change,” the results are dependent on the
       length of the profile line surveyed.

       2.2.3    TOPOGRAPHIC DIFFERENCE PLOTS
       In order to show change in beach levels across the whole beach, ‘difference plots’ were created
       by subtracting one survey from another in GIS. A decrease in beach elevation is shown in red
       and an increase in beach elevation is shown in blue. The extent of the difference plots is
       depicted with a yellow boundary. Topographic beach data was used where possible with an
       accuracy of ±2cm; otherwise lidar data was included, which has a vertical accuracy of ±15cm.

       The following difference plots were created:

                2003-2008:        Figure 2.12 shows the first 5 years of change

                2008-2012:        Figure 2.13 shows the latter 5 years of change

                2012-2013:        Figure 2.14 shows change before the major 2013/2014 storms1

                2013-2015:        Figure 2.15 shows change after the major 2013/2014 storms1

                2003-2012:        Figure 2.16 shows long term change before the 2013/2014 storms

                2003-2015:        Figure 2.17 shows long term change after the 2013/2014 storms1

       12013 and 2015 lidar data (© Environment Agency) still to be quality checked. Outputs to be used with caution until
       data is signed off in Autumn 2015

22 | Coastal Process Analysis 2015
Figure 2.8: Annual beach change (2003-2005) 23 | Coastal Process Analysis 2015
Figure 2.9: Annual beach change (2005-2008)

24 | Coastal Process Analysis 2015
Figure 2.10: Annual beach change (2008-2011)

25 | Coastal Process Analysis 2015
Figure 2.11: Annual beach change (2011-2014)

26 | Coastal Process Analysis 2015
Figure 2.12: Topographic difference plot (2003-2008)

27 | Coastal Process Analysis 2015
Figure 2.13: Topographic difference plot (2008-2012)

28 | Coastal Process Analysis 2015
Figure 2.14: Topographic difference plot (2012-2013)

29 | Coastal Process Analysis 2015
Figure 2.15: Topographic difference plot (2013-2015)

30 | Coastal Process Analysis 2015
Figure 2.16: Topographic difference plot (2003-2012)

31 | Coastal Process Analysis 2015
Figure 2.17: Topographic difference plot (2003-2015)

32 | Coastal Process Analysis 2015
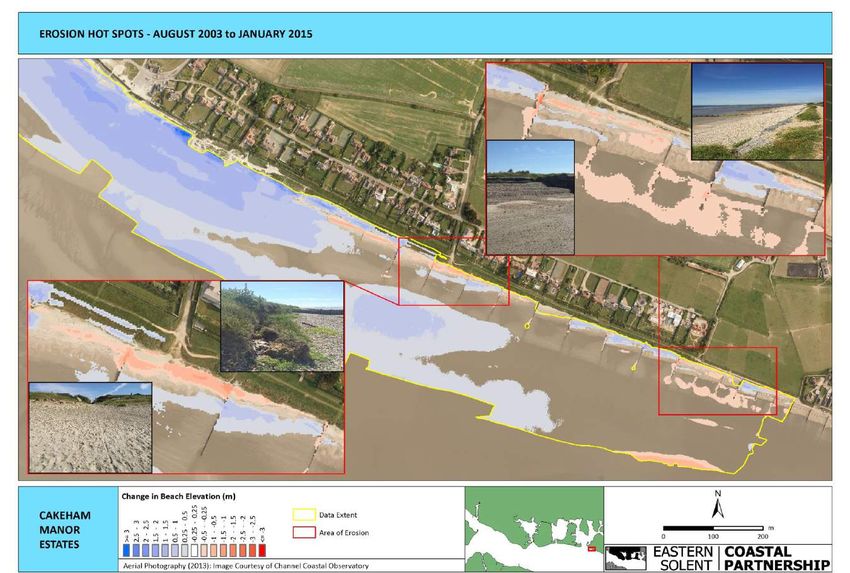
2.3      BEACH MANAGEMENT PRACTICES
       It is important to understand both natural and man-made sediment movement, therefore beach
       recycling and replenishment volumes are presented in Table 2.4 and Figure 2.18.

       Table 2.4: Beach management since 2000 between East Head and Bracklesham

       Location                                      Year                    Activity                     Volume
                                                     2005                                                 13,000
       East Head Spit                                                        Extraction
                                                     2009                                                 10,200
                                                     2005                                                 13,000
       East Head Spit Hinge                                                  Deposition
                                                     2009                                                 10,200
                                                     2000                                                 600
                                                     2001                                                 600
                                                     2002                                                 600
                                                     2003                                                 600
                                                     2004                                                 600
                                                     2005                                                 600
       West Witterings – behind beach
                                                     2006                    Extraction                   600
       huts *
                                                     2007                                                 600
                                                     2008                                                 600
                                                     2009                                                 600
                                                     2010                                                 600
                                                     2011                                                 600
                                                     2012                                                 600
                                                     2000                                                 600
                                                     2001                                                 600
                                                     2002                                                 600
                                                     2003                                                 600
                                                     2004                                                 600
                                                     2005                                                 600
       West Witterings – in front of beach
                                                     2006                    Deposition                   600
       huts
                                                     2007                                                 600
                                                     2008                                                 600
                                                     2009                                                 600
                                                     2010                                                 600
                                                     2011                                                 600
                                                     2012                                                 600
       Shore Road & E. Bracklesham
                                                     Winter 2013/2014        Extraction                   8,000
       Development
       West of Shore Road (8 groyne bays)            Winter 2013/2014        Deposition                   8,000
       East of Joliffe Road (3 groyne bays)          Winter 2014/2015        Deposition                   3,900
       West of Joliffe Road (5 groyne bays)          Winter 2014/2015        (replenishment)              7,800

       NOTE*: the extraction and deposition around the beach huts at the Witterings isn’t actual recycling. The sediment
       which is moved from behind the beach huts to the front is wind-blown sand. The sand is blown behind the beach huts
       over the winter and is then removed and placed back on the beach during March every year.

33 | Coastal Process Analysis 2015
Following the 2013/2014 storms, David Lowsley of Chichester District Council (personal
communication, 2015), reports that;
2013-2014: 8000m3 gravel was extracted from in front of the east Bracklesham development,
and deposited directly to the west of Shore Road. This recycling event filled 8 groyne bays after
the storms.
2014-2015: 11,000m3 of pure gravel was imported and deposited around Joliffe Road; 3 groyne
bays to the east and 5 groyne bays to the west. The bays were filled with a crest width of
approximately 5m, and a height of ~5mOD. As the winter of 2014/2015 had a relatively low
storm frequency and magnitude, the gravel has remained and not moved alongshore.
According to the historical aerial photography, Cakeham Manor Estate has had timber groynes
in place since at least 1946, to slow the rate of gravel transport from east to west. The groynes
at west Cakeham are now covered with sand, illustrating the movement of sand from west to
east.
Recently, Cakeham Manor Estate has been trapping the excess sand at west Cakeham to
assist the natural process of building sand dunes. In turn, the sand dunes act as a natural sea
defence, protecting the properties behind.
34 | Coastal Process Analysis 2015Figure 2.18: Beach Management Activities around the Cakeham area 35 | Coastal Process Analysis 2015
3. DISCUSSION
Beach change prior to 2012
According to the 2003 – 2012 difference plot (Figure 2.16), there was a general trend of
accretion for the Cakeham frontage, with lowering of the central Cakeham section for the mixed
gravel and sand upper beach.
Beach change since 2012
According to the 2012 – 2013 and 2013 – 2015 difference plots (Figures 2.14 and 2.15), as well
as the 2012 – 2013 and 2013 – 2014 profile line maps (Figure 2.11), there does appear to be a
more general trend of erosion, particularly for central and east Cakeham and the sandy
foreshore at west Cakeham. A difference plot of the wider area was produced to investigate this
further, highlighting foreshore lowering at West Wittering between 2013 – 2015 (Figure 3.1).
This erosion correlates with an increase in storm frequency and intensity (Figures 2.4 and 2.5)
and annual maximum wave height since 2012 (Table 2.2).
Still, the 2003 – 2015 long-term difference plot (Figure 2.17) shows the continued accretion of
sand on the upper and lower beach for west Cakeham, as well as an increase in sand on the
lower foreshore for central Cakeham, supporting earlier interpretation by Bray (2007; 2010) of
onshore migration of swash bars of sand from the Chichester Harbour ebb tidal delta.
West Cakeham
The longer term difference plots clearly show the accretion of sand at west Cakeham between
2003 – 2015 (Figure 2.17). The profile line maps support this in general, although seasonal
erosion is noted for 2005-2006, 2010-2011, 2011-2012, 2012-2013 and 2013-2014. According
to Figure 2.5, the winter of 2009/10, 2011/2012 and 2013/2014 had a high cluster of storms.
Central Cakeham
Central Cakeham is the interchange between sand and gravel and over the longer term, the
difference plots show erosion of the upper beach between 2003 - 2012 and 2003 – 2015 (Figure
2.16 and Figure 2.17), with accretion of sand on the foreshore. The profile line maps show
mixed accretion and erosion with a higher degree of seasonal erosion for 2005-2006, 2010-
2011, 2012-2013 and 2013-2014. There is a hotspot of erosion at the end of Berry Barn Lane,
highlighted since the 2013/2014 storms in the 2003 – 2015 difference plot (Figure 2.17).
East Cakeham
East Cakeham is dominated by an upper gravel beach and lower sandy foreshore. Prior to the
2013/2014 storms, the gravel beach and sandy foreshore were showing net accretion (Figure
2.16). The longer term trend since the 2013/2014 storms continues to be beach accretion,
although a hotspot of erosion is noted for the gravel beach and sandy foreshore along the
footpath backed by fields (Figure 2.17). The profile line maps show mixed accretion and
erosion with a higher degree of seasonal erosion for 2008-2009, 2010-2011, 2012-2013 and
2013-2014.
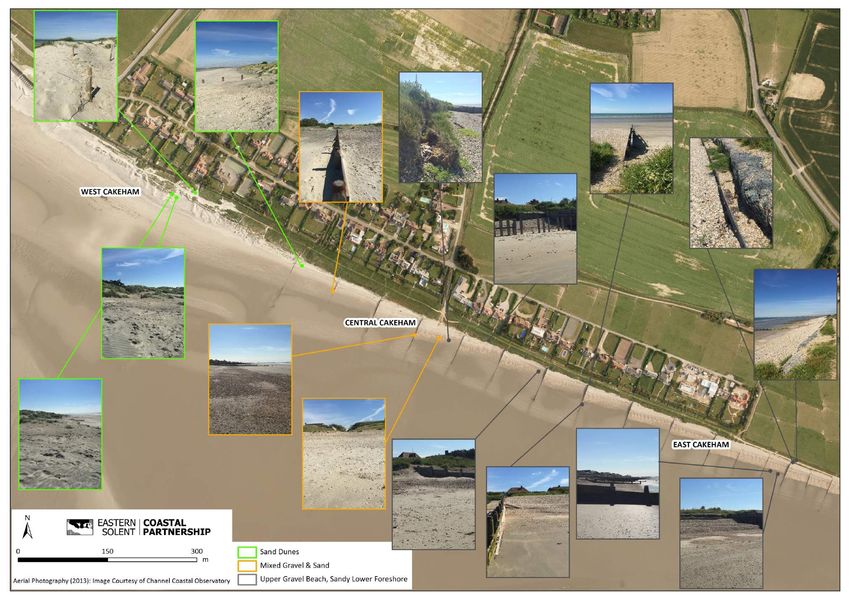
36 | Coastal Process Analysis 2015Following analysis of the difference plots and profile line maps, two hotspots of erosion have been identified for central and east Cakeham (Figure 3.2). According to the Environment Agency flood zones, the hinterland is not at risk of flooding under a, “no defences” scenario (Figure 11.1). 37 | Coastal Process Analysis 2015
Figure 3.1: Difference plot of wider area around Cakeham Manor Estate: 2013 - 2015

38 | Coastal Process Analysis 2015
Figure 3.2: Main erosion hot spots identified from survey data (2003 – 2015)

39 | Coastal Process Analysis 2015
4. MONITORING RECOMMENDATIONS

       It is recommended that an annual report is produced to identify any changes to the sand dune
       section and lower foreshore to the west of Cakeham and the low cliffs and gravel section to the
       east. Currently, lidar data is captured for the frontage on an annual basis as part of the South-
       east Regional Coastal Monitoring Programme. This data can be worked up to produce annual
       difference plots, highlighting any hotspots of erosion or accretion.

       Additional monitoring is recommended for the low cliffed section depicted in Figure 4.1. This
       would involve surveying points at the top of the cliff and at the base of the cliff on an annual
       basis (Figure 4.2). Increased survey frequency may be required if the erosion rate escalates. It
       is also recommended that Cakeham Manor Estate take photos of the hotpots of erosion
       identified in Figure 3.2 on an annual basis, as well as the low cliffs and the West Cakeham
       section.

       Figure 4.1: Low cliffed section at Cakeham (© Uwe Dornbusch, July 2014)

       The survey schedule for the current 5 year phase (2012 – 2016) of the South-east Regional
       Coastal Monitoring Programme is presented in Table 4.1. The next 5 year phase of monitoring
       (2017 – 2021) is yet to be formally approved; therefore there is no certainty over future survey
       coverage and frequency. It is recommended that topographic baseline surveys are undertaken
       for the blue line depicted on Figure 4.1 for any years when lidar or topographic surveys are not
       collected as part of the next 5 year programme.

       Table 4.1: Survey schedule for the South-east Regional Coastal Monitoring Programme at Cakeham
       Manor Estates

       Survey Type                       Frequency                          Next Scheduled

       Lidar                             Annually                           2016
       Topographic Baseline              Annually                           August 2015
       Topographic Profiles              6 monthly                          October 2015
       Hydrographic Baseline             Annually                           June 2015
       Aerial Photography                5 yearly                           2018

40 | Coastal Process Analysis 2015
Figure 4.2: Proposed future beach monitoring for Cakeham Manor Estate 41 | Coastal Process Analysis 2015
5. CONCLUSIONS

    The year 2014 was the stormiest both in frequency and magnitude, since the Hayling Island and
    Bracklesham Bay wave buoys were deployed in 2003 and 2008 respectively (Bradbury and
    Mason, 2014) (Section 2.1). The difference plots indicate that the erosion experienced along
    the Cakeham frontage during this time was probably a direct response to these stormy
    conditions. Still, given the foreshore lowering at West Wittering since the 2013/2014 storms and
    the two hotspots of erosion identified at the end of Berry Barn Lane and the section of coastline
    at east Cakeham, it is recommended that this report be revised on an annual basis. This will
    identify how these areas are recovering since the storms and provide additional evidence to
    support or disprove Fitzgerald’s (2012) theory for West Cakeham.

    It is recommended that an annual report be produced in summer 2016 using the South-east
    Regional Monitoring Programme lidar data, which is captured on an annual basis for the current
    5 year phase of the programme. The future funding and monitoring schedule is still to be
    approved for the next 5 year phase of the programme commencing in 2017. Once the outcome
    is known, Cakeham Manor Estate will be in a better position to decide whether additional beach
    monitoring is required.

    This report does recommend however, that additional monitoring is collected for the low cliffs
    (Section 4), and that photographs of the frontage are taken from the same point on an annual
    basis.

42 | Coastal Process Analysis 2015
6. REFERENCES ABP, 2001a. Geomorphological Analysis of East Head and Chichester Harbour. ABP Research & Consultancy Ltd, Report no. R.893. Bradbury, A.P., and Mason, T.E. (2014) Review of south coast beach response to wave conditions in the winter of 2013-2014. Southeast Regional Coastal Monitoring Programme. Bray, M. (2007) East Head, West Wittering and Cakeham: Interpretation of beach changes 2003-06. Draft Report to: Chichester District Council and East Head Coastal Issues Advisory Group Bray, M. (2010) East Head, West Wittering and Cakeham: Interpretation of beach changes 2004-09. Draft Report to: Chichester District Council and East Head Coastal Issues Advisory Group Evans, J., & Colenutt, A. (2015) Seabed Mapping: Selsey to Eastoke. SCOPAC East Solent Seabed Mapping. New Forest District Council report to SCOPAC Fitzgerald, R. (2012) Dynamics of an Ebb-Tidal Delta & Adjacent Beaches: Chichester Tidal Inlet. Master’s Thesis, University of Sussex Mylroie, P., & Evans, E. (2014) Annual Survey Report 2014: Selsey Bill to Southampton Water. Southeast Strategic Regional Coastal Monitoring Programme Carter, D., Bray, M. & Hooke, J. (2004) SCOPAC Sediment Transport Study. Department of Geography, University of Portsmouth. Report to SCOPAC, hosted on: www.scopac.org.uk/sediment-transport.htm 7. ACKNOWLEDGEMENTS The authors would like to thank Stella Hadley of Cakeham Manor Estate for the informative site visit, highlighting the areas of concern along the frontage. Thank you also to Dr Malcolm Bray (University of Portsmouth) for providing publications relating to the frontage; Dr Uwe Dornbusch (Environment Agency) for his insight into the coastal processes and David Lowsley (Chichester District Council) for information on the recent coastal management at East Wittering and Bracklesham. 43 | Coastal Process Analysis 2015
8. APPENDIX A: Historic Aerial Photography

    The following Figures 8.1 and 8.2 show historical aerial photography for the Cakeham frontage
    with the 2013 Mean Low Water contour overlaid.

44 | Coastal Process Analysis 2015
Figure 8.1: Cakeham frontage photography comparison (1946 - 1994) 45 | Coastal Process Analysis 2015
Figure 8.2: Cakeham frontage photography comparison (2001 - 2013)

46 | Coastal Process Analysis 2015
9. APPENDIX B: Fitzgerald’s (2012) Theory

       The following presents Fitzgerald’s (2012) theory:

       “Abstract: This paper describes an investigation into the volumetric growth of beaches
       adjacent to the Chichester Tidal Inlet. It uses a multi-faceted approach to synthesise the
       inlet system’s historical evolution and behaviour, its contemporary sediment budgets and
       geomorphology, and the influence of controls and the forcing environment. The results
       suggest that sediment is circulated in a counter-clockwise direction on the east of the inlet
       and that the beaches here experience repeated cycles of growth and decay relating to the
       cyclic formation and onshore migration of swash bars on the marginal shoal of the ebb-
       delta. Accretion during the current growth phase, which began in 2005 and is calculated to
       involve 150,000 m3 a-1 of sediment welding to the foreshore, has significantly slowed with
       erosion predicted to recommence. Modelling suggests that conditions are most conducive
       to beach accretion following peaks in low tidal range when they coincide with periods of
       exceptional swell wave activity and sediment availability. Growth phases are likely to last 5-
       10 years and involve upward of 600,000 m 3 of sediment. Conditions are most conducive to
       periods of decay following peaks in high tidal range, with coastal erosion and flooding most
       likely when they coincide with exceptional storm wave activity and sediment deficiency.
       Despite the complexity of the system’s behaviour and the significant uncertainty regarding
       the predictions, based on the 18.6 year tidal nodal cycle the study cautiously forecasts that
       potential for erosion is greatest following the 2017, 2035, 2054, 2072 and 2091 peaks in
       tidal range. During these periods the estuary’s tidal prism is enhanced by as much as 11%
       maximising the ebb-jet’s capacity to oppose wave energy’s attempts to return shoreward
       delta sand and starve the frontages adjacent to the inlet. This study demonstrates how an
       approach that considers coastal setting, geomorphological change, sediment budgets,
       controls and forcing at a variety of temporal scales can be used to enhance coastal
       management plans and in general the interpretation of tidal inlets.”

       10.      APPENDIX C: Topographic Profile Lines

       The following provides additional information on the interpretation of the profile lines at
       Cakeham:

       Points are recorded along the profile lines every 5m, or wherever there is a change in slope
       (e.g. beach berms, beach toe). All lines on the maps are shown to be the same length; however
       this is not the extent of the surveyed line. Some lines are longer than others, and this needs to
       be taken in to account when considering the beach change. Between the Cakeham Manor
       Estate frontage and East Head spit the profile lines surveyed are very long. Therefore any large
       changes in the cross-sectional area over the line will be relatively small when spread along the
       full length of the line. If these cross-sectional areas are converted to percentages then the
       change will be very small along the lines.

47 | Coastal Process Analysis 2015
11. APPENDIX D: Environment Agency Flood Zones
Figure 11.1: Environment Agency flood zones 2 and 3 under a, “no defences” scenario
48 | Coastal Process Analysis 2015© ESCP, 2015
You can also read