BY A.J. GOULDING WITH RESEARCH SUPPORT FROM MUGWE KIRAGU AND DAVID NOUR BERRO
←
→
Page content transcription
If your browser does not render page correctly, please read the page content below
POTENTIAL IMPLICATIONS
OF THE COVID-19 CRISIS ON
LONG-TERM ELECTRICITY
DEMAND IN THE UNITED STATES

  BY A.J. GOULDING
  WITH RESEARCH SUPPORT FROM MUGWE KIRAGU AND DAVID NOUR BERRO
  OCTOBER 2020
ABOUT THE CENTER ON GLOBAL ENERGY POLICY
The Center on Global Energy Policy at Columbia University SIPA advances smart, actionable
and evidence-based energy and climate solutions through research, education and dialogue.
Based at one of the world’s top research universities, what sets CGEP apart is our ability to
communicate academic research, scholarship and insights in formats and on timescales that
are useful to decision makers. We bridge the gap between academic research and policy —
complementing and strengthening the world-class research already underway at Columbia
University, while providing support, expertise, and policy recommendations to foster stronger,
evidence-based policy. Recently, Columbia University President Lee Bollinger announced
the creation of a new Climate School — the first in the nation — to tackle the most urgent
environmental and public health challenges facing humanity.

Visit us at www.energypolicy.columbia.edu

            @ColumbiaUEnergy

ABOUT THE SCHOOL OF INTERNATIONAL AND PUBLIC AFFAIRS
SIPA’s mission is to empower people to serve the global public interest. Our goal is to foster
economic growth, sustainable development, social progress, and democratic governance
by educating public policy professionals, producing policy-related research, and conveying
the results to the world. Based in New York City, with a student body that is 50 percent
international and educational partners in cities around the world, SIPA is the most global of
public policy schools.

For more information, please visit www.sipa.columbia.edu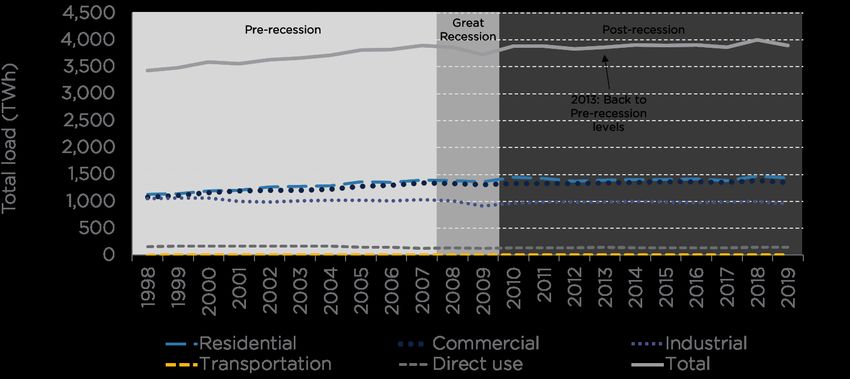
POTENTIAL IMPLICATIONS
OF THE COVID-19 CRISIS ON
LONG-TERM ELECTRICITY
DEMAND IN THE UNITED STATES
BY A.J. GOULDING
WITH RESEARCH SUPPORT FROM MUGWE KIRAGU AND DAVID NOUR BERRO
OCTOBER 2020

Columbia University CGEP
1255 Amsterdam Ave.
New York, NY 10027
energypolicy.columbia.edu

          @ColumbiaUenergy
POTENTIAL IMPLICATIONS OF THE COVID-19 CRISIS ON LONG-TERM ELECTRICITY DEMAND IN THE UNITED STATES
ABOUT THE AUTHORS
A.J. Goulding is a non-resident fellow of Columbia University’s Center for Global Energy
Policy and president of London Economics International LLC (LEI). A.J. has nearly 30 years of
experience in evolving electricity and natural gas markets. He has contributed to the design
of wholesale electricity markets and renewables policies in the US, Canada, and the Middle
East, managed renewable energy portfolios, and helps lead LEI’s electricity market modeling
practice. He recently served on the Ontario Energy Board’s (OEB) Advisory Committee for
Innovation, and is advising the OEB on COVID impact on demand in Ontario.
Mugwe Kiragu is a senior consultant at LEI. Prior to joining LEI, Mugwe worked at the
Ontario Ministry of Infrastructure and Ontario Ministry of Economic Development within the
Infrastructure Finance and Results Office teams, respectively.
David Nour Berro is a consultant at LEI. While pursuing his MA in Economics at McGill
University, David authored a paper on the potential for renewable resources to replace oil-
income generated from oil revenues for Middle Eastern states. Prior to joining LEI, David
supported the Natural Resource Governance Institute as a research associate, enabling the
creation of a public online toolkit to which increased the visibility of financial flows from
national oil companies.
ACKNOWLEDGMENTS
This report represents the research and views of the authors. It does not necessarily represent
the views of the Center on Global Energy Policy. The piece was originally prepared in June 2020.
This work was made possible by support from the Center on Global Energy Policy. More
information is available at https://energypolicy.columbia.edu/about/partners.
ENERGYPOLICY.COLUMBIA.EDU | OCTOBER 2020 | 3POTENTIAL IMPLICATIONS OF THE COVID-19 CRISIS ON LONG-TERM ELECTRICITY DEMAND IN THE UNITED STATES
TABLE OF CONTENTS
Executive Summary 05
1. Changes to Electricity Demand Following the Global Financial Crisis 06
2. Generalized Near-Term Impact of COVID-19 12
3. Changes in Demand Patterns Accelerated by the COVID-19 Crisis 14
4. Illustrating the Potential Impact of These Changes 20
4.1 Moderate-Impact Case 20
4.2 High-Impact Case 21
4.3 Changes to Load Profile 22
4.4 Demographics Will Cause Regional Variation in Impact Levels 24
5. Caveats 25
6. Implications for Policy Makers 27
7. Appendix – Data, Calculations, and Modeled Result 31
7.1 Calculations Appendix 31
References 40
Notes 43
4 | CENTER ON GLOBAL ENERGY POLICY | COLUMBIA SIPAPOTENTIAL IMPLICATIONS OF THE COVID-19 CRISIS ON LONG-TERM ELECTRICITY DEMAND IN THE UNITED STATES
EXECUTIVE SUMMARY
The ongoing COVID-19 pandemic has caused unprecedented changes in the ways people
interact and approach economic activities. Electricity demand has declined and usage
patterns have been altered, changes that could remain even after the pandemic ends. Failure
to properly account for these declines in demand could lead to excess capacity in the electric
power sector, added costs for consumers, and losses for investors.
This paper, from the power sector program at Columbia University’s Center on Global Energy
Policy, presents a methodology to quantify potential permanent reductions in demand
triggered by the pandemic. The authors first identify how electricity demand changed in the
United States following the 2008–2009 global financial crisis, or “Great Recession,” the last
event to cause a major reduction in consumption. They then analyze the unique ways in which
demand patterns may change over the next three to five years as a result of the coronavirus,
followed by some illustrative calculations of the potential impact. Finally, the authors discuss
the implications for policy makers with regard to electricity sector evolution.
The paper finds that the COVID-19 crisis is likely to result in a long-term decline in annual
electricity consumption, though less than that observed after the global financial crisis. It
is also likely to accelerate changes in the structure of electricity demand that were already
underway. In addition, the research shows:
● Patterns of load growth changed significantly after the Great Recession, with average
annual consumption (load) growth in the preceding decade (1998–2007 inclusive) of
1.7 percent versus 0.5 percent in the decade after (2010–2019 inclusive);
● Behind-the-meter generation (which is generally a small-scale and often renewable
resource installed on a customer’s premises) and energy efficiency were the key
drivers of the reduction in load growth after the Great Recession, reflecting trends
gathering force before the downturn;
● Experience from the global financial crisis suggests that load is unlikely to immediately
revert to previous levels following the impact of COVID-19, and that load growth may
be further dampened;
● Primary drivers of changes in electricity demand following the coronavirus Great
Lockdown are likely to be due to changes in residential demand and shifts in commercial
usage, resulting in a potential net incremental reduction in load of 65.2 Terawatt hours
(TWh) to 158.8 TWh, or approximately 1.6 to 4.0 percent of US 2018 load; and
● As a result of this potential reduction in demand, all else remaining equal, future need
for baseload generating capacity may fall by more than 28 GW.
This paper is intended primarily to explore the magnitude of potential long-term permanent
demand destruction due to COVID-19. Because it explores policy implications at a high level,
detailed analysis of particular policy recommendations is beyond the scope of the research.
ENERGYPOLICY.COLUMBIA.EDU | OCTOBER 2020 | 5POTENTIAL IMPLICATIONS OF THE COVID-19 CRISIS ON LONG-TERM ELECTRICITY DEMAND IN THE UNITED STATES 1. CHANGES TO ELECTRICITY DEMAND FOLLOWING THE GLOBAL FINANCIAL CRISIS To assess the potential impact of the COVID-19 economic crisis on future US electricity load1 growth, it is useful to examine how US electricity demand changed following the Great Recession. Using the Great Recession as a reference point is not intended to suggest that the economic impact of COVID-19 is exactly analogous. Rather, the intent is to explore changes in load growth after the largest preceding economic shock and assess their magnitude as a means of placing modeled scenarios of potential COVID-related demand destruction in context. COVID’s impact on the economy was more sudden and remains far more widespread; unemployment rates are significantly higher.2 Furthermore, the economic impact of COVID is a result of government-mandated shutdowns affecting all sectors of the economy, rather than a deterioration in the financial sector that impacted various industries differently and more gradually over a more prolonged period. A review of the literature suggests that while studies have assessed the impact of the recession that followed the financial crisis on natural gas demand in Europe,3 on carbon emissions in Europe,4 and on consumption in the provinces of northern China,5 there are few long-term studies on this topic. In the years during the Great Recession, i.e., 2008 and 2009, electricity load growth declined by 0.6 percent and 3.7 percent relative to prior years.6 However, an expansion followed the recession, and by 2013, load in the US had returned to pre-recession levels, i.e., equal to or greater than total consumption in 2007, a recovery period of four years.7 This is shown in Figure 1, which illustrates total load by customer class. Notably, industrial consumption has not returned to pre-recession levels. 6 |CENTER ON GLOBAL ENERGY POLICY | COLUMBIA SIPA
POTENTIAL IMPLICATIONS OF THE COVID-19 CRISIS ON LONG-TERM ELECTRICITY DEMAND IN THE UNITED STATES

Figure 1: US electricity consumption by customer class, 1998–2019

Sources: Energy Information Administration, Annual Electric Power Industry Report (EIA Form 861),
October 2019; Energy Information Administration, Monthly Energy Review, March 2020.

Although the US economy recovered steadily after 2009, the ratio of electricity load growth
to real GDP growth dropped. From 1998 to 2007, inclusive, the ratio of electricity load growth
to real GDP growth was 0.54; from 2010 to 2019, inclusive, the ratio was 0.21.8 Had electricity
load grown at the same ratio to GDP growth that it did before the Great Recession, electricity
load would have been, on average, 64.7 TWh higher.9

                                                                              ENERGYPOLICY.COLUMBIA.EDU | OCTOBER 2020 | 7
POTENTIAL IMPLICATIONS OF THE COVID-19 CRISIS ON LONG-TERM ELECTRICITY DEMAND IN THE UNITED STATES Figure 2: Annual real GDP growth and electricity load growth, 1998–2019 Sources: Bureau of Economic Analysis, National Income and Product Accounts, Accessed April 2019; Energy Information Administration, Annual Electric Power Industry Report (EIA Form 861). October 2019; Energy Information Administration, Monthly Energy Review, March 2020. To identify potential explanations for this “missing load,” we examined drivers of load growth other than aggregate GDP growth. Several factors can influence electricity load growth in addition to economic activity; for example the number of heating and cooling degree days, the transition of the economy from manufacturing to services, and declines in population growth. Table 1 compares the average annual change in each of these parameters before and after the global financial crisis. Subsequently, we discuss the contribution of other significant trends, such as the increasing materiality of behind-the-meter generation and continuing improvements in energy efficiency, on reducing front-of-meter load. 8 |CENTER ON GLOBAL ENERGY POLICY | COLUMBIA SIPA
POTENTIAL IMPLICATIONS OF THE COVID-19 CRISIS ON LONG-TERM ELECTRICITY DEMAND IN THE UNITED STATES

Table 1: Average change in load growth drivers, 1998–2019

                                                                                    Pre-recession       Post-recession
 Variable                              Units                                        (1998–2007)         (2010–2019)
 Heating degree days                   Annual average growth rate                   -0.6%               0.0%
 Cooling degree days                   Annual average growth rate                   2.5%                2.3%
 Share of services as a % of GDP       Period average                               42.9%               46.1%
 Share of industry as a % of GDP       Period average                               20.9%               18.2%
 Population growth rate                Period average                               1.0%                0.7%

Sources: Bureau of Economic Analysis. National Income and Product Accounts, Accessed April 2019;
Energy Information Administration, Annual Electric Power Industry Report (EIA Form 861), October 2019;
Energy Information Administration, Monthly Energy Review, March 2020; US Census Bureau, Current
Population Survey: Annual Social and Economic Supplement.

The increase in cooling degree days relative to heating degree days can be expected to be
mildly supportive of electricity load, since electricity has a greater air conditioning market
share than it does for heating. The evolution of the US economy from manufacturing to
services would be expected to have the opposite effect, although muted by the impact of
growth in electricity-using services such as data centers.10 This is demonstrated through
differences in energy intensity of the industrial sector relative to the rest of the economy over
time, where the ratio of load to industrial output is slightly higher than the same ratio for the
commercial sector.11

Declining population growth is an additional factor weighing on electricity demand. A
small portion of the missing load is explained by slower population growth, which impacts
residential load growth. Both the US population growth and growth in the number of
households have declined in the post-recession period relative to the pre-recession period.12
If population growth had continued at the same rate as in the pre-recession period, assuming
a similar residential per capita consumption as observed in 2018, load would have been on
average 14.2 TWh higher, representing an increase of around 1 percent.13 Regional shifts in
population may also have had an impact, though increases in cooling demand caused by shifts
in population southward may have been offset by reductions in electric heating demand.

While behind-the-meter incentive programs such as net metering predate the Great Recession
in many states, the confluence of declining costs for small-scale and renewable resources
coupled with elements of the post-recession stimulus package added momentum to the
pace of behind-the-meter investment. Growth in behind-the-meter generation is having a
measurable impact in some US regions:14 the Energy Information Administration (EIA) reports
29.5 TWh of behind-the-meter generation as of end of 2018.15 However, behind-the-meter
generation would only explain 30 percent of the lost load after the Great Recession.

An additional source of declining load growth is continuing improvements in energy efficiency.
An increase in energy efficiency standards over time has significantly lowered energy use
for appliances across the economy. Most notably, refrigerator standards have driven down

                                                                                ENERGYPOLICY.COLUMBIA.EDU | OCTOBER 2020 | 9
POTENTIAL IMPLICATIONS OF THE COVID-19 CRISIS ON LONG-TERM ELECTRICITY DEMAND IN THE UNITED STATES energy use per refrigerator among households in the US, with a refrigerator using less than 500 kWh/year in 2015, down from 1,800 kWh/year in 1972.16 Researchers at the American Council for an Energy Efficient Economy (ACEEE) estimated that federally mandated energy efficiency appliance standards have reduced US consumption by 3.6 percent on average per annum between 1987 and 2010.17 A similar analysis undertaken by Meyers et al. for the Lawrence Berkeley Laboratory estimated that in 2013, the national impact of energy standards was the equivalent of 3 percent of total US energy consumption.18 Changes in standards have been augmented by incentives and initiatives from the federal government, such as the US Department of Energy’s Better Buildings program and regulatory mandates on utilities to include energy efficiency in long-term resource planning. Technological and institutional change also played a role, including both the development of smart meters and the evolution of aggregators to help customers benefit from energy savings. Increasing energy efficiency savings from electric utilities and differences in energy intensity in sectors of the economy may explain much of the rest of the lost load. Since the EIA began reporting on energy efficiency savings from the electric power industry in 2008, utilities have reported an annual average increase of just below 12 percent between 2008 and 2018.19 In 2018, the EIA reported 28.4 TWh of incremental energy efficiency savings.20 Figure 3 shows the impact of the various potential contributors to slowing load growth following the Great Recession. To start, the authors calculate what load would have been had GDP electricity intensity remained unchanged. The actual load in 2018 and the hypothetical load in 2018 (had the load grown at the same load-to-GDP ratio as in the pre-recession period) are considered. The 66.5 TWh “missing” load can largely be explained by behind- the-meter generation and increasing energy efficiency, which together are responsible for 87 percent of the total. The residual is attributed to other factors discussed above, including structural changes in the US economy and slowing population growth relative to the pre- recession period, leading to a reduction in residential load.21 10 |CENTER ON GLOBAL ENERGY POLICY | COLUMBIA SIPA
POTENTIAL IMPLICATIONS OF THE COVID-19 CRISIS ON LONG-TERM ELECTRICITY DEMAND IN THE UNITED STATES

Figure 3: Illustrative impact of structural and sector shifts since 2009 on load in 2018

Sources: Energy Information Administration, Annual Electric Power Industry Report (EIA Form 861),
October 2019; Energy Information Administration, Monthly Energy Review, March 2020.

Indeed, most recent demand outlooks from independent system operators (ISOs) across
the US incorporate these trends, as forecasters widely expect these to be key drivers of
load growth in the medium- to long-term. While the Great Recession may not have been the
cause of any of these factors, it likely accelerated trends that were already underway. In turn,
many of these trends have already been internalized in load forecasts performed prior to the
COVID-19 crisis. However, as will be discussed below, COVID-19 may likewise hasten other
trends that contribute to demand destruction.

                                                                            ENERGYPOLICY.COLUMBIA.EDU | OCTOBER 2020 | 11
POTENTIAL IMPLICATIONS OF THE COVID-19 CRISIS ON LONG-TERM ELECTRICITY DEMAND IN THE UNITED STATES
2. GENERALIZED NEAR-TERM IMPACT
OF COVID-19
Before considering the long-term impact of COVID-19 on electricity demand, it is useful to
summarize the observed short-term impacts. Prior to COVID-19, most ISOs were predicting
moderate growth. Table 2 summarizes the most recent demand outlooks released prior to the
onset of the economic crisis triggered by the Great Lockdown. The numbers shown in Table 2
are consistent with those of the US Energy Information Administration’s most recent Annual
Energy Outlook released in January 2020, which for the US as a whole was projecting load
growth of 0.9 percent in 2020, and annual average growth of 0.8 percent projected for the
2020–2050 horizon.22 Permanent structural changes to electricity load could result in these
outlooks being adjusted materially lower.
Table 2: ISO demand outlooks before economic crisis resulting from COVID-19
ISO/Planning Key drivers described
Authority Description Long-term load forecast (non-exhaustive)
California ● Forecast peak demand ● Peak demand CAGR: ● Behind-the-meter
Energy and electricity sales 0.2% generation
Commission ● Mid-case presented, ● Energy demand CAGR: ● Storage technologies
forecast 2020–2030 1.5% ● Increased electrification
ISO-New ● Forecast peak load and ● Peak demand CAGR: ● Growth in energy
England (net reductions for energy 0.1% efficiency and behind-
efficiency and BTM solar) ● Total energy CAGR: 0.4% the-meter generation
● Forecast for 2020–2029
Midcontinent ● Gross MISO system ● Non-coincident peak ● State-specific drivers
ISO energy and non- CAGR: 1.0% including economic
coincident peak forecast ● System energy CAGR: growth and weather
● Forecast for 2020–2029 1.0% factors
New York ISO ● Long-term energy ● Summer peak annual ● Behind-the-meter
usage and summer peak average growth: -0.09% generation
forecast ● Energy use annual ● Energy efficiency
● Forecast for 2020–2050 average growth: 0.05% ● Electrification and
weather trends
PJM ● Independent forecast of ● Summer peak annual ● State-specific factors
load, summer and winter average growth: 0.5% including economic
peak ● RTO net energy forecast growth, increase in BTM
● 15-year forecast for average growth: 0.7% generation and energy
2020–2035 efficiency measures
SPP ● Non-coincident peak ● Non-coincident peak ● State-specific factors
and energy forecast CAGR: 0.06% including energy
● Forecast for 2020–2029 ● System energy CAGR: efficiency and economic
0.92% growth
Sources: California Energy Commission, 2019 Integrated Energy Policy Report, February 2020; ISO-NE;
MISO, 2019 MISO Energy and Peak Demand Forecasting for System Planning, November 2019; NYISO,
2020 Load and Capacity Data, March 2020; PJM, PJM Load Forecast Report, January 2020; SPP.
.
12 |CENTER ON GLOBAL ENERGY POLICY | COLUMBIA SIPAPOTENTIAL IMPLICATIONS OF THE COVID-19 CRISIS ON LONG-TERM ELECTRICITY DEMAND IN THE UNITED STATES
The near-term impact of COVID-19 on weather-adjusted load is increasingly well documented.
As the crisis emerged in March, ISOs began to report declines in load, with Midcontinent ISO
(MISO) showing a 9–13 percent decline in daily weekday demand relative to temperature
comparable days in March 2019.23 Similarly, the New York ISO (NYISO), serving one of the
states hardest hit by the pandemic, has indicated a weather-normalized reduction in March
and early April of 4–8 percent below expected demand.24 Table 3 illustrates estimates of the
demand impacts for each ISO as of May 30, 2020.
Table 3: Demand impact of COVID-19 across US ISOs
Demand impact from
ISO Description Period observed COVID-19
CAISO Weather-normalized March 17 to May 24 Weekday reduction:
evaluation of full stay- 4.2%
at-home orders Weekend reduction:
1.4%
ISO-New England Weather-normalized March 1 to May 23 Reduction of 3–5% in
assessment demand
Midcontinent ISO Declines relative Late March to early Daily weekday demand
to temperature- April decreased 9–13%
comparable days
New York ISO Weather-normalized Week of March 8 to Reduction of 4–9%
reduction Week of May 23 below expected
demand
PJM Weather-normalized March 1 to May 26 Weekday reduction:
assessment based on 10%,
complete data available Weekend reduction:
2–4%
SPP Compared to similar April 26 to May 14 Load reduction of
days in recent years 7–10%
with temperatures
within 3 degrees
Sources: CAISO; ISO-NE; MISO; NYISO; PJM; SPP (as of May 30, 2020).
.
While the near-term impact is dramatic, and may persist to some degree for as long as a year,
data from the global financial crisis as shown in Figure 1 suggests that after a major economic
shock we should not expect load to immediately revert to previous levels, nor should we expect
long-term load growth patterns to re-establish themselves. Although the events differ greatly,
the four-year period that it took load to recover after the Great Recession provides a planning
benchmark for thinking about deferring or reconfiguring future power sector investments.
ENERGYPOLICY.COLUMBIA.EDU | OCTOBER 2020 | 13POTENTIAL IMPLICATIONS OF THE COVID-19 CRISIS ON LONG-TERM ELECTRICITY DEMAND IN THE UNITED STATES 3. CHANGES IN DEMAND PATTERNS ACCELERATED BY THE COVID-19 CRISIS We expect that primary drivers of incremental changes in electricity demand after the Great Lockdown will be due to changes in residential demand and shifts in usage among commercial customers.25 Industrial load may revert to trend, with long-term energy efficiency measures moderating growth. An increase in permanent work-from-home arrangements may flatten load shapes, without increasing residential load greatly. However, the allocation of load among commercial users may change significantly as the retail sector shrinks, balanced by an increase in warehouse and logistics space dedicated to e-retailers. Although over time some retail spaces may be repurposed, subsequent uses are likely to be less electricity intensive. Office space may be less impacted, as moderate increases in permanent work-from-home positions are balanced by a perceived need to increase minimum workspace area to provide ongoing social distancing. These changes will likely take time to be fully realized; for example, some companies may wait until the end of their leases before implementing reductions. To explore the impact of these trends in greater detail, this section presents some background on each; the following section utilizes data presented to design scenarios regarding the impact these trends may have on long-term electricity demand. When considering load growth, it is important to first understand the composition of load. Figure 3 shows the share of electricity demand by customer class, illustrating the importance of residential and commercial load in future load growth scenarios. Figure 4: US electricity demand by customer class (TWh) and share in 2018 Source: Energy Information Administration, Electric Sales, Revenue, and Average Price. (Data from forms EIA-861- schedules 4A, 4B, 4D, EIA-861S and EIA-861U.). After understanding how load is categorized at a high level, it is necessary to delve more deeply into attributing load within each customer class to various customer types. To explore 14 |CENTER ON GLOBAL ENERGY POLICY | COLUMBIA SIPA
POTENTIAL IMPLICATIONS OF THE COVID-19 CRISIS ON LONG-TERM ELECTRICITY DEMAND IN THE UNITED STATES

how changes in commercial space utilization could impact future load, the authors examined
square footage and energy intensity for a range of commercial uses. There are approximately
87 billion square feet of commercial space in the United States, based on the EIA’s latest
survey of commercial buildings. As Figure 5 shows, four categories stand out: (i) offices, (ii)
warehousing and storage, (iii) education, and (iv) retail.26 Industrial properties contribute
another 20.7 billion square feet of space.27 Office and retail are highlighted, as these are the
focus of subsequent analysis.

Figure 5: Breakdown of US commercial space (million sq. ft.)

Source: Source: Energy Information Administration, Commercial Buildings Energy Consumption Survey,
May 2016, https://www.eia.gov/consumption/commercial/data/2012/bc/cfm/b23.php.

A survey released by the EIA in 2016 identified the energy consumption of each commercial
subsector in the US by building activity. Retail activities constitute approximately 17 percent
of electricity consumption in the commercial sector, compared to approximately 3 percent for
distribution and shipping centers, which falls under the “warehouse and storage” category.

                                                                           ENERGYPOLICY.COLUMBIA.EDU | OCTOBER 2020 | 15
POTENTIAL IMPLICATIONS OF THE COVID-19 CRISIS ON LONG-TERM ELECTRICITY DEMAND IN THE UNITED STATES Figure 6: Breakdown of US commercial electricity demand Source: Energy Information Administration, Commercial Buildings Energy Consumption Survey, May 2016, https://www.eia.gov/consumption/commercial/data/2012/c&e/cfm/pba4.php. Based on US Department of Energy data on energy usage for commercial buildings, 16 main building types can be identified, which represent over 70 percent of all commercial space in the US, shown in Table 4. For our scenario design, we focused on the office, retail, and hotel categories, as we believe these will be among the sectors most affected by lasting changes in business and consumer behavior. 16 |CENTER ON GLOBAL ENERGY POLICY | COLUMBIA SIPA
POTENTIAL IMPLICATIONS OF THE COVID-19 CRISIS ON LONG-TERM ELECTRICITY DEMAND IN THE UNITED STATES

Table 4: Identified commercial building types and energy intensities (electricity consumption
from utilities only)

                               Energy intensity                Average floor area             Number of floors
 Building type                 (kWh/sq. ft.)                   (sq. ft.)
 Large office                  16.5                            498,588                        12
 Medium office                 17.3                            53,628                         3
 Small office                  16.5                            5,500                          1
 Warehouse                     4.3                             52,045                         1
 Stand-alone retail            22.2                            24,962                         1
 Strip mall                    23.7                            22,500                         1
 Primary school                15.4                            73,960                         1
 Secondary school              19.8                            210,887                        2
 Supermarket                   46.7                            45,000                         1
 Quick service restaurant      79.3                            2,500                          1
 Full service restaurant       64.8                            5,500                          1
 Hospital                      53.7                            241,351                        5
 Outpatient health care        41.1                            40,946                         3
 Small hotel                   18.6                            43,200                         4
 Large hotel                   42.6                            122,120                        6
 Midrise apartment             8.5                             33,740                         4

Source: Source: US Department of Energy, Commercial Reference Buildings, Reference Buildings by Climate
zone and Representative City, https://www.energy.gov/eere/buildings/commercial-reference-buildings.
Note: These 16 building types represent approximately 70% of the commercial buildings in the US,
according to a report by the National Renewable Energy Laboratory. Data shown is representative of the
climate of City of Atlanta, Georgia.

The COVID-19 crisis can be expected to accelerate trends that were already apparent with
regard to commercial space utilization, particularly in the retail sector. Nielsen reports that
both retail store count and store sizes have declined recently. Through 2017–2018, 2,248 major
stores closed, after significant growth through 2010–2017. Moreover, the square footage per
store has declined 4.7 percent over 2010–2018, or 0.6 percent per year.28 Between Q2 2019 and
Q4 2019, general retail total square footage declined by 2 percent.29 As of Q4 2019, the US had
a total gross leasable area (GLA) between 11 and 14 billion square feet of retail space.30 The US
also has the highest number of GLA per capita in the world, at 20–23 square feet per person—
significantly larger than other developed economies (see Table 5). This suggests that retail
space per capita could fall significantly without harming consumer welfare; these international
comparisons are used as one of the inputs to the scenario designs discussed below.

                                                                               ENERGYPOLICY.COLUMBIA.EDU | OCTOBER 2020 | 17
POTENTIAL IMPLICATIONS OF THE COVID-19 CRISIS ON LONG-TERM ELECTRICITY DEMAND IN THE UNITED STATES Table 5: Comparison of gross leasable area per capita in developed economies Country Gross leasable area per capita (sq. ft.) United States 23.5 Canada 16.4 Australia 11.1 United Kingdom 4.6 France 3.8 Italy 2.8 Germany 2.4 Sources: Cowen & Company, via The Atlantic: What in the World Is Causing the Retail Meltdown of 2017?, April 2017, https://www.theatlantic.com/business/archive/2017/04/retail-meltdown-of-2017/522384/; Morningstar, via the New York Times: Why we should be optimistic about retail, April 2018, https://www. nytimes.com/2018/04/13/business/dealbook/retail-industry.html. Retail and logistics demand are interrelated. Online shopping has been driving an increase in demand for warehouse space. Through 2012–2018, demand exceeded the supply of industrial and logistics area, leading to 34 consecutive quarters of “positive net absorption.”31 Retail activities consume almost five times as much electricity per square foot compared to logistics. For example, a warehouse on average consumes 4.3 kWh/sq. ft. per year, whereas a stand-alone retail store consumes 22.2 kWh/sq. ft.32 As described below, the scenario design assumed that retail store closings are not accompanied by any additional need for logistics space, as these stores were already served by distribution centers which would be repurposed. However, given the relative energy intensity, even if some growth in logistics occurred as a result, it would have minimal impact on load. Furthermore, load forecasts prior to the COVID-19 crisis already assumed continued expansion of the logistics sector. In addition to changes in the retail sector, the scenarios in this report include changes in how offices are used. Though some companies may deploy measures such as alternate day in office schedules, additional square footage per employee may be required to enforce social distancing, even as companies otherwise seek to reduce their office footprints. Offices had been increasing the density of employees in workspaces. It is estimated that in 2017, North American offices averaged approximately 150 square feet per worker, down from 176 square feet/worker in 2012 and 225 square feet/worker in 2010.33 Additionally, Jones Lang LaSalle, a commercial real estate professional services firm, reports that up to 325 square feet per worker was allocated in office plans during the early 2000s, compared to 75–150 square feet allocated in recent office plans.34 The need to increase square footage per worker in dense office spaces may be more pressing; for example, to enforce physical distancing requirements, it is estimated that at least an extra 20 to 40 square feet may need to be added to each open- plan desk.35 As discussed further below, however, any potential increase in square footage per capita is offset by an increasing number of employees working permanently from home. 18 |CENTER ON GLOBAL ENERGY POLICY | COLUMBIA SIPA
POTENTIAL IMPLICATIONS OF THE COVID-19 CRISIS ON LONG-TERM ELECTRICITY DEMAND IN THE UNITED STATES

The scenarios discussed subsequently are differentiated, among other factors, by differences
in the impact on the hospitality sector. The long-term effects of COVID on the hospitality
sector, including hotels and restaurants, may be muted, depending when a vaccine becomes
available. While demand destruction is anticipated over 2020–2021, a recovery to 2019 rates is
anticipated by some observers as soon as 2023. According to recent forecasts from the April
2020 edition of CBRE Group’s US lodging industry baseline forecast, hotels are anticipated
to witness “rapid economic turnaround” starting in 2021. CBRE anticipates that by 2023,
occupancy rates, average daily rates, and revenues per available room will recover to 2019
rates.36 Occupancy rates are shown in Table 6. Additionally, social distancing requirements
may lead to a decline in the energy intensity of these hotels, as demand for amenities at larger
hotels, such as gyms, swimming pools, and ballrooms, may decline. Hospitality architects
are identifying a need for changes to hotel layouts and amenities to minimize contact, such
as: (i) the removal of check-in areas, replaced by technologies that are phone-enabled, (ii)
combining multiple venue types into a single venue that can accommodate multiple functions,
(iii) extended grab-and-go options for diners instead of restaurants, and (iv) removing gyms
and providing in-room, on-demand exercise equipment.37

Table 6: Historical and forecasted hotel occupancy rates

 Year                                                     Occupancy rate
 2018                                                     66.1%
 2019                                                     66.1%
 2020 (forecast)                                          41.0%
 2021 (forecast)                                          55.9%
 2022 (forecast)                                          65.0%
 2023 (forecast)                                          66.6%

Source: “CBRE Hotels Research: Full demand recovery by late 2022,” Hotel Management, May 21, 2020,
https://www.hotelmanagement.net/operate/cbre-hotels-research-full-demand-recovery-by-late-2022.

We expect the impact of COVID-19 on commercial load growth will reinforce the patterns that
were already taking shape, such as declining retail space and increasing warehouse space.
Conversely, the trend of increasing employee density is likely to be slowed as a result of the
need to enforce physical distancing within office spaces, even as more employees opt to or
are transitioned to work from home.

                                                                           ENERGYPOLICY.COLUMBIA.EDU | OCTOBER 2020 | 19
POTENTIAL IMPLICATIONS OF THE COVID-19 CRISIS ON LONG-TERM ELECTRICITY DEMAND IN THE UNITED STATES
4. ILLUSTRATING THE POTENTIAL IMPACT OF
THESE CHANGES
To gain an understanding of the potential magnitude of these changes, the authors created
a Coronavirus Load Reduction Impact Model (CLR-IM). While a number of simplifying
assumptions are used, the intent is to provide an understanding of the magnitude of potential
long-term demand destruction from the COVID-19 crisis. Two cases are distinguished by the
extent of permanent work-from-home transitions and changes in allocated office space per
employee, as well as differences in the retail sector. For the purposes of this analysis, the pace
of behind-the-meter generation additions is assumed to be the same in each case.
4.1 Moderate-Impact Case
The following assumptions were used:
● 10.8 percent of office workers transition to working from home permanently;38
● The observed increase in residential load due to work-from-home orders was 8.9
percent, and the proportion of that increase which persists is consistent with the
proportion of workers who remain working from home;39
● Demand for office space changes consistent with the proportion of workers remaining
at home, as calculated above, adjusted for increases in the amount of space allocated
per employee for social distancing. Office space per employee for those remaining in
traditional office settings increases by 10 percent;40
● Retail space per capita falls by 30.2 percent, to the level of Canada;41
● No growth in warehousing and logistics space linked to COVID-19 takes place, as the
stores that are assumed to close are already served by warehousing and logistics,
which are reoriented to direct shipping;42
● Electricity consumption per square foot by type of commercial space remains unchanged;
● Load from the industrial sector,43 as well as hospitality sector (hotels and restaurants),
reverts to pre-pandemic levels; and
● 2019 load is used as a baseline.
The long-term load impact is then as follows:
● Residential load can be expected to increase by 3.4 percent relative to pre-coronavirus
levels, or 49.0 TWh, driven by permanent changes in workforce habits;
● Load from office buildings is expected to decrease by 1.9 percent, as reductions in
employees working from offices is significant enough not to be offset by increases in
square footage allotted to the remaining employees, leading to a decrease of 3.6 TWh;
20 |CENTER ON GLOBAL ENERGY POLICY | COLUMBIA SIPAPOTENTIAL IMPLICATIONS OF THE COVID-19 CRISIS ON LONG-TERM ELECTRICITY DEMAND IN THE UNITED STATES
● Load from retail stores falls by 110.6 TWh;44 and
● The combined impact of these changes is a reduction of 65.2 TWh, or the equivalent of
11.4 GW of generating capacity at a 65 percent capacity factor.45 This is in addition to
the impact of energy efficiency and other measures already incorporated into existing
ISO forecasts. It is similar in magnitude to the entire “missing load” from the 2009-
2018 period, and may occur more rapidly.
4.2 High-Impact Case
The following assumptions were changed for a high-impact case:46
● 25 percent of office workers transition to working from home permanently, and
employers do not make any adjustments to the amount of square footage allotted per
remaining employee;
● As a result of a larger proportion of workers remaining at home, and the lack of
physical distancing measures, office space needs and load fall consistent with the
percent of office workers working from home;
● Retail space per capita falls by 52.7 percent from current levels, to the level of Australia,
which is 32.3 percent lower than the level assumed in the moderate-impact case;47
● In the hospitality sector, the energy intensity (kWh-year/sq. ft.) in large hotels
decreases by 28.1 percent, as load from larger hotels is reduced by half of the
differential between large and small hotels, since large hotels that contain multiple
facilities that enable large congregations (ballrooms, conference rooms, gyms,
swimming pools) would need to close the facilities or operate them at a reduced
capacity; and
● 2019 load is used as a baseline as well.
The long-term impact on electricity load is then as follows:
● Residential load is higher than the moderate impact case, increasing by 7.9 percent, or
113.5 TWh;
● Load from office buildings is expected to decrease by 25 percent or 47.5 TWh, a
significantly greater decline than the moderate impact case;
● Load from retail stores falls by 193.2 TWh, driven by a 52.8 percent decline in retail space;
● Load from large hotels decreases by 32.6 TWh, as the energy intensity of larger hotels
declines by 28.1 percent; and
● The combined impact of these changes is a reduction in load of 159.8 TWh, or the
equivalent of 28.1 GW of generating capacity at a 65 percent capacity factor. This
exceeds the total amount of new capacity added in the US in 2019, which was
23.6 GW.48
ENERGYPOLICY.COLUMBIA.EDU | OCTOBER 2020 | 21POTENTIAL IMPLICATIONS OF THE COVID-19 CRISIS ON LONG-TERM ELECTRICITY DEMAND IN THE UNITED STATES A comparison of the long-term demand impact by sector for each scenario is shown below in Figure 7. Figure 7: Summary of long-term demand impact drivers and net demand effect Moderate impact case High impact case Source: Authors’ calculations. 4.3 Changes to Load Profile There will also be a change in peak load as a result of changes in the underlying load shapes. While detailed projections of changes in load shapes is beyond the scope of this paper, increasing residential load during the day will change the residential load shape, while declining commercial load (albeit with little change in its shape) will change the relative influence of the two load curves on the composite load curve. As a result of the changing consumption patterns driven by COVID-19, i.e., increased share of work-from-home and 22 |CENTER ON GLOBAL ENERGY POLICY | COLUMBIA SIPA
POTENTIAL IMPLICATIONS OF THE COVID-19 CRISIS ON LONG-TERM ELECTRICITY DEMAND IN THE UNITED STATES
reduced commercial and retail activity, the morning peak may be shifted later. Residential
electricity demand is anticipated to increase during the daytime hours, as more individuals
work from home, increasing midday residential load but spreading the afternoon peak over a
greater number of hours.
ISOs have analyzed changes in load shapes due to stay-at-home orders. In some
jurisdictions, a “snow day” (a day in which travel is restricted due to inclement weather)
pattern has been observed, with system operators reporting a morning peak arriving later
in the day as a result of COVID-19. New York ISO’s modeled impact of COVID-19 to the
load profile of the state suggests later morning peaks, with the largest observed decline
occurring in the morning (see Figure 8).
Figure 8: System-wide load shape impact in New York ISO
March 16-20 (MW) March 30 - April 3 (MW)
18,000
17,000
16,000
15,000
14,000
13,000
12,000
0:00
1:00
2:00
3:00
4:00
5:00
6:00
7:00
8:00
9:00
10:00
11:00
12:00
13:00
14:00
15:00
16:00
17:00
18:00
19:00
20:00
21:00
22:00
23:00
0:00
1:00
2:00
3:00
4:00
5:00
6:00
7:00
8:00
9:00
10:00
11:00
12:00
13:00
14:00
15:00
16:00
17:00
18:00
19:00
20:00
21:00
22:00
23:00
Morning peak arrives later in Actual Simulated Decrease in load as additional
the day (”snow day” pattern) restricutions are enacted
Source: New York ISO, Impacts of COVID-19 on NYISO Demand: Information current as of 4/6/2020, April
13, 2020.
The Electric Reliability Council of Texas (ERCOT), the ISO which covers much of Texas, has
observed similar patterns. Since April 2020, ERCOT has released a COVID-19 impact analysis
report, updating the analysis weekly. The analysis shows that in all weeks of April and May
2020, loads were between 5–10 percent lower in the hours between 6 and 10 a.m. than a
backcast model would predict. The largest deviations occur between 7 and 8 a.m. In April,
daily peaks were lower by 4–5 percent.49 Similarly, in California, the California ISO (CAISO)
that operates most of the state’s grid reported on the impact of COVID-19 to load and markets
for the period between March 17 and July 26. In its analysis, the ISO reported weekday
average load reductions of 2.4 percent, and the largest percent reductions occurring between
7 a.m. and 12 p.m.50
Changes in the timing of peak load and the rate at which load increases or decreases pose
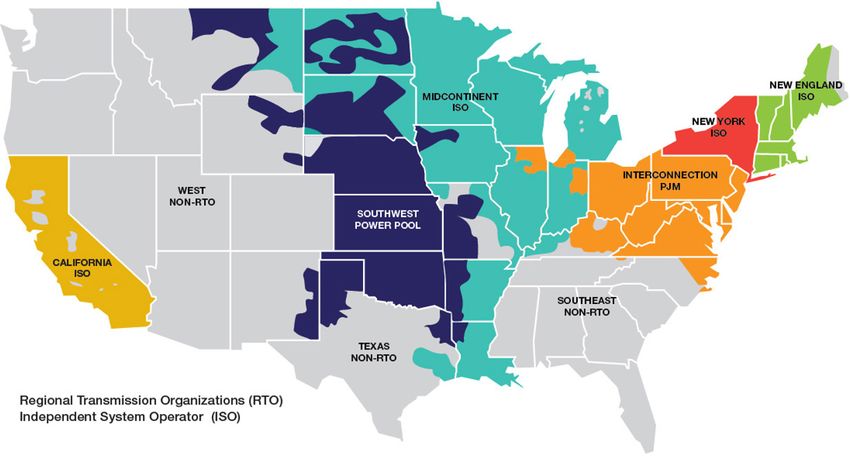
challenges to system operations in determining the appropriate mix of power plants to
ENERGYPOLICY.COLUMBIA.EDU | OCTOBER 2020 | 23POTENTIAL IMPLICATIONS OF THE COVID-19 CRISIS ON LONG-TERM ELECTRICITY DEMAND IN THE UNITED STATES operate; the more that patterns deviate from historical behavior, the harder it is for ISOs to optimize the power system. 4.4 Demographics Will Cause Regional Variation in Impact Levels While the results presented here are on a national level, the impact could vary widely across regions, with the greatest changes in load concentrated in more populous regions. This suggests that California, New England, New York, and parts of PJM could be more affected; areas of the Midcontinent Independent System Operator (MISO) and the Southwest Power Pool (SPP), less so. This is further exemplified via an overlay of US population density on top of a map of ISOs and regional transmission organizations (RTOs) in the US, shown in Figure 9. Figure 9: Population density of US ISOs and RTOs Source for graphic: FERC, Electric Power Markets, https://www.ferc.gov/market-assessments/mkt- electric/overview.asp;Source for population density data calculated using population and area data from US Census Bureau: 2010 Census of Population and Housing, 2010, September 2012, https://www.census. gov/prod/cen2010/cph-2-1.pdf. 24 |CENTER ON GLOBAL ENERGY POLICY | COLUMBIA SIPA
POTENTIAL IMPLICATIONS OF THE COVID-19 CRISIS ON LONG-TERM ELECTRICITY DEMAND IN THE UNITED STATES

5. CAVEATS
The results in this paper are based on only one range of indicative assumptions; robust
scenario analysis would be required on a region-by-region basis to fully validate the
conclusions. Seasonal variations have not been captured given the short period of
observation. Furthermore, the calculations rely on data from a variety of sources; category
definitions may not be consistent across sources. Impacts are expected to vary widely
depending on the characteristics of specific utility service territories.

Some commentators have speculated on the potential for de-urbanization following the
COVID-19 crisis. Were this to occur, the authors believe that the effect would be to redistribute
load regionally, but at the lower level implied by the scenarios explored here, even if
residential living space per capita increases. As a result, the impact would be more a matter
of changing patterns of regional transmission congestion and offsetting regional increases
and decreases in load, but at a lower consolidated total. Because there is not yet sustained
empirical evidence of such a shift, the authors have not included it in the analysis.

The scenarios did not explore changes to the education and restaurant sectors, both of which
could see long-term structural changes. Closings of many small colleges are possible, as is an
increase in online-only degree programs. While the authors assume that the restaurant sector
will return to pre-COVID levels once a vaccine is found, with bankrupt locations replaced by
new outlets, some permanent demand destruction may take place in this sector as well.

The pace of transportation and heating electrification was one of the primary uncertainties
for load forecasting prior to the COVID-19 crisis, and continues to be so thereafter. As the text
box shows, assumptions regarding increasing load from electric vehicles (EVs) and heating
were projected to add significant load. In some ISOs, transportation and heating account for
all of projected load growth and make up for declines due to energy efficiency.

                                                                           ENERGYPOLICY.COLUMBIA.EDU | OCTOBER 2020 | 25
POTENTIAL IMPLICATIONS OF THE COVID-19 CRISIS ON LONG-TERM ELECTRICITY DEMAND IN THE UNITED STATES
Electrification Estimates Vary Greatly
Assumptions regarding rates of electrification, specifically with respect to transportation
and heating, vary greatly among planners and policy makers. For instance, recent
literature demonstrates that current EV penetration outlooks from institutions such as
the EIA, International Energy Agency (IEA), and Bloomberg New Energy Finance vary by
nearly five times for a time frame as soon as 2030. Similarly, US ISOs have incorporated
various scenarios for the rate of transportation and heating electrification. Table 7
summarizes the most recent forecasts among northeastern ISOs.
Table 7: Electrification estimates among US ISOs
ISO or planner Forecast description Forecast total
ISO-New England 2020 Heating Electrification Cumulative 1,715 GWh by 2030 and
Forecast 661 MW added to winter peak
ISO-New England 2020 Transportation Electrification Cumulative 1,728 GWh by 2030 and
Forecast 414 MW added to winter peak
New York ISO Power Trends 2019 Increase energy use by 4.2 TWh
(Electric Vehicles) by 2030, and 650 MW added to
winter peak
PJM PJM Load Forecast Report 2020 1,248 MW increase to load by 2030
(Plug-In Vehicles)
Sources: Foss, M. & Zoellmer, K. Will Electric Vehicles Transform Distribution Networks? Only Time
will Tell. IAEE Energy Forum. Second Quarter 2020; ISO-New England. 2020 Heating Electrification
Forecast. 2020; ISO-New England, 2020 Transportation Electrification Forecast. 2020; NYISO. Power
Trends 2019.” 2019.
Consequently, much depends on the nature of any potential infrastructure focused stimulus
package.51 Such a package could occur by first quarter 2021, with the resulting investments
being made in a two-year period from 2021–2023. A package that includes incentives
for small-scale, renewable, behind-the-meter generation coupled with significant energy
efficiency measures would further dampen load; one that focuses on accelerating electric
vehicle purchases and heating system conversions to electricity could jump start load growth.
26 |CENTER ON GLOBAL ENERGY POLICY | COLUMBIA SIPAPOTENTIAL IMPLICATIONS OF THE COVID-19 CRISIS ON LONG-TERM ELECTRICITY DEMAND IN THE UNITED STATES
6. IMPLICATIONS FOR POLICY MAKERS
The illustrative impacts on load growth and load shape in this paper, if ultimately realized,
have several implications for policy makers. Each could be the subject of a paper in its
own right. For example, the question of whether the stimulus package following the Great
Recession was of sufficient size has direct relevance for design and sizing of stimulus
packages following the Great Lockdown; in turn, the size and design of such packages will
impact the extent of demand destruction or substitution. The intent of this paper is rather to
highlight that permanent demand destruction has implications for a range of policy choices,
many of which were under study prior to COVID-19. These policy areas include the following:
● ISOs will need to revise their demand outlooks and, subsequently, the capacity
mechanism target procurements (for those regions that have them) will need to be
adjusted to reflect long-run demand destruction. In 2019, capacity cost consumers
in New England and PJM alone a total of $12.4 billion.52 Reducing this number could
provide meaningful savings to consumers. Total capacity procured is a function of
peak load forecasts and target reserve margins. In some regions, substantially less
capacity may be required. Even prior to the COVID crisis, reserve margins in many
ISOs were robust, as shown in Figure 10. Essentially all ISOs and RTOs except ERCOT
have had reserve margins well exceeding their reference margin levels. Increases in
distributed energy resources (DERs) may be exacerbating this issue, as ISOs currently
have little insight into the quantity and operating regimes of resources connected
at the distribution level. ISOs have a natural bias toward using higher load-growth
forecasts, as their incentives are asymmetrical: they receive little credit if the lights
stay on, but significant criticism when blackouts occur. State regulators, the US Federal
Energy Regulatory Commission (FERC), and rate case intervenors will need to carefully
scrutinize the peak load forecasts underlying future capacity auctions. Independent
Market Monitors (IMMs) should also increase their scrutiny of load forecasts, bearing in
mind the potential for permanent demand destruction due to COVID-19.53
ENERGYPOLICY.COLUMBIA.EDU | OCTOBER 2020 | 27POTENTIAL IMPLICATIONS OF THE COVID-19 CRISIS ON LONG-TERM ELECTRICITY DEMAND IN THE UNITED STATES
Figure 10: Winter 2019–2020 reserve margins and reference margin levels
71%|72% 83%|83% 59%|59% 54%|54% 88%|89%
50%
45%
40%
35%
30%
25%
20%
15%
10%
5%
0%
O
oba
wer
s
land
k
rio
ec
PJM
C-C
C-E
E
P
SPP
T
AB
BC
MX
US
RG
G
ime
Yor
CO
C-F
C-S
SRS
MIS
ueb
nta
PP-
CC-
CC-
RM
CA
kPo
SER
anit
SER
Eng
-ER
arit
SER
SER
ew
CC-
C-O
C-Q
CC-
CC-
NW
WE
WE
Sas
O-M
C-M
C-N
TRE
ew
WE
NPC
WE
WE
NPC
CC-
O-
C-N
MR
NPC
NPC
WE
MR
NPC
Anticipated reserve margin Prospective reserve margin Reference margin level
Source: North American Electric Reliability Corporation, 2019 State of Reliability, June 2019.
● Static definitions of peak and off-peak hours may need to be revisited. As load
shapes evolve, the traditional association of peak hours with a set period of time
during the day may change. The peak/off-peak designation has always been a crude
approximation for the times of day when usage was highest; ultimately, instead
of linking pricing to particular set hours, it may be more beneficial to associate
commodity and network pricing more dynamically with metrics such as hourly load as
a percent of the daily average usage per hour. Static peak/off-peak definitions can be
found in a variety of contexts, from design of time of use rates to the definition of hours
used in trading blocks. While some observers have highlighted the changing market
dynamics caused by behind-the-meter solar in impacting the timing of wholesale
market peaks, the combined impact of changing demand patterns along with the
increase in solar has yet to be felt. Even where customers are exposed to wholesale
prices for energy, network pricing often relies on more static definitions. Regulators
should inventory all elements of rate design which rely on static definitions of peak and
off-peak hours and develop replacements that are more incentives-compatible. Broader
exploration of performance-based ratemaking would also be beneficial.
28 |CENTER ON GLOBAL ENERGY POLICY | COLUMBIA SIPAPOTENTIAL IMPLICATIONS OF THE COVID-19 CRISIS ON LONG-TERM ELECTRICITY DEMAND IN THE UNITED STATES
● Given the uncertainty of future load growth, policy makers should avoid establishing
procurement targets denominated in megawatts. While COVID-19 is not the only
source of load growth uncertainty, it is exacerbating the problem. Targets for storage,
offshore wind, and other directed procurements should be expressed as a percentage
of load, with procurements sized accordingly. Regulators in states that continue to
have vertically integrated utilities also need to carefully scrutinize utility procurement
plans to assure that green initiatives are not used as a means to overcapitalize, and
that underutilized existing fossil plants are retired. Failure to refine procurements to
reflect future demand uncertainty risks potential stranded costs, including for existing
zero-emitting resources, as prematurely procured facilities exacerbate oversupply.
Renewables procurement standards are sized as a percentage of load and allow for
decentralized procurement using renewable energy credits (RECs), which better aligns
the risk of stranded costs between ratepayers and investors. When load declines, all
other things being equal, REC prices decline, sending a signal to developers to delay
projects. By contrast, state-directed, technology-specific targets with set levels of
capacity can be distortionary in the face of declining load. A few recent examples of
state procurements expressed in megawatts are shown in Table 8.
Table 8: Recent directed procurements in the northeastern US
Jurisdiction Year Selected procurement program
New York 2019 Resources eligible: Offshore wind
Target: 1,600 MW
Connecticut 2019 Resources eligible: Offshore wind
Procurement target: 400–2,000 MW
Massachusetts 2019 Resources eligible: Offshore wind
Procurement target: 800 MW
Rhode Island 2018 Resources eligible: Renewables, including solar, wind, biomass,
small hydro, and fuel cells - Procurement target: 400 MW
Sources: NYSERDA; ISO-NE.
● As part of any future stimulus package, cash grant programs, such as the 1603
program54 deployed after the global financial crisis, if used, should be carefully
targeted. Such programs, if not properly designed, may accelerate development of
generation that is not immediately needed, increasing the overall cost to the economy of
the program unless calibrated to focus on areas of least-cost carbon-emission reduction.
This issue also extends to the impact of production tax credits (PTCs) and investment
tax credits (ITCs), even in the absence of cash grant programs. Policy makers will face
the temptation to extend both PTC and ITC programs beyond their current expiration
dates. Because these programs are divorced from any analysis of need or linkage to
the value of an expected carbon reduction benefit they are less effective climate policy
tools. Changes in demand due to COVID-19 may make them even less so.55
ENERGYPOLICY.COLUMBIA.EDU | OCTOBER 2020 | 29You can also read