BUILDING A BETTER BART - Investing in the Future of the Bay Area's Rapid Transit System
←
→
Page content transcription
If your browser does not render page correctly, please read the page content below
BUILDING A BETTER BART
Investing in the Future of the
Bay Area’s Rapid Transit System

                          July 2014 DRAFT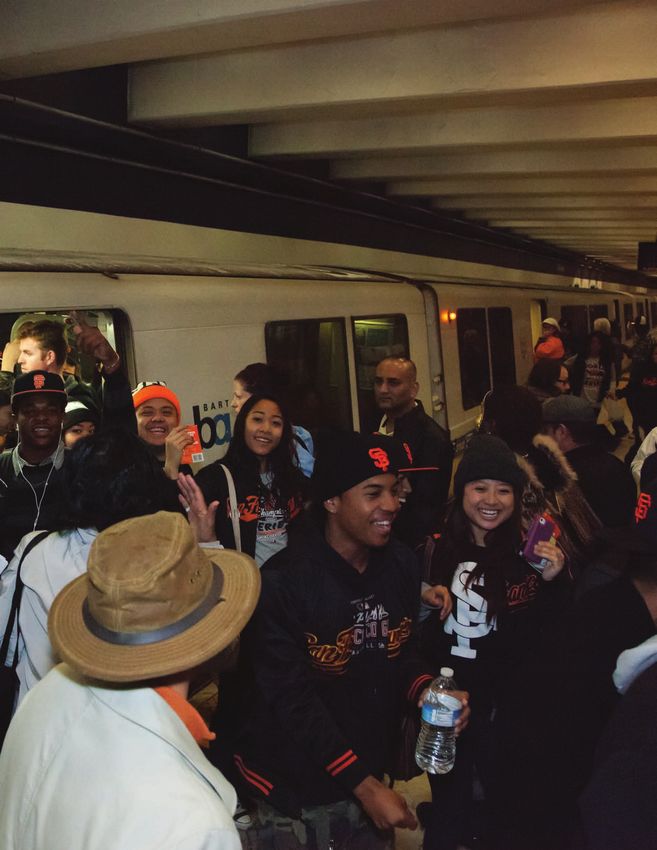
Building a Better BART

TABLE OF CONTENTS

Introduction

BART’s Role in the Region

Investing in BART’s Future

Overview of the BART System

BART’s Recent Accomplishments

Building a Better BART: Major Investment Initiatives

Conclusion: Allocating Limited Resources

                                                             iii
392,300
                                                                                                                                                  daily riders

                                                                                                    331,600
                                                                                                   daily riders
                                 1976
                              Embarcadero
                              station opens

                                                                   daily riders
                    1973                             211,600
                   20 new
                   stations                         daily riders

                                      146,800
         1962                        daily riders
    Voters approve                                                                                            2003
     $792 million                                                                 1996                  Four SFO Extension
     bond to fund                                                             Colma and                    stations begin                       2011
    construction of                                                          Pittsburg/Bay               service: South San                 West Dublin/
       71-mile                                                               Point stations            Francisco, San Bruno,                 Pleasanton
     BART System                                                                  open                  SFIA, and Millbrae                  station opens

                                         1978          1985                                           2001                                              2013
     1957
California State                                                             1995                                              2007                2012
  Legislature                                                           North Concord/
  creates the                                                                                                            Annual ridership     Record ridership
                                                                        Martinez station                                  hits a record         of 568,061
 BART District                                                               opens                                        101.7 million        exits in a day

                                                                                     1997
              1972
                                                                               Castro Valley and
       BART begins serving                                                     Dublin/Pleasanton
       12 stations between                                                       stations open
         MacArthur and
             Fremont

                     1974
                  Transbay
                Service begins

                                                       The Story of BART
INTRODUCTION                                                           BART’s capacity as demographic changes have made
                                                                       transit increasingly popular. The region is planning for
In 1962, the residents of the Bay Area made a visionary                much of its future growth to be located around BART
investment in the region’s future by voting to fund                    stations, which will add even more passengers. Finally,
the initial construction of the Bay Area Rapid Transit                 system extensions are under construction to southern
system (BART). Thanks to their foresight, today’s Bay                  Fremont, Silicon Valley/San Jose, Oakland International
Area residents enjoy one of the strongest economies                    Airport, and eastern Contra Costa County that may
and highest qualities of life in the world, supported by               add still more riders to BART’s already heavily-used
the efficient mobility provided by BART.                               core system. Ironically, BART’s extraordinary success is
                                                                       driving some of its most urgent challenges.
After decades of service to the region, the BART
system now finds itself facing two critical challenges.                This document provides information to help riders
First, hundreds of millions of dollars in reinvestment                 and the public better understand the BART system,
are needed to maintain and upgrade 40-year old                         its history, its current challenges, and what the future
systems and infrastructure. While BART has always                      holds. It includes an overview of BART’s role in the
been an exceptional steward of public resources,                       region; BART’s financial outlook, capital assets, and
much of its core infrastructure is now approaching                     recent accomplishments; and the system’s major needs
the end of its useful life and major capital investment                for reinvestment, modernization, and expansion to
is required for the system is to continue its record of                meet growing ridership demands. The document aims
safe, high-quality, and reliable service.                              to begin a conversation on a question that is central to
                                                                       the region’s future: How can we meet today’s chal-
Secondly, new system capacity is needed to support                     lenges in a way that helps to Build a Better BART for
a growing region. Ridership is already outgrowing                      the future?

BART’S ROLE                                                            economic vitality.1 Just a decade after opening in
                                                                       1936, the Bay Bridge was already reaching its capacity
                                                                       and the need for another transbay link was becoming
IN THE REGION                                                          apparent.
                                                                       Policymakers realized that to manage this dramatic
The Birth of BART: A Defining                                          growth and allow Bay Area cities to thrive, they
Moment in Bay Area History                                             needed a strong and coherent vision for the region.
                                                                       The early planners, saw the creation of BART as a
The idea of a Bay Area rapid transit system surfaced                   mechanism that could lend structure to the region’s
at a turning point in the Bay Area’s history. In the late              growth. BART would encourage cohesive develop-
1940s, the region was experiencing unprecedented                       ment by linking the major commercial centers
growth and increasing congestion on the region’s                       throughout the nine counties that touch the San
highways threatened to undermine the Bay Area’s                        Francisco Bay.
1 Bay Area Rapid Transit. History of BART: The Concept is Born. Web.
http://www.bart.gov/about/history.

                                                                                                                                  1
BART began operating in 1972 with 28 route miles
    of track serving 12 stations. It carried 100,000 people                       Events Dramatically Illustrate
    during its first week of revenue service. Today, BART                         BART’s Role
    comprises 104 route miles of track serving 44 stations
    in 21 cities and 4 counties. A full overview of the                           Recent events have demonstrated the magni-
    system is provided on pages 8-9.                                              tude of BART’s impact on the Bay Area. BART
                                                                                  provided critical support during the Bay Bridge
    As the fifth-busiest heavy rail rapid transit system in
                                                                                  closures over Labor Day weekend in 2013.
    the United States, BART enables over 400,000 daily
                                                                                  During Thursday and Friday of that weekend,
    riders to access many of the region’s prime destina-
                                                                                  BART experienced its third- and fourth-highest
    tions for work, school and recreation. BART meets the
                                                                                  ridership days ever, at 475,000 and 457,000
    diverse needs of people from different parts of the
                                                                                  riders respectively.
    region, enabling them to interact and share space. In
    so doing, BART plays a critical role in reinforcing the                       But, BART is a critical back-up when the bridge
    Bay Area’s identity as one region. From the opening                           is not an option; it supports hundreds of
    of service to the present day, BART has enhanced                              thousands of commuters daily. The 2012 fire
    quality of life in the Bay Area by providing a rapid                          near the West Oakland station, which resulted
    and reliable alternative to the car and fostering a                           in a shut-down of BART’s transbay service for
    lifestyle that enables all people to conveniently live,                       morning commuters, dramatically illustrated
    work, and play in different cities.                                           the challenges of a Bay Area without BART. The
                                                                                  emergency shutdown resulted in hours of delay
                                                                                  across the Bay Bridge. Despite the deployment
    Supporting the Region’s                                                       of alternatives such as telecommuting, carpool-
    Economic Vitality                                                             ing, and increased ferry and bus service, it was
    Since its creation in the 1970s, BART has served as a                         readily apparent that BART is a foundation of
    guiding force in the Bay Area’s growth and develop-                           the Bay Area’s transportation system and plays
    ment. Research indicates that BART helped preserve                            an essential role in supporting the region’s
    the preeminence of downtown San Francisco as a                                economy.
    regional economic center during the 1980s when                                Both these incidents underscore the fact that
    downtowns of major cities in similar metropolises                             the Bay Area’s quality of life and economic
    experienced significant losses in employment.2                                strength has come to be inextricably linked
    Beyond San Francisco, the BART system has sup-                                to the fast, reliable, and resilient regional rail
    ported the rise of major employment centers in cities                         service provided by BART.
    throughout the region—including Oakland, Berkeley,

    2 Cervero, Robert, and John Landis. “Twenty Years of the Bay Area Rapid
    Transit System: Land Use and Development Impacts.” Transportation Re-
    search Part A: Policy and Practice. 31.4 (1997): 309-333. Web. 6 Mar. 2014.
    .

2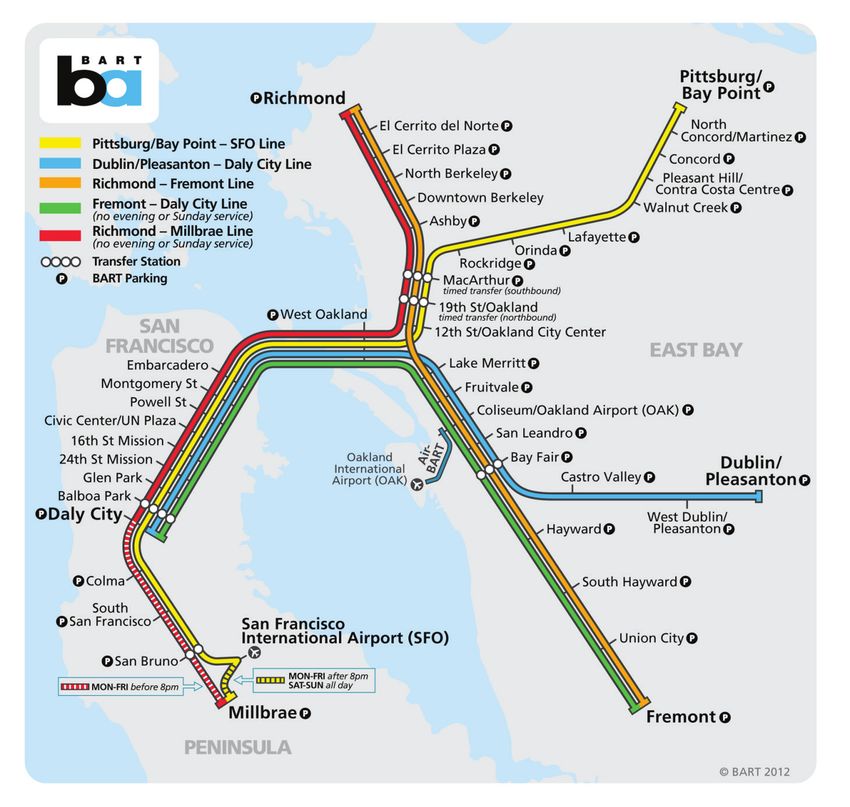
Building a Better BART

Walnut Creek, Fremont, Dublin, Pleasanton, and
Pleasant Hill—by providing a reliable connection to
thousands of commuters who work in these cities
                                                                              Moving People Across the Bay
each day. The system has also encouraged mixed-use
developments and multi-family housing around its
stations, allowing more Bay Area families access to
jobs and schools without the expense of a car.
In 2012, UC Berkeley and the Bay Area Council
conducted a “BART State of Good Repair Study,”
which provides insight into how BART service impacts                                                  21,000 PEOPLE/HOUR
the Bay Area’s economy. The study estimated a
                                                                                                      Moved under the Bay by
net loss in value for the region if BART is unable to
                                                                                                      BART at rush hour
maintain its reliable service between $22 and $33
billion dollars over the next 30 years.3 The study
found the following benefits of BART: travel and
vehicle ownership cost savings for riders; reduced
traffic congestion; business operating cost savings                                                   9,000 VEHICLES/HOUR
corresponding with reduced costs for workers and
increased reliability stemming from reduced conges-                                                   Moved across Bay Bridge
tion; and increased business productivity due to                                                      at rush hour
expansion in access to labor markets.
                                                                              Highway vs. BART
Sustainability
BART plays a central role in meeting the region’s
sustainability goals. In California, about 40% of
greenhouse gas emissions come from transportation,
and of those, about 70% are from personal driving.4
A 2010 study seeking to quantify the greenhouse
gas emissions related to the BART system found that
BART reduced over 1 million metric tons of carbon
dioxide per year, and the system eliminated 12.7                                                      25,000 PEOPLE/HOUR
times the emissions it produced through its own                                                       BART capacity compared to
service.5 These emissions reduction benefits result                                                   one highway lane
from a mode shift from personal vehicles; a reduc-
tion in roadway congestion; and transit’s ability to
promote dense, mixed land-use patterns that reduce                                                    2,400 VEHICLES/HOUR
vehicle trips and trip distances. Data gathered by the                                                Highway capacity per lane
Bay Area Council in 2013 indicated that when BART is
not running, congestion produces 16 million pounds
                                                                              2011 Bay Bridge Toll Evaluation Final Report
of additional carbon each day.6 These contributions                           Sustainable Communities Operations Analysis Study +
make BART indispensable to the important task of                              Highway Capacity Manual 2010
creating a more sustainable Bay Area.

3 “A State of Good Repair for BART: Regional Impacts Study What Could
Happen if BART Fails To Maintain A State of Good Repair” Elizabeth Dea-
kin, University of California, Berkeley, Arlee Reno, Cambridge Systematics,
Inc., James Rubin, University of California, Berkeley, Sean Randolph, Bay
Area Council Economic Institute, Michael Cunningham, Bay Area Council,
May 2012.
4 “California Greenhouse Gas Inventory for 2000-2012.” California Air
Resources Board, http://www.arb.ca.gov/cc/inventory/data/data.htm.
5. Bay Area Rapid Transit. Quantifying BART’s Greenhouse Gas Emissions
with the American Public Transportation Association’s Recommended
Practice. 2010.
6. Bay Area Council. BART Strike Having Costly Environmental Impact on
Bay Area. 2013.
                                                                                                                                     3
Building a Better BART

      BART Moves the Bay Area                                                      BART’s Transit-Oriented
                                                         Percentage of
                                                                                   Development Program
                                                         workers in downtown
                                                                                   Transit-Oriented Development (TOD) is higher-
             Percentage of
                                                         OAKLAND who use           density, walkable, mixed-use development
                                                         BART to commute
      workers in downtown                                                          located at a transit stop or station. It is designed
       SAN FRANCISCO                                                               to allow people to drive less and walk, bike, and
             who use BART
              to commute
                                                                                   take transit more by providing well-connected
                                                                                   and human-scale street networks focused
                                                                                   around frequent transit service. Successful
                                                                                   TOD also improves the efficiency and cost-
                                              24%                                  effectiveness of transit service.
                               26%                                                 BART’s adopted TOD Policy (2005) acknowl-
                                                                                   edges that
                                                                                      “by promoting high quality, more
                                                                                      intensive development on and near
                                                                                      BART-owned properties, the District
                                                                                      can increase ridership, support long-
      MTC Plan Bay Area BART 2010 Customer Satisfaction Study                         term system capacity and generate
                                                                                      new revenues for transit… [create]
                                                                                      attractive investment opportunities
     Accommodating Growth                                                             for the private sector and [facilitate]
     Similar to the era of BART’s founding, the Bay Area is                           local economic development goals.”
     once again at a turning point. The State of California
                                                                                   BART’s TOD program supports the growth
     has acknowledged climate change as a major public
                                                                                   projected in Plan Bay Area by promoting mixed
     policy issue, and has mandated that regions develop
                                                                                   use development at BART stations. BART staff
     sustainable visions for future growth that reduce the
                                                                                   works actively in partnership with cities, com-
     40% of the state’s greenhouse gas emissions that
                                                                                   munity stakeholders, and the private sector
     are associated with transportation.7 In response, the
                                                                                   to advance and facilitate projects. Completed
     region has developed its first integrated transporta-
                                                                                   TOD projects include Castro Valley, Richmond,
     tion and land use plan, Plan Bay Area.
                                                                                   Fruitvale, Powell Street, Pleasant Hill/Contra
     Plan Bay Area combines the Metropolitan Transporta-                           Costa Centre, Ashby, and Hercules. New projects
     tion Commission’s (MTC) 2040 Regional Transporta-                             are being considered or developed at Pleasant
     tion Plan with the Association of Bay Area Govern-                            Hill/Contra Costa Center, Richmond, Walnut
     ments’ (ABAG) Sustainable Communities Strategy.                               Creek, West Dublin/Pleasanton, MacArthur, San
     This plan sets a vision for regional growth in which                          Leandro, South Hayward, Glen Park, Coliseum,
     public transportation forms the backbone of the next                          and Millbrae.
     chapter in the Bay Area’s development.8 By 2040, Plan
     Bay Area anticipates 2 million additional Bay Area
                                                                                   Source: BART Transit-Oriented Development Policy, http://www.
     residents. It seeks to accommodate this growth by                             bart.gov/sites/default/files/docs/BART_TOD_Policy.pdf.
     concentrating future population and employment
     within priority development areas around major
     transit hubs – many of which are centered on BART
     stations. Plan Bay Area also projects 250,000 new jobs
     (a 40% increase) located in areas adjacent to BART
     stations. With the system already supporting nearly
     half of the Bay Area’s transit passenger miles, BART’s
     role to the region is projected to become more
     important than ever before.

     7. California Assembly Bill 32 (AB 32) passed in 2006 required the Califor-
     nia Air Resources Board to devise a plan that would reduce California’s
     greenhouse gas emissions to a certain level by 2020. Senate Bill 375 (SB
     375) passed in 2008 mandated reductions in greenhouse gas emissions and
     vehicle miles traveled through strengthening linkages between transpor-
     tation investment decisions and land use patterns.
     8 BART Transit-Oriented Development Policy, http://www.bart.gov/sites/
     default/files/docs/BART_TOD_Policy.pdf.

 4
Building a Better BART

The Challenge of Supporting the                                             will be unable to serve additional riders; as well as
                                                                            become a less appealing alternative for potential
Bay Area’s Future                                                           new passengers.
Based upon Plan Bay Area growth projections, BART                           Diminished levels of BART service would have severe
estimates daily ridership of nearly 500,000 by 2025                         implications for the Bay Area’s transportation
and 600,000 daily riders by 2040.9 These forecasts                          network. Passengers who shift from BART to private
assume the BART system continues to operate reliably                        automobiles due to poor service would exacerbate
day-to-day and is able to expand its capacity to serve                      congestion on highways that are already at capacity,
this increase in ridership.10 However, to accommodate                       thus degrading service for existing highway users. A
this growth and guarantee the system’s ongoing reli-                        reduction in BART riders and increase in automobile
ability will require significant reinvestment in aging                      users would further increase vehicle miles traveled,
infrastructure and expansion of the system.                                 leading to greater greenhouse gas emissions, air
BART faces nearly $20 billion in operating and capital                      pollution, and respective losses in the Bay Area’s
needs over the next 10 years. Although staff has                            economic and environmental health. Diminished
identified substantial funding to meet this need,                           levels of BART service would also result in a decrease
both the operating and capital programs face sig-                           in the number of people the transportation system
nificant funding challenges in coming years. If BART                        can move during peak periods at a time when travel
is unable to reinvest sufficiently to keep its infra-                       demand in the region is growing.
structure in good working order, system failures will                       The commitment of funding agencies and public
become more frequent, reliability and service quality                       and private partners will be critical to BART’s next 10
for current passengers will decrease, and the system                        years and beyond.

9. Bay Area Rapid Transit. SRTP ridership forecasts: does not include the
two station SVBX project, State-of-Good-Repair
10. Deakin, Elizabeth, et al. “A State-of-good-repair for BART: Regional
Impacts Study.” (2012)

                                                                                                                                      5
Building a Better BART

        INVESTING IN                                              BART’s Capital Improvement Program (CIP), un-
                                                                  like the operating projection, is not financially
                                                                  constrained. The CIP is a projection of all the capital
        BART’S FUTURE                                             needs that BART faces, regardless of funding avail-
                                                                  ability, and it shows a much more significant short-
        This section provides a snapshot of BART’s 10-year
                                                                  fall. Capital expenses include projects such as a new
        financial outlook, including both capital and operat-
                                                                  fleet of rail cars, upgraded maintenance facilities,
        ing needs and identified funding sources.
                                                                  modernization of stations, and system extensions.
        BART’s operating financial outlook shows a shortfall      (major capital projects are described starting on
        of $6 million in FY16 increasing up to $80 million        page 11).
        in FY24. However, because BART’s future operating
                                                                  For the 10-year timeframe of this plan (FY15-FY24),
        projection takes funding availability into consider-
                                                                  fully funding the CIP would require approximately
        ation in the design of the service plan, the cumulative
                                                                  $9.6 billion. BART has previously identified ap-
        $500 million operating shortfall represents only 5%
                                                                  proximately $320 million in capital funding and staff
        of the total projected operating needs forecast over
                                                                  has identified an additional $4.5 billion in future
        the 10-year timeframe of this plan (and no more than
                                                                  funding that has been committed or can reasonably
        a 7% shortfall in any given year).
                                                                  be assumed to become available to BART. This leaves
        The main drivers of operating cost are the salary         a shortfall of approximately $4.8 billion over the
        and benefit expenses of BART’s employees. Current         next 10 years, approximately 50% of the total capital
        increases in the cost of the medical coverage and         need. Other speculative sources have been identified
        pension benefits are having a big impact on BART’s        but are highly uncertain.
        future financial plan. BART’s capital needs also
                                                                  BART has also identified some capital needs and
        impact how much funding is available for operations.
                                                                  funding sources beyond the 10-year horizon of this
        BART has traditionally allocated operating funds
                                                                  plan. However, any detailed cost estimates are likely
        to capital in order to support investment in critical
                                                                  to be inaccurate due to the uncertainty of projecting
        system infrastructure, which is necessary to sustain
                                                                  need and funding availability that far into the future.
        the reliability and safety of the system.

        BART’s Cumulative Funding Shortfall

                $20

                                                                                     Need

                $15
                                                                                            Shortfall

                                                                                                               Available
     Billions

                                                                                                                Funding
                $10

                $5

                 $0
                      FY15   FY16      FY17      FY18     FY19      FY20      FY21       FY22           FY23         FY24

 6
Building a Better BART
Funding Challenges ÆÆMisalignment between need and funding avail-
ability. Particularly important for BART’s capital
Key funding issues BART faces are: program, the timeline on which funding is ex-
pected to become available does not align with
ÆÆCompetition for funding. BART is not the only the projected timeline when the capital investment
agency facing funding challenges, which means needs will arise, creating a more dramatic shortfall
that finding additional external funding sources in the near term than the longer term.
for operating and capital programs remains limited
and highly competitive. BART is committed to the task of seeking additional
funding though obtaining grants, working with
ÆÆOperating an aging system while accommodating
regional partners, and pursuing additional funding
uncertain ridership increases. One of the key chal-
sources to address its identified funding shortfalls.
lenges that BART faces in the near term related
However, additional tools will be necessary to ensure
to the service plan is the inability to increase peak
the system’s ongoing financial health.
service levels until the first of the new rail cars
enter revenue service in FY18. In addition, Transbay
Tube capacity cannot be increased significantly un-
til completion of the Train Control Modernization System Reinvestment
Project (described on page 15). Should ridership versus Expansion
grow substantially more than forecast before the
arrival of enough new train cars, BART will have to
keep older cars operating in revenue service longer
than planned. Crowding could increase delays and
make service less reliable. Investment in tools like
the Strategic Maintenance Plan (SMP), which im-
proves car reliability and availability for a relatively
low cost, will become increasingly important in the
coming years.
ÆÆImpacts of safety rule changes. BART is in the pro- Increasingly, BART faces a fundamental tension
cess of implementing a new and enhanced safety that pits reinvestment in the system against
program that includes more restrictive operating system expansion. It is often easier to generate
rules to improve protection for employees in the support and attract funding for new projects
BART right-of-way. The new program will reduce than for maintenance projects because rid-
train speeds in work areas and thus impact on-time ers and other stakeholders tend to take for
performance and reliability. As much as possible, granted current infrastructure and service
BART will move scheduled maintenance work to levels. However, system expansions actually
non-revenue service hours, but even so, this will increase maintenance and operating needs,
require a significant increase in the number of which exacerbates existing deficiencies. Without
maintenance workers and other operating costs. proper upkeep of the system’s infrastructure,
Starting in FY15, BART added $5 million to its bud- the quality and reliability of the BART system
get to address these rules, including 40 additional suffers and expansion becomes increasingly
positions with ongoing annual costs; however, untenable, creating a vicious circle.
additional new investments, both operating and
capital, are needed to fully address all safety initia-
tives and programs.
ÆÆUnexpected economic fluctuations. Operating
forecasts are based on a number of assumptions.
In particular, the ridership and operating financial
forecast assume steady annual growth, whereas
past experience suggests that over the next 10-
years, the Bay Area is likely to experience both
periods of higher-than-normal growth and reces-
sion or economic downturn. The actual financial
outcomes are typically quite different from the
projection, but these are fluctuations that cannot
be accurately foreseen by BART at present.
7Building a Better BART
OVERVIEW OF More than Trains and Stations:
What Keeps BART Running?
THE BART SYSTEM The People of BART
BART operates trains daily on five lines connecting Staff and Board: A total of 3,420 employees work to
Alameda, Contra Costa, San Francisco, and San Mateo ensure reliable and efficient BART service each day.
counties. The BART system and the mobility it offers BART is governed by a Board made up of nine publicly
to hundreds of thousands of Bay Area residents each elected directors that provide strategic and policy
day is the result of the integration between the guidance to provide safe, reliable, customer-friendly,
system’s physical infrastructure, its maintenance, the and clean regional public transit to Bay Area residents
links to surrounding communities through a variety and visitors.
of access modes, and the coordinated efforts of all
BART personnel. Customers: More than 400,000 riders use BART
every weekday.
The BART System
8Building a Better BART
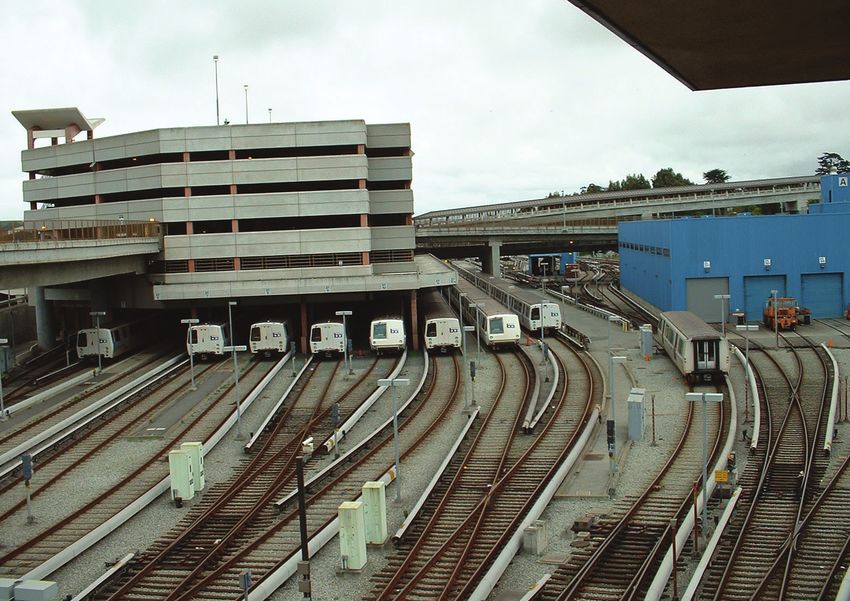
Infrastructure and Service
BART Stations: BART has 44 Maintenance Shops and
stations: 16 at ground level, Yards: BART has five
12 elevated, and 16 subway maintenance facilities,
stations. Every station has tools, and other equipment
buildings, fare gates, fare that support the upkeep
collection equipment, eleva- and repair of the system.
tors and escalators, plazas, Facilities at Hayward,
waiting areas, and many Concord, Richmond, and
other features that serve the Daly City stations are used
public. for vehicle maintenance. Major repairs are handled
at the Hayward facility. Oakland Shops is used for
Station Access: There are a non-revenue vehicles.
wide variety of facilities and
services that allow access to Train Control, Power Sys-
BART stations, including bike tems, and Communications:
facilities, bus and shuttle The Operations Control
loading areas, passenger Center (OCC) in Oakland
drop-off/pickup zones, taxi houses BART’s central train
zones, and parking facilities. control computer system that
BART manages 47,000 park- supervises train movements
ing spaces across 33 stations. Almost all BART stations 24 hours a day. The OCC also
have bike racks, over half of BART stations have bike houses systems that control
lockers, and four, soon to be five, stations have bike ventilation, coordinate emergency response, and
stations. BART also has many features throughout monitor system power. BART’s “third rail” provides
the system to accommodate people with disabilities, 1,000-volt DC electricity to propel trains at up to
such as tactile pathways, Braille signage, and audible 80 mph. The OCC is critical to ensure the system’s
announcements. reliability and safety every day.
Trains and Other Vehicles: Security: The 296 women
BART has a fleet of 669 and men of the BART Police
rail cars, which are joined Department provide 24/7
into three- to ten-car trains police response to emergen-
to provide daily service. cies on the BART system. As
BART staff also use over 30 the only dedicated transit
other types of vehicles to police department in Califor-
maintain and service the nia, the BART Police force is
BART system. unique in its exclusive focus
on the safety and security of BART’s passengers and
employees. They use a community-oriented policing
Tracks and Related and problem-solving philosophy to build relationships
Infrastructure: BART oper- with stakeholders and address the root cause of
ates revenue service across crimes or disorder on the system.
104 route miles: 37 miles
in subways and tunnels, 23 Administration: There are
miles on elevated structures, a variety of administrative
and 44 at ground level. activities and facilities be-
The entire BART system, hind the scenes that support
which includes non-revenue BART, such as information
facilities such as maintenance facilities and tail technology equipment, cus-
tracks, contains over 500 linear miles of track. BART’s tomer service, and planning
3.6-mile Transbay Tube, which connects the East Bay studies. In addition, BART
with San Francisco, serves half of BART’s ridership has a robust emergency
each day. preparedness program, coordinated with adjacent
jurisdictions, and a dedicated Safety Department.
Other Services
ADA Paratransit: Paratransit service is available to people who cannot use the accessible fixed-route services
due to a disabling health condition. BART works together with other Bay Area transit agencies to coordinate
regional paratransit travel in order to provide effective, accessible service to and from its stations.
9Building a Better BART
BART’S RECENT ACCOMPLISHMENTS
In its over 40 years of service, BART has pursued the objective to deliver a high quality of service. It has
achieved major accomplishments in evolving its stations as places and multimodal hubs, promoting seamless
links with other modes of access, maintaining its infrastructure and fleet, and extending its service throughout
the region. In the past five years, BART has made significant strides in a number of areas to improve customer
convenience and to ensure that BART will continue to operate efficiently for its next 40 years and beyond.
New, Brighter, Clearer Sta- Full Clipper Integration: In
tion Signage: Most of BART’s December 2010, BART fully
stations are over 40 years transitioned to Clipper card
old. Through the ongoing fare technology. Clipper
Station Modernization is a safe and convenient
Program, BART has installed transit fare card that works
new signage at Ashby, Daly on many other Bay Area
City, Pleasant Hill/Contra transit systems, including
Coasta Centre, Powell, and AC Transit, SFMTA (Muni),
Union City to make stations easier to navigate and Golden Gate Transit, and Caltrain. It can also be used
more aesthetically appealing. to pay for parking at BART stations.
Improved Bike Preparing for the Next
Accommodation: Over Big One: BART’s Earthquake
the past two years, BART Safety Program has been
has implemented a more steadily investing in crucial
inclusive bike policy to seismic upgrades to core
allow bikes on all trains at infrastructure to preserve
all times, with very limited the strength of system
exceptions. Additionally, structures in the event of an
BART has opened three new earthquake. The program
bike stations to provide safe, secure, convenient bike will be completed in 2023.
storage at Downtown Berkeley, Embarcadero, and
Ashby stations, along with 336 new bike lockers at Train Upgrades: To improve
19 stations. A new bike station near the 19th Street durability and customer
Oakland station is scheduled to open by the end of convenience, new vinyl seats
Fall 2014. that are easier to clean and
longer lasting than the exist-
Poster Art Program: ing fabric seats have been
BART’s Poster Art Program installed on approximately
continued to bring a dose 300 train cars, with an ad-
of whimsy and wonder into ditional 230 cars scheduled
BART stations. In 2010, a to get upgraded seats in FY15 to finish the program.
series called “First Ride” Also, new composite flooring that is more durable
by Josh Ellingson showed and easy to clean than existing carpets has been
fantastic, surreal transit installed in a total of 200 cars, with an additional 115
trips that inspire a sense cars scheduled to get new floors in FY15 to complete
of wonder in kids of all ages. In 2012, Owen Smith the program.
contributed “Literary Journeys,” depicting riders im-
mersed in books by Dashiell Hammett, Jack London, System Expansion: West Dub-
and Amy Tan, with scenes from the books coming to lin/Pleasanton, BART’s 44th
life in the BART car around them. station (an “infill” station),
opened in 2011 between the
Dublin/Pleasanton and Castro
Valley stations. BART has also
made progress on the BART-
to-Oakland International
Airport, eBART to Antioch, and Warm Springs exten-
sions during the past 5 years.
10Building a Better BART
BUILDING A BETTER ÆÆHayward Maintenance Complex (HMC): A new
maintenance facility to maximize car availability
BART: MAJOR
by providing additional capacity to maintain and
store the expanded fleet
INVESTMENT ÆÆTrain Control Modernization Project (TCMP): An
improved train control system to increase train fre-
quency and put the expanded fleet in service both
INITIATIVES safely and reliably
BART’s major investment initiatives are described While BART has worked closely with MTC to develop
on the following pages. These investments will first funding plans for these three important projects,
and foremost reinvest in the system to rebuild and some of the identified funding sources remain highly
upgrade aging infrastructure in support of continued uncertain. A recent regional agreement authorizes
reliability, high service quality, and safety of custom- BART to seek FTA New Starts Core Capacity funding
ers and employees. BART is also planning other major for these projects as part of BART’s Core Capacity
investments that will add core capacity, improve the Program.
sustainability of the system, modernize the existing
Beyond these key capital investment initiatives, BART
system, and expand the system to serve new markets
must fund the ongoing operation of the system. The
to support BART’s evolution into a modern 21st-
future operating plan reflects continued growth
century system.
in BART ridership, though at a slower pace than in
In particular, BART has identified three large, inter- FY12 and FY13 when growth exceeded 6% a year. In
related projects that have been determined to be addition, it includes the four new extension projects
the highest priority needs and essential to meeting that are scheduled to open in the next 10-years:
BART’s safety, reliability, capacity, and sustainability
goals. These are known as the “Big 3,” and form the ÆÆBART-to-Oakland International Airport: Opening
basis of BART’s Core Capacity Program. They are: FY15 (fall 2014)
ÆÆBART to Warm Springs (WSX): Opening FY16
ÆÆFleet of the Future Railcars: A modern, expanded
fleet of railcars to meet growing ridership de- ÆÆEast Contra Costa County (eBART): Opening FY18
mands, improve passenger comfort, and keep ÆÆSilicon Valley Berryessa Extension (SVBX): Opening
service reliable FY18 [not currently included in the SRTP financial
projections because project capital and operating
costs are funded by Santa Clara VTA]
11Building a Better BART
Fleet of the Future
The Fleet of the Future is a $3.3 billion project The combination of a 1,000 car fleet and a new
to expand BART’s current fleet from 669 cars train control system will allow BART to run
to 1,000 cars. This will improve the reliability of up to 30 trains per hour per direction through
BART’s fleet, decrease maintenance costs, re- the Transbay Tube, transporting 30,000 peak
lieve crowding, and help meet growing demand direction passengers each hour (a 43% increase
associated with regional population growth and over today’s 21,000) and improving service
system expansions. frequencies for BART riders.1
Over 17,000 customers provided input on the new cars during the design phase.
1 Sustainable Communities Operations Analysis, BART. 2013
12Building a Better BART
Why Invest in New Cars?
BART is currently running the oldest rail fleet in the which adds to the repair challenges and makes them
United States. BART began service over 40 years ago more costly to repair and maintain.
and the original cars still comprise the majority of
BART’s fleet today. In the 1990s, BART implemented BART needs more capacity to keep up with projected
a midlife overhaul program, a cost-effective way demand: BART is already crowded and daily ridership
to extend the life of the cars, reflecting BART’s is projected to increase by 25% to nearly 500,000 by
commitment to be an exceptionally good steward 2025 and by 50% to 600,000 by 2040. The current
of public funds. Now, with an average fleet age of fleet is not capable of handling this many passengers.
30 years, the rail car fleet needs to be replaced. This The new rail cars, each of which will be able to carry
aging fleet is more susceptible to breakdowns, which more passengers, will enable BART to meet this
disrupt service. The technology in these older cars is growing demand.
outdated and the vehicles are no longer produced,
Average Age of Fleet in Years
Average Age of BART Fleet Compared to Peer Rail Agencies
30
26
21 21 20
17
BART CTA MBTA NYCT WMATA SEPTA
Chicago Boston New York Washington Philadelphia
BART’s New Train Cars Funding and Phasing
The new cars will be: The total cost for 1,000 rail cars is estimated at $3.3
ÆÆQuieter: “Micro-plug” doors will reduce noise billion. BART and MTC have developed a funding
plan that identifies potential future funding for 850
ÆÆCooler: Cooling systems will distribute air directly to
of these cars, with 18% from BART funds and the
the ceilings, making it more comfortable for stand-
remainder from MTC and other federal and local
ees on hot days
funding sources. Not all of these funding sources are
ÆÆEnergy Efficient: The lightweight cars will be more secured and some are highly uncertain. Furthermore,
sustainable with extremely efficient LED lighting, the final 150 cars are unfunded as of now.
daylight sensors, white roofs to deflect heat and
light, and advanced propulsion and braking systems To date, BART has ordered the first 775 cars. The new
train cars will be phased into the existing fleet begin-
ÆÆCleaner and more comfortable: Padded seats will be ning in 2017. Delivery of the 775th car is scheduled
covered with easy-to-clean fabric for fall 2021. A new contract could be required to
ÆÆEasy to use: Digital screens and destination signs order the additional cars.
will reflect color coded BART lines as used in the
BART will continue to aggressively pursue funding for
BART system map, and next stop information will be
the full 1,000 car fleet. Although acquisition of cars
readily available via automated announcements and
beyond 775 may require a new, separate procure-
the digital screens
ment, which could incur significant additional cost
ÆÆEasy to board: The new train cars will have 50% per car, this SRTP/CIP makes the same cost assump-
more doors than the current cars, making it faster tions as the current 775 car purchase for planning
and easier for customers to get on and off purposes because no estimates of the potential cost
increase are available at this time.
13Building a Better BART
Maintenance and Train Control
BART has prioritized three interrelated capital only rail connection between the financial
investment initiatives to ensure the system can and cultural center of San Francisco and
safely, efficiently, and comfortably serve cur- the 2.7-million person East Bay. Due to the
rent and new riders. They are known as the “ Big system’s aging train control system, the
3.” The modern railcar fleet has been described Transbay Tube is only able to safely accom-
previously. Described here are the remaining modate about one train car per 2.5 minutes,
two: an improved train control system to enable equating to 23 trains per hour with capacity
trains to operate more frequently and a new for 21,000 passengers. Peak demand on the
maintenance facility to maintain and store the system is already approaching this capacity.
expanded fleet.
ÆÆ Maintenance Facilities: BART has limited
The “Big 3” together can address some key space to maintain and repair railcars and
current bottlenecks that hinder BART’s ability to other equipment, reducing its ability to
meet current and future ridership growth: quickly put trains back into service, and
limiting the system’s ability to operate at
ÆÆ The Transbay Tube and Train Control System:
maximum capacity during peak periods.
A single two-track tunnel provides the
14Building a Better BART
TRAIN CONTROL BART is also investing in an initiative called “BART
Metro” that is dependent on and complements
MODERNIZATION implementation of the “Big 3” projects. It includes
A modern, improved train control system will allow both near- and mid-term improvements such as
BART to safely operate more frequent service. A train service changes and changes to tracks and stations
control system consists of both hardware and soft- that will increase BART’s flexibility, efficiency and
ware that are used to ensure safe operation of the cost-effectiveness, and allow for increased train
system. It monitors train location, ensures sufficient frequency in high demand areas.
distance between trains, manages train movements,
and helps staff to analyze and report on any issues.
The Train Control Modernization Project (TCMP)
entails removing aging train control equipment from
the BART system and upgrading to a new system.
BART staff is recommending a Communication-Based
Train Control (CBTC) system that will improve the
reliability of the system, decrease the runtime of
trains between stations, and allow trains to run closer
together.
Why Invest in Train Control HAYWARD MAINTENANCE
Modernization? COMPLEX
Modernizing BART’s train control system will allow BART already has one maintenance shop and yard
trains to operate at more closely spaced intervals and facilities in Hayward, which it plans to expand to ac-
at faster speeds, thereby increasing the BART system’s commodate the growing fleet and the system expan-
capacity to carry passengers. A modernized train sions currently underway, including the Santa Clara
control system will enable BART to meet projected Valley Transportation Authority’s (VTA) BART Silicon
transbay demand of over 30,000 passengers per hour Valley project. The HMC project has two components:
in the peak, compared to today’s approximately
21,000 riders. ÆÆReconfiguration of the existing Hayward Yard
ÆÆAcquisition of three adjacent properties on the
Funding and Phasing west side of the existing Hayward Yard for a larger
The TCMP is estimated to cost $700 to $900 million. primary repair shop, a new component repair
More detailed and accurate cost estimates will be shop, a vehicle overhaul shop, a new central parts
available once final design is complete. warehouse, and a new maintenance and engineer-
ing repair shop
As part of the MTC Core Capacity Challenge Grant
program, a multifaceted funding plan has been Why Invest in The Hayward
adopted that meets a significant portion, if not all,
of this need. Funding sources could include FTA New
Maintenance Complex?
Starts Core Capacity grants. As development of the BART needs increased maintenance capacity as part
replacement train control system progresses, signifi- of its Fleet of the Future program. The HMC will
cant effort will be required to ensure that the varied ensure that BART’s maintenance and repair capacity
sources identified within the MTC program yield the is sufficient to support the new railcar fleet for both
targeted funding amounts and, if necessary, identify the current system and system expansions.
any additional resources to fully fund the project.
Thirty-nine million dollars have already been secured
and future anticipated revenues have been identified
Funding and Phasing
to cover much of the remainder. The HMC will cost approximately $432 million, and a
funding plan has been developed by BART and MTC
Once a contract is awarded for the project, it will to cover the full project cost. Creation of the HMC is
take approximately seven to eight years to fully jointly supported by BART and VTA. Environmental
implement and complete. Implementation will start clearance for the HMC project has been approved,
in the core so that increased transbay service capacity cost-sharing agreements with VTA have been ex-
can be achieved early in the project. ecuted, and design work is currently in progress.
15Building a Better BART
BART Metro: Core Capacity
and Efficiency
BART Metro is a package of improvements
designed to allow BART to evolve to better
BART System Demands
Downtown
serve commuters during peak times and relieve
Oakland
overcrowding, while also enabling robust, cost- (19th & 12th) Embarcadero
effective off-peak service in high demand areas.
BART Metro is a concept that was first proposed 10% 22%
in the San Francisco Bay Area Regional Rail Plan
in 2007 (MTC). It has since been refined through
All Other 29% Montgomery
BART’s Sustainable Communities Operational 22%
Stations
Analysis in 2013-14. Together with the “Big
17%
3”, described previously, the improvements
described here comprise BART’s Core Capacity
Improvement program. Powell/
Civic Center
Source: Morning Peak Station Exits
6 A.M. - 10 A.M. May 2014
16Building a Better BART
Why Invest in Core Capacity BART Metro Projects
and Efficiency? BART Metro projects include:
BART Metro goes beyond the “Big 3” to address ÆÆTurnbacks that allow for trains to be distributed
some additional key elements of the BART system more efficiently to high-demand parts of the sys-
which limit the system’s ability to expand ridership tem, especially at peak hours
and undermine system efficiency, including:
ÆÆIncreased train storage capacity at key locations in
ÆÆDowntown San Francisco Stations: Peak-period the system to ensure that BART trains are readily
station use is concentrated at a few stations, in available to provide service where and when there
particular Embarcadero and Montgomery: 22% of is the most demand
BART users use Embarcadero, and 22% use Mont- ÆÆImproved protection of BART tracks to avoid ob-
gomery. These stations cannot accommodate sig- structions from foreign objects, which will decrease
nificantly more riders during peak commute hours the incidence of service disruptions and allow
without incurring unacceptably long wait times for trains to operate at higher speeds
riders exiting trains and leaving the platform.
ÆÆModifications at Embarcadero and Montgomery
ÆÆTwo-Track System: BART is largely a two-track sys- stations, such as additional escalators, elevators,
tem, with one track in each direction. This does not waiting space, and fare payment entry points that
allow for redundancy, so if anything goes wrong, will allow more people to comfortably access these
such as a train breakdown or an obstruction on stations at peak periods
a track, a large portion of the system is forced to
shut down, impacting riders far from the incident. Funding & Phasing
ÆÆLack of Train Turnarounds: Ridership is not evenly The first phase of BART Metro is a $58 million pro-
distributed across the system. There is higher and gram of improvements. Several funding sources have
more consistent, all-day demand on the core of the been identified for the highest priority components
system. However, there are few places where trains of the BART Metro project including funds from
can turn around to allow for higher frequency in MTC, the California Transportation Commission, and
the core. This means that empty BART trains often the Alameda County transportation sales tax. No
have to run long distances before they can turn environmental review or engineering work has been
around and serve higher-demand core areas, which initiated to date. Implementation of BART Metro will
is highly inefficient. be coordinated with implementation of the “Big 3”
as the BART Core Capacity Improvement Program.
New Train “Turnbacks” for
Improved Efficiency and Flexibility
Pittsburg/
Bay Point
Concord
Richmond
Pleasant Hill
Montgomery
24th Street & Mission
Daly City Glen Park
Bayfair Dublin/
Pleasanton
South Hayward
SFO International Airport
Millbrae
Existing Turnbacks Fremont
Planned Turnbacks
17Building a Better BART
Angelo DeSantis
Station Modernization:
Creating Great Places
The Station Modernization Program will invest
resources into existing stations and surrounding
areas to increase capacity in order to serve
more riders throughout the day and enhance
the quality of life around the stations. In combi-
nation with BART’s collaborative station area
planning work and Transit Oriented Develop-
ment program, these station improvements will
help make Plan Bay Area a reality.
Station Modernization will improve the look, feel,
efficiency, and usability of BART stations for rid-
ers, as well as enhance the safety and comfort
of the work environment for BART employees. It
will address all aspects of the stations, including
buildings, escalators and elevators, circulation
and signage, plazas and waiting areas, climate
control and ventilation, lighting and ambient
environment, and other station equipment
upgrades.
18Building a Better BART
Why Modernize the Stations? Cleaner, Brighter, Easier to Use
Stations do more than provide the passenger BART Stations
interface between BART trains and the surrounding
The Station Modernization Program seeks to invest in
communities. If done well, stations create significant
the core BART network, through three coordinated
economic benefits for communities around the
improvement efforts:
stations, becoming a focal point for thriving busi-
nesses and new homes. BART stations can also be ÆÆEarly Wins improvements are low-cost, easy-to-
memorable places, creating a sense of identity and implement changes at BART stations with an
pride for surrounding neighborhoods. As the region emphasis on improving the customer experience
becomes more reliant on transit, it is critical to and employee work environment (deep-cleaning,
transform stations so they more seamlessly connect de-cluttering, and improving or creating new Sta-
to communities, create great places, and make the tion agent break rooms).
transit network function well. Each station needs to ÆÆSystemic Investments address critical deficien-
add positively to the vibrancy of neighborhoods. cies at multiple stations to advance the Building
Stations are a rider’s introduction and entry point to a Better BART strategy, e.g. improving signage,
the BART system. However, like much of the rest of replacing escalators, upgrading emergency/security
the system, many of BART’s stations are 40 years old lighting, replacing fire alarms, reducing intrusion
and are in need of significant improvement. Through by pigeons, or improving BART’s street-level entry-
intensive use over the years, they have become dirty ways/canopies.
and cluttered: items have accumulated in and around ÆÆGateway Stations are intended to be “show-
the stations, such as newspaper boxes, pay phones, case” stations that will receive a comprehensive
and retail kiosks, many of which may not be neces- transformation. This effort will thoroughly assess
sary to BART riders or employees. station needs and prioritize a set of improvements
designed to make substantive upgrades that can
Ensuring that stations provide a high quality arrival
be used to leverage funding. The first round of
and waiting experience, function properly, are easy
Gateway Stations is expected to include four to six
to navigate, and are pleasant and safe places to be is
stations; as funding becomes available, BART envi-
critical to customer and employee satisfaction and to
sions that all stations will eventually be upgraded.
support increasing ridership on the system. There are
The first three stations selected as pilots are El
also opportunities in stations to modernize lighting
Cerrito del Norte, Powell Street, and 19th Street.
and become more energy efficient.
Lessons learned at these pilot stations will inform
Stations are also the workplace for hundreds of BART future station renovations.
employees who are the primary face of BART for
Creating great places at BART stations through
passengers. Currently, many employee facilities are
beautification, improved access, enhanced capacity,
inadequate. Upgrading employee workspaces and
and increased safety should all positively impact
equipment will ensure they can efficiently, safely, and
riders and surrounding communities. Each station
comfortably do their jobs and continue to provide
modernization effort will include a unique set of
high quality customer service to BART’s riders.
improvements that respond to the specific local
context and conditions at that station.
Funding and Phasing
Funding for station improvements is expected to be
approximately $240 million, with $150 million from
California State Proposition 1B, $10 million from
BART capital allocations (from parking revenues),
and $80 million from dedicated local funding. For
planning purposes, it is expected that roughly 10% of
funds will go to Early Wins, 45% to Systemic Invest-
ments, and 45% to Gateway Stations. The Station
Modernization Program is intended to leverage BART
funds to access other public or private funds.
19Building a Better BART
Paul Sullivan
Improving Access & Accessibility
BART riders access stations in many ways, How Riders Access BART
including local transit, shuttles, taxis, bicycles, from Home
and private automobiles. Plan Bay Area projects
tens of thousands of new BART riders in coming Bicycle
years, many walking, biking, or taking transit Transit 4%
from new developments in neighborhoods
immediately surrounding BART stations. To 15%
ensure convenient, seamless access for current
49% Car
and future riders, BART is engaged in several
initiatives to improve the bicycle and pedestrian 31%
infrastructure at stations and coordinate with
Walk
other transportation providers to improve
shuttle and transit connections.
20Building a Better BART
Why Invest in Multimodal Access?
Over time, BART has evolved from a largely park-and-
ride commuter system to a system that is accessed
using many different modes of transportation.
Currently, over 50% of riders access BART from home
by walking, transit or biking. Improving the ease and
convenience of accessing BART by walking, transit,
and biking will positively benefit surrounding com-
munities and maximize riders’ flexibility in choosing
how to access BART.
As ridership grows, investing in high quality multi-
modal access to BART stations is more critical than
ever. Changing demographics and more compact
development patterns are changing the way people
get around throughout the Bay Area. Further, BART’s
capacity to provide automobile parking for passen-
gers is increasingly limited due to land constraints,
Investments in Access
competing transit-oriented development prospects, Station Access
and sustainability goals.
BART staff recently completed a Pilot Access Study at
stations on the inner C-line from Orinda to Concord.
The project evaluated a wide variety of strategies
for using expected parking fee revenue to improve
non-automobile access to the stations. The project
identified a set of cost effective investments for
Contra Costa County stations in the short-, medium-,
and long-term. It also identified a group of policy
questions that must be addressed before BART can
begin to deploy a similar approach system-wide.
BART’s Bicycle Program
BART’s bicycle program is guided by the 2012 BART
Bicycle Plan, which aims to double the percentage of
riders that access BART by bicycle by 2022. The BART
Bicycle Program seeks to:
ÆÆImprove bicyclist circulation in and around stations
ÆÆEnsure sufficient secure parking for bikes
ÆÆEnhance the environment for bicycling beyond the
boundary of BART stations through working with
community and city partners
ÆÆMake room for bicycles on BART trains
ÆÆRaise awareness about the benefits of bicycling as
a means to access stations
21Building a Better BART
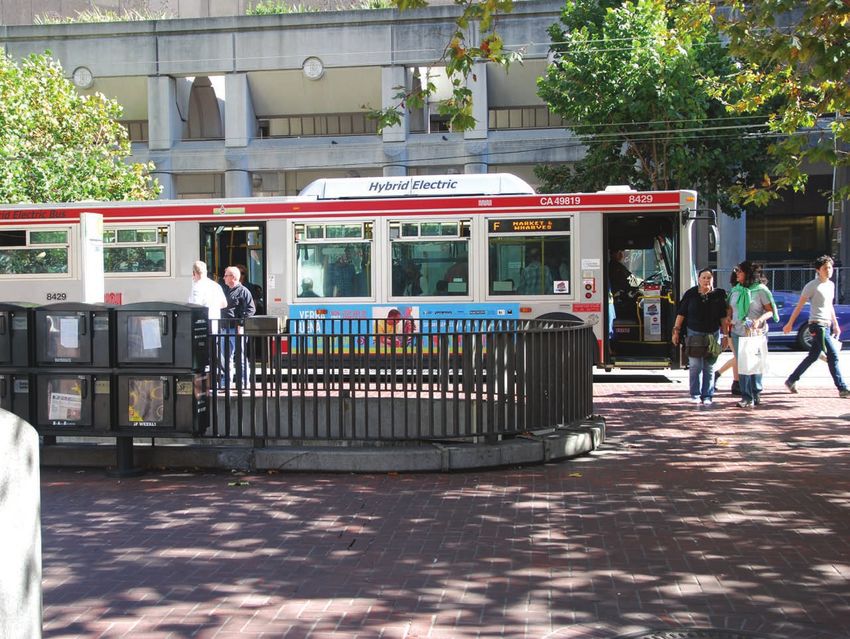
Transit and Shuttles Intermodal Areas
BART coordinates with and contributes millions BART has curbside areas at most of its stations that
of dollars annually to other transit operators who provide access for pedestrians, transit, shuttles, taxis,
provide feeder services to ensure that passengers passenger dropoffs and pickups, and ADA-accessible
can easily access BART via transit. BART provides and loading. BART is investing in projects to upgrade
maintains bus loading areas at stations for its public and renovate these intermodal areas at Downtown
transit partners that are equipped with shelters, some Berkeley, Richmond, and Lafayette stations.
of which have real-time departure information.
The use of shuttles to access BART has risen dramati-
cally in recent years. Currently, over 100 shuttles
make stops at BART stations; however, shuttle move-
ments are not coordinated by BART. This disrupts
traffic circulation in and around stations and results
in passengers getting picked up and dropped off at
locations that are not always safe. BART is working
on several initiatives to improve shuttle access and
coordination, including:
ÆÆEstablishing cooperative relationships with shuttle
operators
ÆÆCreating a dedicated area for shuttle stops
ÆÆReconfiguring bus/shuttle dropoff areas to increase
capacity
ÆÆConsidering a permit system for shuttles to facili-
tate better communication and reduce disruptions
and conflicts
22Building a Better BART
Americans with Disabilities Act: Making
BART Accessible for All
In compliance with the federal Americans with
Disabilities Act (ADA), the BART system has several
features that make it easy for seniors and people
with disabilities to use the system. These include
elevators to all levels of a station, designated priority
seating near train doors, level boarding from the
platform to all trains, Braille labels of important
features in the system, audio capabilities throughout
the system for the hearing impaired, and textured
tiles along the length of train platforms to warn
passengers that they are close to the platform edge.
BART also provides ADA paratransit service to eligible
individuals whose disability prevents them from
accessing, boarding, or riding BART trains. Service
is provided in lift vans by East Bay Paratransit and
through partnerships with other local agencies. In
general, eligible passengers must make advance
reservations to use the service.
Recent and ongoing initiatives to improve BART’s
accessibility include:
ÆÆInstalling detectable pathways throughout the Eric Fischer
BART system for passengers with sight impairments
(usually pathways with raised yellow tiles)
ÆÆCreating safer stairways through the addition of
yellow slip-resistant traction strips on the edge of
each stair
ÆÆImplementing better signage on station platforms
ÆÆPiloting a new video relay system that will pro-
vide on-call American Sign Language interpreters
through video feed and hearing loops to enhance
the audio information for passengers with hearing
impairments
Funding and Phasing
BART estimates that all desired upgrades and
improvements to access infrastructure through 2040
could cost over $800 million. Approximately $40
million in possible funding has been identified, but a
large shortfall still remains.
BART receives about $5 million per year through the
Federal Transit Administration (FTA) Section 5307
funds that are designated for ADA improvements.
BART usually uses this source to fund any improve-
ments that are required by FTA’s Triennial Audit,
other upgrades necessary to maintain compliance
with the ADA, or other high priority ADA projects.
23You can also read