Brixmor Property Group - Investor Presentation - Center of Bonita Springs | Naples, Florida
←
→
Page content transcription
If your browser does not render page correctly, please read the page content below
Brixmor Property Group
Investor Presentation
Quarter Ended March 31, 2022

                               Center of Bonita Springs | Naples, Florida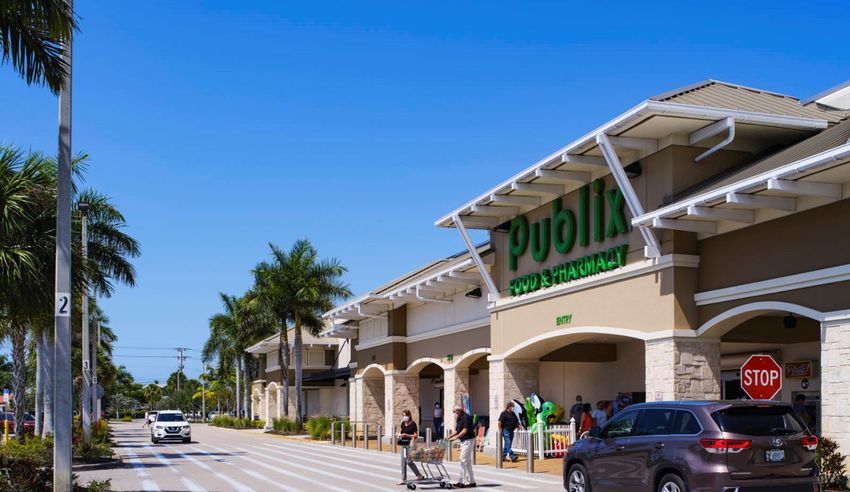
Brixmor Overview                                                                                            Portfolio Quick Facts
High quality, diversified, open-air retail portfolio                                                         Number of shopping centers                                     380
                                                                                                             GLA                                                      67M SF

❯ One of the largest open-air retail landlords in the US                                                     Average shopping center size                             177K SF
                                                                                                             Percent billed                                            88.6%
   o Nationally diversified portfolio of 380 shopping centers spanning 118 discrete MSAs                     Percent leased                                            92.1%
                                                                                                             Percent leased – Anchors / Small shops2            94.4% / 87.0%
   o Over 5,000 national, regional, and local tenants
                                                                                                             Average grocer sales PSF3                                 ~$665

❯ Value-add leader in the open-air retail space                                                              Average grocer rent to sales3                              < 2%

❯ Strive to create and own properties that are the “centers of the communities we serve” and well-           Leading landlord to vibrant retailers
                                                                                                                                              % of      % of    Credit Ratings
  positioned to meet the needs of today’s consumer                                                          Top Retailers by ABR    Stores    ABR       GLA    (S&P / Moody’s)
                                                                                                                                     88       3.5%      3.9%       A / A2
   o Thoughtfully merchandised with non-discretionary essential and value-oriented retail
                                                                                                                                     44       2.5%      4.5%     BBB / Baa1

       • Over 70% of centers are grocery-anchored                                                                                    33       1.8%      2.3%      BB+ / Ba2

                                                                                                                                     123      1.8%      2.1%     BBB / Baa2
   o Convenient locations in close proximity to households, effectively serving as last mile distribution
                                                                                                                                     32       1.6%      2.1%      NR / NR

                                   Flexible Retail Format1                                                                           39       1.4%      1.5%     BBB+ / A2

                                                                                                                                     14       1.2%      0.8%    CCC+ / Caa1
                                                           13% Power center                                                          19       1.2%      1.5%     BBB / Baa1
                                 74%
                          Community /                                                                                                14       1.1%      1.1%      BB / Ba2
                   Neighborhood center                      12% Grocery-anchored
                                                            regional center                                                          27       1.0%      0.9%       B / B2
                                                                                                             Top 10 Total           433      17.1%     20.7%
                                                           1% Other
                                                                                                                                                                        Page 2
Brixmor is the   • Transformed portfolio uniquely
                   positioned for outperformance
Value-Add
                 • Demonstrated value creation through
Leader in the      accretive reinvestment

Open-Air         • Prudent capital recycling track record

Retail Space     • Strong, flexible balance sheet

                                                       Page 3
Transformed Portfolio Uniquely
Positioned For Outperformance
Transformed Portfolio Uniquely Positioned For Outperformance
Portfolio enhancements since year-end 2015

                Value-enhancing reinvestment activity and prudent capital recycling have driven a
                                           23% increase in ABR PSF

                                    At           At
                                12/31/2015   3/31/2022
                                                         Rationalized Portfolio Footprint
   Properties                      518         380
                                                              $2.2B                      30%                     $752M
   GLA (SF)                        87M         67M          of dispositions        of year-end 2015             of acquisitions
                                                                                 portfolio has been sold

   Number of MSAs                  173         118

   ABR PSF                        $12.76      $15.64
                                                         Accelerated Value-Enhancing Reinvestments

   Average grocer sales PSF 1     ~$555       ~$665
                                                             $721M                       34%                   >$600M
                                                         of accretive projects   of current portfolio has   of value created from
   Population density 2          187,000      208,800
                                                              stabilized 3        been subject to or is     stabilized reinvestment
                                                                                     actively under                 projects 4
                                                                                      reinvestment
   Average household income 2    $79,800     $101,900

                                                                                                                                  Page 5
Transformed Portfolio Uniquely Positioned For Outperformance
Outperformance throughout the Pandemic

    Same Property NOI Growth 1                                                     New Lease Spreads 1                                            Additional Occupancy Upside1
               2019        2020          2021                                               2020           2021                                       BRX                         Peer average
                                                                                                                                                   Brixmor occupancy          Peer average occupancy
                                                                                                                                                   impact: (170bps)           impact: (210bps)
                                                                                       27.6%
                                                    14.2%
 Implied 3-Yr                                                                20.2%
                                  Implied 3-Yr                                                                                    94.3%
    6.5%                                                                                                                                  93.8%
                 8.9%                1.8%                                                                                                                                                         93.5% 93.7%
                                                                                                                                                  93.3%
                                                                                                                      11.8%                                                               92.9%
                                                                                                                                                          92.5%                   92.4%
 3.4%                                                                                                                                                             92.2%
                                  2.9%                                                                                                                                    91.9%
                                                                                                            4.4%
                                                                                                                                  92.4% 92.2%
                                                                                                                                              92.1%                                               92.0% 92.1%
                                                                                                                                                                                          91.5%
                                                                                                                                                          91.2%                   91.1%
                                                                                    BRX                     Peer Average                                          90.7% 90.8%
        (5.4%)
                                                                                                                                  4Q19 1Q20 2Q20 3Q20 4Q20 1Q21 2Q21 3Q21 4Q21 1Q22

                                          (13.4%)
 2019   2020     2021             2019     2020      2021
         BRX                         Peer Average

                                                              Our Portfolio Transformation Has Delivered

                      Note: Peer averages include only those companies for which there is consistent historical data available.                                                                         Page 6
Transformed Portfolio Uniquely Positioned For Outperformance
Portfolio transformation driving continued outperformance across every observable metric

    Leasing Highlights 1Q22

              87.0%                                                 $25.78                                                   780K SF                             18.1%
      Small shop occupancy                            Small shop new lease ABR PSF                                   Total new leases executed        New and renewal lease spread
          Record high                                                Record high                                   Highest 1Q total since 2018               Highest since 4Q16
       30bps increase q/q                                                                                                                                    360bps increase q/q
       280bps increase y/y

     Small Shop Occupancy Change                                                       New ABR Created – TTM 1                                     New Lease Spreads – TTM 1
       Since Start of Pandemic 1
                                                                                   New ABR Created ($M)               % of Portfolio ABR
           BRX                    Peer Average
         190bps                     (10bps)
       improvement                   decline                                               5.4%                                                      30.6%
                                                                                                                           3.5%            6.0%

                                 88.4% 88.3%
                                                                             $50

                                                                                            $49
                                                                                                                                           4.0%

              87.0%
                                                                             $40
                                                                                                                                           2.0%

                                                                                                                                                                          12.0%
                                                                                                                                           0.0%
                                                                             $30

      85.1%
                                                                                                                                           -2.0%

                                                                                                                           $25
                                                                             $20

                                                                                                                                           -4.0%

                                                                             $10
                                                                                                                                           -6.0%

                                                                             $0                                                            -8.0%

       1Q20BRX1Q22               1Q20     1Q22
                                  Peer Average                                              BRX                      Peer Average                     BRX              Peer Average

               Note: Peer averages include only those companies for which there is consistent historical data available.                                                              Page 7
Transformed Portfolio Uniquely Positioned For Outperformance
Generating attractive long-term growth with lower relative risk

Mart-to-Market Opportunity                                 Tailwinds From Executed Leasing                           Visibility On Future Growth

❯ Attractive rent basis due to historic portfolio under-   ❯ Leased to billed occupancy spread of 350 basis points   ❯ $50M of new leases in the forward pipeline, up from
  investment and under-management                                                                                     $45M in 4Q21
                                                           ❯ 2.7M SF and $52M of ABR from leases signed but not
   o TTM new lease spreads of 31%                            yet commenced (SNC)1                                       o Continued broad-based demand from thriving
                                                                                                                          tenants
   o Significant revenue growth opportunity from              o Blended rate of $18.92 PSF, 21% above portfolio
     near-term expiring leases                                  average

     Anchor Revenue Growth Opportunity                          Expected Timing of Leases Signed But                   ABR Potential of New Leasing Activity ($M)
                                                                     Not Yet Commenced ($M)1

                                                                            73% of SNC ABR is                                                   $50          $102
                                                                            expected to commence                                       of new leases
                         46%          $13.74                                                                                              in pipeline
                                                                            by year-end 2022
                       Spread                                                                         $52
                                                                                     $46               $6                        $52
            $9.40                                                   $38              $8
                                                                                                      $46                                                    $52
                                                                                     $38
           3.7M SF

    In-Place Anchor ABR PSF          TTM New                   2022 (remaining)     2023              2024+                 SNC as of 1Q22              SNC as of 1Q22 +
   Expiring With No Remaining      Anchor Leases                                                                                                         New Leases In
      Options 2022 - 2024 2                                        Previously Commenced    Commencing in Period                                         Forward Pipeline

                                                                                                                                                                           Page 8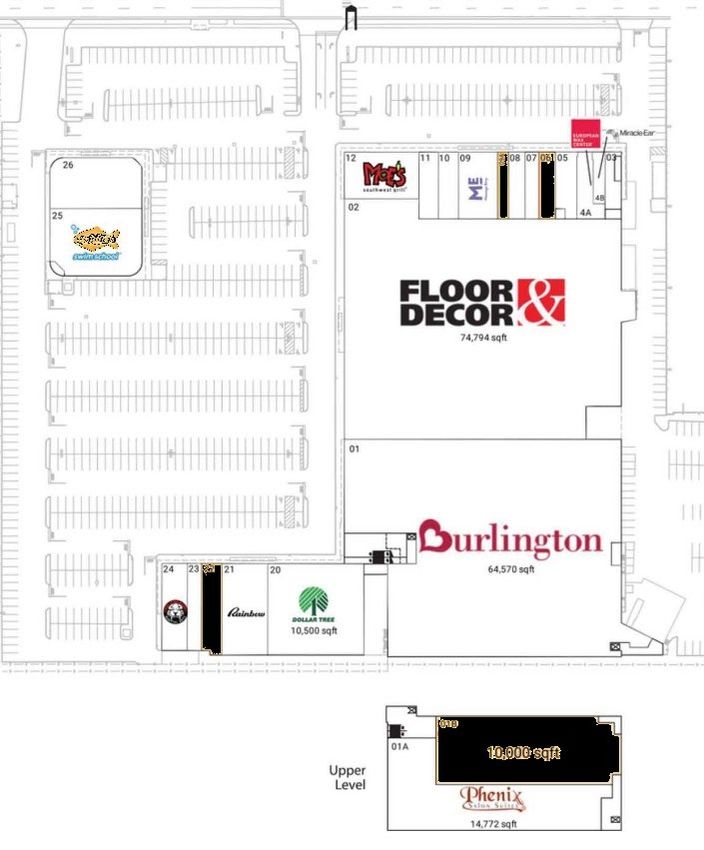
Transformed Portfolio Uniquely Positioned For Outperformance
Significant remaining occupancy opportunity                                                                     BRX occupancy has ample runway for growth
                                                                                                                      BRX billed to leased spread of 350bps
❯ Positioned to continue to grow occupancy by capitalizing on robust, broad based leasing demand
                                                                                                                 Peer average billed to leased spread of 220bps1

   o Competitive anchor leasing environment is improving tenant quality and rate, and fueling small
                                                                                                                                       % Billed      % Leased
     shop interest
                                                                                                                92.2% 92.1%                                          92.0% 92.1%
                                                                                                                              91.2%                          91.5%
                                                                                                                                                     91.1%
   o Significant ability to drive small shop occupancy and rent levels as a result of ongoing portfolio                               90.7% 90.8%
     improvements
                                                                                                                89.1% 88.9%
                                                                                                                                                                     88.7% 88.6%
                                                                                                                              88.0% 87.8% 87.8% 88.1% 88.2%
        • 280bps y/y small shop leased occupancy improvement at 1Q22

             – Reached record high small shop leased occupancy of 87.0%                                         1Q20   2Q20   3Q20    4Q20    1Q21   2Q21    3Q21    4Q21    1Q22

❯ Productivity is accelerating across nearly all categories and tenant formats, including:

       Grocery                Value apparel        Quick-service restaurants            Mall-native retailers
                                                                                                                   1Q22 Notable Leases Executed

General merchandise          Health & beauty           Low-cost fitness

                                                                                                                                                                            Page 9
Transformed Portfolio Uniquely Positioned For Outperformance
Vibrant new retailers added over the last three years

                                                               Page 10
Transformed Portfolio Uniquely Positioned For Outperformance
Thriving retailers continue to highlight the importance of brick and mortar Physical Grocery Positioned For
Shifting Economies
The Store Is The Competitive Advantage “There are few locations more central to our lives
than grocery stores. Whether we grab items daily
“Our performance in the first “The market's under stress, interest rates are going or stock up weekly, we visit them so regularly that
quarter was outstanding on every up, but no matter what happens out there, we have a strong no other retail business has nearly as many consumer touchpoints or
measure, and showcased the power of putting our stores at the balance sheet, we know we have strong economics, generates as much user data.”
center of our strategy… Importantly, market-share gains of and we're in this for the long haul. So…we're not
more than $1 billion in the first quarter, on top of $1 billion in slowing down, and if anything, there's opportunities because “First, our stores “Key to our success is
share gains a year ago, demonstrate Target’s continued others do pull back. Let's take that as an opportunity to go continue to be the our strong competitive
relevance with our guests, even as they have many more faster not slower.” foundation of our go to market strategy,
shopping options compared with a year ago.” business and now allow us to and as a team, we are widening and
serve our customers both in-store deepening our competitive moats
and online. Our excellent locations through productivity, technology
“Our vision is to grow total sales from 2023 to “You can’t create omni-customers without stores. near where people live provide us and sustainability, and the stores as
2025 by 20% per year with over 75% of that growth So stores matter, they really do and they remain with a competitive advantage.” an asset remain essential to our
coming from new stores… New stores will continue a very important underpinning of our strategy. ability to win.”
to be the main driver of our growth. The performance and We’ll continue to open new stores.”
returns on our new stores have remained remarkably
consistent.” Rewards Programs
❯ Incentivize repeat customer visits and provide grocers
with valuable data that allow for personalized
On-going Demand From Off-Price Retailers
marketing and targeted discounts for consumers
“As an off-price leader in every country we operate in, we believe we are in an excellent position to capture additional market
share for many years to come and to become a $60 billion-plus revenue company.”
Private Label Brands
“When you look at publicly available “On the long-term model, given our market share
market share data, you can see that opportunity with the consumers' heightened focus ❯ Appeal to today’s value-oriented consumer, drive margins for retailers,
traditional department stores and other retailers, especially on value and convenience and given the fact that we're facing and build customer loyalty
mall-based retailers, have been losing share over a long period. less brick and mortar competition; we believe we have a market
❯ Store brands gained 6.5% in dollar sales during 1Q22 while national
And from this same data, it is clear that, for many years, the off- share opportunity going forward. So looking into 2023, as you
mentioned, we're targeting double-digit earnings per share brands increased only 5.2%1
price retail channel has been gaining significant market share.”
growth.”
Page 11Value Accretive Capital Allocation
Value Accretive Capital Allocation
Track record of delivering attractive risk-adjusted growth

                                                   >$100M                                                       $1.2B
                                         of annual free cash flow                                       of available liquidity

  Reinvestment                                        Acquisitions                                        Dispositions
                                                     ❯ Acquiring high-quality shopping centers from      ❯ Rationalizing the portfolio and harvesting capital where value has
 $721M      of accretive reinvestment projects
                                                       identified target list                              been maximized
            stabilized since year-end 20151

                                                        o Leveraging the platform to drive growth           o Since year-end 2015:
 >$600M of value created from stabilized                  and create long-term value
            reinvestment projects2
                                                                                                                      $2.2B                    30%                       57
                                                        o Building critical mass and further                       of dispositions        of portfolio sold         single-asset
                                                          densifying the portfolio in attractive sub-                completed               (by count)            markets exited
 $419M      of accretive reinvestment projects            markets
            in process1
                                                                                                                           12%                                     28%
                                                     $752M of acquisitions completed since                       improvement in average                   improvement in average
 ~$1B       of projects identified in the future                 year-end 2015                                   population density across                household income across
            pipeline                                                                                                   the portfolio                           the portfolio

                                                                                                                                                                                Page 13
Value Accretive Capital Allocation
Reinvestment is a value multiplier
Maximum value creation
Strong incremental Follow-on growth in Cap rate
returns rent and occupancy compression
Representative
Representative
Redevelopment vs. Redevelopment Small Shop
BRX Redevelopment
Only
Ground-up
Development
Ground-up
Development
Occupancy Potential
~1/3 the amount 90.3%
92% 94%
Total investment $200M $600M
invested 90%
770bps 92%
Yield ~9% ~7% 88% Spread 90%
87.0%
Residual cap-rate 6.0% 6.0%
88%
BRX Small Shop
86%
Occupancy
86%
Value creation $100M $100M Same value creation 84%
82.6% 84%
82%
82%
Risk of value destruction
80% 80%
Residual cap-rate 6% - 8% 6% - 8% Redevelopments Redevelopments
Value creation $25 - $100M ($75) - $100M In Process Stabilized
• Visit the Re/Development section of our website for examples of our projects: https://www.brixmor.com/re-development
• An in-depth review of a project that highlights the Company’s reinvestment expertise, Village at Newtown (Newtown, PA), can be found at this link: https://www.brixmor.com/blog/village-at-
newtown-redevelopment-video Page 14Value Accretive Capital Allocation
Creating value at lower risk
Creating value
Highly accretive returns
❯ Brixmor’s reinvestment opportunity stands apart in terms of magnitude and velocity
Incremental follow-on growth
Cap rate compression on
Stabilizations Long-term value
In process incremental and existing NOI
2016 – 1Q22 creation potential
• 211 projects stabilized • 54 projects in process • ~$1B future reinvestment
pipeline
At Lower Risk
• $721M of net costs1 • $419M of net estimated Effectively pre-leased
costs1 • $150 - $200M annual delivery
• 11% incremental NOI yield2 goal
Smaller, granular projects
• 9% expected incremental NOI
• >$600M of value created3 yield2
Shorter durations
• >$200M of estimated value
creation3 Small percent of enterprise value
in program, with outsized impact
Note: Value creation estimates include only incremental NOI generated at stabilized market cap rate. Additional value creation from cap rate compression on
in-place NOI and / or future occupancy or rate growth post stabilization is not included. Page 15Value Accretive Capital Allocation
Value delivered: Case study
Stewart Plaza | Garden City, NY
$15M 10% ~$10M
invested1 incremental NOI yield2 value created3
› Rightsize existing Burlington to accommodate the addition of Floor & Decor
o Repurpose underutilized mezzanine space
› Remerchandise small shop space with new relevant retailers
› Upgrade center with façade renovations and parking enhancements
Total ABR PSF Small shop percent leased
Former
increased 21% up 390bps oversized
Burlington
95.4%
$19.80
BEFORE
$16.34
91.5%
1yr Prior to As of 3/31/22 1yr Prior to As of 3/31/22
Reinvestment Reinvestment
Page 16Value Accretive Capital Allocation
Reinvestment expertise: Over 200 projects stabilized
Annex of Arlington I Arlington Heights, IL
Page 17Value Accretive Capital Allocation
Maximizing value through acquisitions in established markets that leverage Brixmor’s proven platform
Centennial Center Champlin Marketplace Ravinia Plaza North Riverside Plaza Elmhurst Crossing Arborland Center Plymouth Square
Denver, CO Minneapolis, MN Chicago, IL Chicago, IL Chicago, IL Ann Arbor, MI Philadelphia, PA
Upland Town Square Pawleys Island Plaza
Riverside, CA Georgetown, SC
Kings Market Atlanta, GA
Brea Gateway
Los Angeles, CA Connexion Atlanta, GA
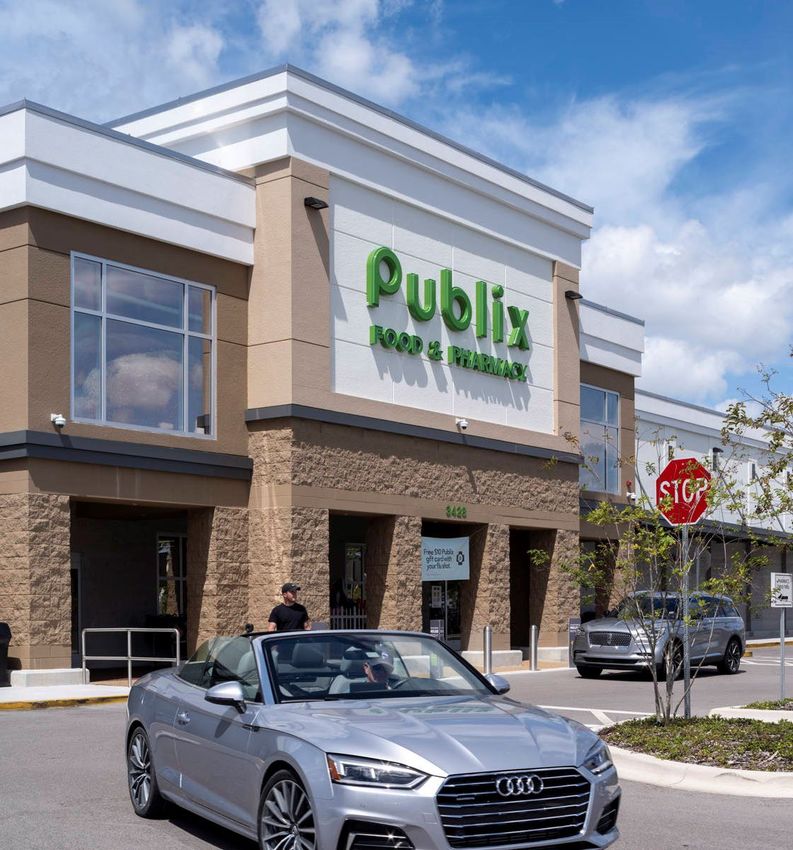
Plaza by the Sea Felicita Town Center Arboretum Village West U Marketplace Center of Bonita Springs Granada Shoppes Venice Village
Los Angeles, CA San Diego, CA Dallas, TX Houston, TX Fort Myers, FL Naples, FL North Port, FL
Page 18Strong, Flexible Balance Sheet
Strong, Flexible Balance Sheet
                                                                                                                                                      Capitalization & Ratios (at 3/31/22)
❯ Balance sheet provides critical financial and operational flexibility
                                                                                                                                                      Debt Statistics
    o Substantial liquidity                                                                                                                            Weighted avg. stated interest rate           3.7%
                                                                                                                                                       Weighted avg. maturity                     5.4 years
    o Fully unencumbered portfolio
                                                                                                                                                       Fixed / Variable                          98% / 2%
❯ Amended and restated unsecured credit facilities improved pricing, added a sustainability linked feature, and extended the maturities of the
                                                                                                                                                       Unencumbered ABR                             100%
  revolver and term loan

    o Added $200M delayed draw term loan; As of June 6, 2022, has not been drawn                                                                      Leverage & Coverage Ratios1
                                                                                                                                                       Net principal debt to adjusted EBITDA        6.4x
    o Pro forma for this transaction, there are no debt maturities until 2024
                                                                                                                                                       Fixed charge coverage                        4.1x
❯ Well-covered dividend
                                                                                                                                                      Credit Ratings
    o Declared a quarterly cash dividend of $0.24 per common share ($0.96 per annum) for the second quarter of 2022                                    Fitch                                   BBB / Stable

    o Represented a yield of 3.7%, as of March 31, 2022                                                                                                Moody’s                                 Baa3 / Stable

                                                                                                                                                       S&P                                     BBB- / Positive

                                                                     Minimal Near-term Debt Maturities ($M, Pro Forma)2
                                       Available Cash    Revolver Availability   Unsecured Notes     Term Loans          Delayed Draw Term Loan     Revolving Credit Facility

                              $1,394
                              $200
                              $1,154
                                                                                                                                             $753          $800
                                                                                     $700          $703           $700
                                                                          $500                                                                                             $500
                                                                                                                                $358

                               $40             $0           $0

                           Liquidity          2022         2023           2024       2025          2026           2027          2028         2029          2030            2031
                                                                                                                                                                                                     Page 20
Strength Of Team And Culture And Commitment To ESG Excellence Benefits All Stakeholders
Strength Of Team And Culture And
Commitment To ESG Excellence
Benefits All Stakeholders
Corporate Responsibility
Recognition
Board of • Oversees our Corporate Responsibility (CR) initiatives through the Nominating and
Corporate Governance Committee (NCGC)
Directors
Green Star Recipient
• Meets quarterly to set, implement, monitor and communicate our CR strategy “A” rating in 2021 Public
ESG Steering
• Includes senior leadership from a variety of functional areas Disclosure Score
Committee
• Participates in periodic company-wide ESG training
Brixmor Gold Level Recognition
• CR objectives are included as part of executives’ goals and impacts the individual
performance portion of each executive’s compensation
• Includes our communities, employees, tenants, suppliers, and investors
Stakeholders • Our CR strategy strives to create partnerships that improve the social, economic
and environmental well-being of all our stakeholders Ranked #8
Among real estate & housing
sector
Page 22Strength Of Team And Culture And Commitment To ESG Excellence Benefits All Stakeholders
Tenant partnerships and supplier relationships
Tenant Partnerships Supplier Relationships
› We support over 5,000 national and regional tenants and local entrepreneurs › We partner with ~3,000 suppliers and vendors to efficiently maintain our
properties to meet our high operational standards
› We strive to be a key partner in the success of our tenants by:
› We ask our suppliers and vendors to annually affirm their compliance with our
o Providing proactive property o Assisting local tenants with Supplier Code of Conduct, which outlines the ESG standards we expect from our
management additional services suppliers and vendors
o Maintaining ongoing tenant o Implementing changes based on o Available on our website here: https://investors.brixmor.com/leadership-
coordination feedback from our biennial tenant governance/governance-documents-policies/default.aspx
engagement surveys
› We maintain open dialogue and transparency with our suppliers through:
› We proudly serve as an integral link between our tenants and communities by:
o Regular review meetings with key national partners
o Ensuring that our properties are safe and accessible, and adhere to our high
operational standards o Requested adherence to the Partnership Engagement Pledge focused on
work-site safety
o Adapting our centers to connect our retailers to their consumers through
o Supplier engagement surveys (commencing in 2022)
• Curbside pick-up • Outdoor dining • Community spaces
Page 23Strength Of Team And Culture And Commitment To ESG Excellence Benefits All Stakeholders
Environmental responsibility
Reducing environmental impact Sustainability Goals
❯ Converting to LED lighting ❯ Installing electric vehicle charging stations
2025
❯ Reducing water consumption through use of smart water ❯ Partnering with tenants through green lease provisions to promote Target Status*
meters, Xeriscaping, and careful management of irrigation sustainable operations Upgrade properties to 100% 81%
systems LED lighting
o Provide access to lower-cost on-site renewable energy (solar
panels)
Climate change policy
Install electric vehicle 25% 10%
❯ Understanding the risks and opportunities posed by climate charging stations at
Key Climate Change Goals:
change and natural hazards to our properties and stakeholders properties
1. Net zero carbon emissions by 2045
❯ Became signatory to the Science Based Targets initiative (“SBTI”) 2. 50% reduction in greenhouse gas emissions by 2030
aligned with the 1.5 degree Celsius pathway Improve on-site 20MW 5.6MW
Reduction in greenhouse gas emissions achieved as renewable energy
36% of 12/31/20 capacity (solar panels)
Reduce common area 40% > 40%
Providing enhanced transparency greenhouse gas
emissions
❯ Providing transparency by aligning reporting with industry standard frameworks
❯ Conducting climate-related risk assessments to assist in guiding portfolio management decisions
Reduce common area 40% > 40%
o Performed periodically across the entire portfolio electricity usage
o Included in standard acquisitions due diligence process
o Expect to be incorporated into reinvestment project approval and disposition scoping process as well *As of 12/31/2020.
Page 24Strength Of Team And Culture And Commitment To ESG Excellence Benefits All Stakeholders
Human capital management – committed to creating and sustaining a positive work environment
Engagement and Connectivity Growth Health and Well-being
Creating opportunities to interact and Encouraging growth through professional and Supporting employee health through
impact communities personal training and learning opportunities engagement and outreach
› Quarterly all-employee calls › Two-year intensive apprenticeship programs for entry level › Encouraging healthy lifestyles
employees in leasing, property management and construction
› Enhanced benefits and support based on employee feedback o Annual wellness spending accounts
› BRX Connect: internal exchange program for employees to
› Company-wide recognition of excellence learn about other functions in the Company o Free access to online applications
o “Our Center is You” – serving our communities › Personal development accounts: provide time off and expense o Weekly live meditation breaks
reimbursement for a personal or professional development
o “Find A Better Way” – recognizing ingenuity activity o Health-oriented competitions like our “Summer Step
Challenge” where all employees are offered a free fitness
› Company-wide enrichment events › Predictive Index Behavioral Assessments: enhance self- tracker
awareness and effective collaboration
o “Big Brain Days” – TED-Talk style events o Wellness Wednesdays – demonstrations
› One Day University and Linkedin Learning memberships covering a variety of healthy lifestyle topics
o Company-wide Day of Service and community service available to all employees to stimulate personal growth
projects – providing each employee with two paid › Ensuring employees are safe, functional, and efficient
Service Days annually year to make an impact in their
communities o Free access to licensed counselors to support mental
health
o Hybrid work schedules to maximize engagement,
collaboration and efficiency, while supporting a healthy
work-life balance
Page 25Strength Of Team And Culture And Commitment To ESG Excellence Benefits All Stakeholders Diversity, Equity and Inclusion
Leadership Council
Diversity, equity and inclusion
❯ We believe a culture based on diversity, equity and inclusion is critical in our ability to:
o Attract and retain talented employees o Deliver on strategic goals and objectives
• Reports directly to CEO and supported by the Employee
Resource Group
❯ We advocate for diversity, equity and inclusion in every part of the organization
52% • Assists in maintaining best practices and behaviors to enhance
Female employees inclusion and equity and promote diversity
o Company-wide participation in annual culture and ethics training
• Additional information: https://www.brixmor.com/why-
o Annual employee pledge to commit to helping Brixmor create and maintain an inclusive culture free brixmor/careers/social/brixmor-culture/diversity-inclusion
from harassment based on race, sexual orientation, gender, and other protected classes
o Diversity, equity and inclusion themes featured in employee trainings and community events
o Promoting diversity, equity and inclusion through human capital management initiatives
• Signed in 2021 by CEO Jim Taylor
• Growing diversity through the summer internship program • Largest CEO-driven business commitment to advance diversity
and inclusion in the workplace
• Partnering with diversity and inclusion-focused organizations to ensure
diversity of job candidates
Nareit Foundation’s DDEI Giving Campaign
o Diversity and inclusion goals formalized in our 2021 Corporate Responsibility
Report, and we will measure and report on progress annually • Founding member supporting charitable and educational
organizations and initiatives that will help create a more
o Assess pay equity periodically as it relates to gender, race and ethnicity diverse, equitable, and inclusive REIT and publicly traded real
estate industry
Page 26Strength Of Team And Culture And Commitment To ESG Excellence Benefits All Stakeholders
Experienced, diversified and effective Board of
Corporate governance Directors
8/9 1/3 1/9
Independent Female Directors African American
Leading the industry Directors Directors
Ranked #2 in REIT sector for Corporate Governance 61 years 6 years >75%
Average Director age Average Director Director attendance
tenure at 2021 meetings
Received the highest possible corporate governance score, representing the lowest level of governance risk
Top-ranked management team
Board summary
Unclassified Board of Directors
Ranked #2 among mid-cap REITs for Crisis Management – COVID-19
Diversity in composition and background of directors (33% female,
11% racially diverse)
Board Composition* Robust executive officer and director stock ownership guidelines
Member Chair Committee Membership Majority voting standard for directors
Director Nominating & Corporate Separate Chairperson and CEO
Board Member Age Since Audit Compensation Governance
Pledging and hedging of BRX stock by directors and executive
Jim Taylor 55 2016 officers prohibited
John Schreiber 75 2013 No cumulative voting
Michael Berman 63 2013
All Audit Committee members are financial experts
Julie Bowerman 53 2019
Sheryl Crosland 69 2016 Shareholder rights summary
Proxy access rights
Thomas Dickson 66 2015
No poison pill
Daniel Hurwitz 57 2016
No supermajority voting standards
Sandra A.J. Lawrence 64 2022 Opted out of the Maryland business combination and control
William Rahm 43 2013 share acquisition statutes
Stockholder ability to amend bylaws
*Data as of March 31, 2022. Page 27Additional Information
REITs
General information and fundamentals
What is a REIT?
A REIT, or Real Estate Investment Trust, is a company that owns, operates or finances income-producing real estate. Modeled after mutual funds, REITs give all investors access to the
benefits of real estate investment along with the advantages of investing in a publicly traded stock
How to qualify as a REIT:
Invest at least 75% of total assets in real estate
Derive at least 75% of gross income from real estate investments
Must have a minimum of 100 shareholders and no more than 50% of shares held by five or fewer individuals
Distribute at least 90% of taxable income to shareholders annually through dividends
• Nearly all REITs pay at least 100% to avoid taxation
• Allows shareholders to share in a REITs cash flow growth
Why invest In REITs?
Performance Liquidity Diversification Dividends
– The real estate market is the primary – Bought & sold daily like other stocks, – Low correlation with other stocks and – Reliable income returns through a
driver of REIT returns, therefore REITs mutual funds and ETFs bonds variety of market conditions
may be used as a liquid proxy for
– REITs have made it easier to rebalance – Historically have increased portfolio – 20% deduction of any qualified REIT
gaining access to the entire asset class
portfolios returns and reduced portfolio risk dividends (Tax Cut and Jobs Act of
– Reduce portfolio volatility 2017 Sec 199A)
– Offer a balance of capital appreciation
and income
Source: RBC Capital Markets, Nareit. Page 29Footnotes & Sources
Page 2 Brixmor Overview Page 11 Transformed Portfolio Uniquely Positioned For Outperformance
High quality, diversified, open-air retail portfolio Thriving retailers continue to highlight the importance of brick and mortar
1. By ABR. Community Centers include properties with total GLA between 125K - 400K SF. Neighborhood Centers include properties with 1. Source: Private Label Manufacturers Association: Private Brands Post Strong Q1 Growth. https://www.plma.com/article/plma-private-
total GLA less than 125K SF. Grocery-Anchored Regional Centers include properties greater than 250K SF with small shop spaces brands-post-strong-q1-growth
accounting for less than 30% of total property GLA, and that have a traditional or specialty grocer at the property (either owned or non-
owned). Power Centers include properties greater than 250K SF with small shop spaces accounting for less than 30% of total property Page 13 Value Accretive Capital Allocation
GLA, and that do not have a traditional or specialty grocer at the property (either owned or non-owned). Other includes lifestyle centers, Track record of delivering attractive risk-adjusted growth
unanchored strip centers and single tenant centers. 1. Represents gross project costs less any project specific credits (lease termination fees or other ancillary credits).
2. Anchors reflect spaces equal to or greater than 10,000 square feet ("SF") of GLA; Small shops reflect spaces less than 10,000 SF of GLA. 2. Assumes 6% cap rate.
3. Based on most recent tenant reported information.
Page 15 Value Accretive Capital Allocation
Page 5 Transformed Portfolio Uniquely Positioned For Outperformance Creating value at lower risk
Portfolio enhancements since year-end 2015 1. Represents gross project costs less any project specific credits (lease termination fees or other ancillary credits).
1. Based on most recent tenant reported information. 2. NOI yield is calculated as the projected incremental NOI as a percentage of the incremental third party costs of a specified project, net
2. Five-mile demographics weighted by ABR. of any project specific credits (i.e. lease termination fees or other ancillary credits).
3. Represents gross project costs less any project specific credits (lease termination fees or other ancillary credits). 3. Assumes 6% cap rate.
4. Assumes 6% cap rate.
Page 16 Value Accretive Capital Allocation
Page 6 Transformed Portfolio Uniquely Positioned For Outperformance Value delivered: Case Study
Outperformance throughout the pandemic 1. Represents gross project costs less any project specific credits (lease termination fees or other ancillary credits).
1. Peer averages include only those companies for which there is consistent historical data available, including FRT, REG (JV’s at share), and 2. NOI yield is calculated as the projected incremental NOI as a percentage of the incremental third party costs of a specified project, net
SITC (JV’s at share). of any project specific credits (i.e. lease termination fees or other ancillary credits).
3. Assumes 6% cap rate.
Page 7 Transformed Portfolio Uniquely Positioned For Outperformance
Portfolio transformation driving continued outperformance across every observable metric Page 20 Strong, Flexible Balance Sheet
1. Peer averages include only those companies for which there is consistent historical data available, including FRT, REG (JV’s at share), and 1. Calculated using the current quarter annualized.
SITC (JV’s at share). 2. Subsequent to March 31, 2022, the Company operating partnership, Brixmor Operating Partnership LP, amended and restated its
Unsecured Credit Facility and $300 Million Term Loan, increasing the total amount available under the Operating Partnership’s
Page 8 Transformed Portfolio Uniquely Positioned For Outperformance unsecured credit facilities from $1.55 billion to $1.75 billion, while extending the maturities and lowering the pricing of the Facilities. As
Generating attractive long-term growth with lower relative risk a result, the Company has no remaining debt maturities until 2024. For presentation purposes, credit facility reflects amounts as of
1. Signed but not commenced population represents approximately 410 basis points of total portfolio GLA ($51.7M in ABR), 60 basis points March 31, 2022.
($7.7M in ABR) of which represents leases on space that will be vacated by existing tenants in the near term.
2. Includes month-to-month tenants.
Page 9 Transformed Portfolio Uniquely Positioned For Outperformance
Significant remaining occupancy opportunity
1. Peer averages include FRT, IVT (JV’s at share), KIM (JV’s at share), KRG, PECO, REG (JV’s at share), and SITC (JV’s at share). Billed occupancy
reflects same property portfolio only for KIM, KRG, and REG.
Disclaimer & Safe Harbor
This presentation may contain forward-looking statements within the meaning of Section 27A of the Securities Act of 1933 and Section 21E of the Securities Exchange Act of 1934. These statements include, but are not limited to, statements related to the Company’s expectations regarding the
performance of its business, its financial results, its liquidity and capital resources and other non-historical statements. You can identify these forward-looking statements by the use of words such as “outlook,” “believes,” “expects,” “potential,” “continues,” “may,” “will,” “should,” “seeks,” “projects,”
“predicts,” “intends,” “plans,” “estimates,” “anticipates” or the negative version of these words or other comparable words. Such forward-looking statements are subject to various risks and uncertainties, including those described under the sections entitled “Forward-Looking Statements” and “Risk Factors”
in the Company’s Annual Report on Form 10-K for the year ended December 31, 2021 and the Company’s Quarterly Report on Form 10-Q for the quarter ended March 31, 2022, as such factors may be updated from time to time in our periodic filings with the SEC, which are accessible on the SEC’s
website at www.sec.gov. Accordingly, there are or will be important factors that could cause actual outcomes or results to differ materially from those indicated in these statements. These factors should not be construed as exhaustive and should be read in conjunction with the other cautionary
statements that are included in this release and in the Company’s filings with the SEC. The Company undertakes no obligation to publicly update or review any forward-looking statement, whether as a result of new information, future developments or otherwise, except as required by law..
Page 30You can also read