Brazilian Mangroves: Blue Carbon Hotspots of National and Global Relevance to Natural Climate Solutions
←
→
Page content transcription
If your browser does not render page correctly, please read the page content below
ORIGINAL RESEARCH
                                                                                                                                       published: 03 January 2022
                                                                                                                                   doi: 10.3389/ffgc.2021.787533

                                           Brazilian Mangroves: Blue Carbon
                                           Hotspots of National and Global
                                           Relevance to Natural Climate
                                           Solutions
                                           Andre S. Rovai 1* † , Robert R. Twilley 1† , Thomas A. Worthington 2† and Pablo Riul 3†
                                           1
                                            Department of Oceanography and Coastal Sciences, College of the Coast & Environment, Louisiana State University,
                                           Baton Rouge, LA, United States, 2 Conservation Science Group, Department of Zoology, University of Cambridge,
                          Edited by:       Cambridge, United Kingdom, 3 Departamento de Sistemática e Ecologia, Centro de Ciências Exatas e da Natureza,
         Dominic A. Andradi-Brown,         Universidade Federal da Paraíba, João Pessoa, Brazil
   World Wildlife Fund, United States
                        Reviewed by:
                         Steven Canty,
                                           Mangroves are known for large carbon stocks and high sequestration rates in biomass
   Smithsonian Marine Station (SMS),       and soils, making these intertidal wetlands a cost-effective strategy for some nations
                         United States
                                           to compensate for a portion of their carbon dioxide (CO2 ) emissions. However,
                  Luiz Drude Lacerda,
    Federal University of Ceara, Brazil    few countries have the national-level inventories required to support the inclusion of
                        Jacob Bukoski,     mangroves into national carbon credit markets. This is the case for Brazil, home of
     University of California, Berkeley,
                         United States
                                           the second largest mangrove area in the world but lacking an integrated mangrove
                  *Correspondence:
                                           carbon inventory that captures the diversity of coastline types and climatic zones in
                      Andre S. Rovai       which mangroves are present. Here we reviewed published datasets to derive the
                     arovai1@lsu.edu
                                           first integrated assessment of carbon stocks, carbon sequestration rates and potential
                            † ORCID:
                                           CO2eq emissions across Brazilian mangroves. We found that Brazilian mangroves hold
                      Andre S. Rovai
     orcid.org/0000-0003-4117-2055         8.5% of the global mangrove carbon stocks (biomass and soils combined). When
                     Robert R. Twilley     compared to other Brazilian vegetated biomes, mangroves store up to 4.3 times
     orcid.org/0000-0002-6173-6033
              Thomas A. Worthington
                                           more carbon in the top meter of soil and are second in biomass carbon stocks
     orcid.org/0000-0002-8138-9075         only to the Amazon forest. Moreover, organic carbon sequestration rates in Brazilian
                           Pablo Riul
                                           mangroves soils are 15–30% higher than recent global estimates; and integrated over
     orcid.org/0000-0003-4035-1975
                                           the country’s area, they account for 13.5% of the carbon buried in world’s mangroves
                   Specialty section:      annually. Carbon sequestration in Brazilian mangroves woody biomass is 10% of
         This article was submitted to
                                           carbon accumulation in mangrove woody biomass globally. Our study identifies Brazilian
                       Tropical Forests,
               a section of the journal    mangroves as a major global blue carbon hotspot and suggest that their loss could
       Frontiers in Forests and Global     potentially release substantial amounts of CO2 . This research provides a robust baseline
                                Change
                                           for the consideration of mangroves into strategies to meet Brazil’s intended Nationally
      Received: 30 September 2021
      Accepted: 09 December 2021           Determined Contributions.
        Published: 03 January 2022
                                           Keywords: Brazil, mangrove forests, blue carbon, hotspot, CO2 equivalent emissions
                            Citation:
                 Rovai AS, Twilley RR,
    Worthington TA and Riul P (2022)
    Brazilian Mangroves: Blue Carbon
                                           INTRODUCTION
     Hotspots of National and Global
         Relevance to Natural Climate
                                           Climate change velocity has outpaced models’ predictions spurring the implementation of natural
                            Solutions.     climate solutions policies centered on ecosystems self-organizing properties to mitigate fossil
  Front. For. Glob. Change 4:787533.       fuels emissions and ensue adaptive capacity to future alterations in the climate system. Natural
      doi: 10.3389/ffgc.2021.787533        ecosystems have evolved mechanisms that allow them to shift among alternate states while

Frontiers in Forests and Global Change | www.frontiersin.org                    1                                         January 2022 | Volume 4 | Article 787533
Rovai et al. Brazilian Mangroves: Blue Carbon Hotspots remaining functional over geomorphic timescales (Holling, Nationally Determined Contributions (NDC’s), in addition to 1973). Such processes are evident in dynamic coastal their significance as global coastal carbon sinks. sedimentary environments, which alternate between vegetated and unvegetated states (e.g., saltmarshes and mangroves versus mudflats and saltflats) in response to climate and millennial- MATERIALS AND METHODS scale changes in sea levels (Gabler et al., 2017; Saintilan et al., 2020). In particular, where sediment yield to coastal oceans Data Acquisition has not been impaired and coastal floodplains still allows for Geospatial Datasets and Analyses: Carbon Stocks in inland expansion, rising sea levels can increase accommodation Biomass and Soils space along mangrove- and marsh-dominated environments Global mangrove aboveground biomass (AGB) and soil organic sustaining continuous burial of terrigenous and marine organic carbon stock (SOC) values were retrieved from various sediments (Rogers et al., 2019). independent datasets that have explicitly mapped the spatial Among tidal saline wetlands, mangroves are known for high distribution parameters’ (Table 1). These global datasets were rates of carbon sequestration in soils (mean = 222 gC m−2 subsetted for Brazilian mangroves, and median statistics were yr−1 ; Jennerjahn, 2020; MacKenzie et al., 2020; Wang et al., computed from grided or vectorized datasets where available 2020), that are 50 times higher than reported for terrestrial or directly from the original references. Where possible, tropical and temperate forested biomes (mean = 4.5 gC m−2 uncertainties were assessed on the basis of bootstrapped 95% yr−1 ; McLeod et al., 2011). Combined with comparable carbon confidence intervals for medians using the bias corrected sequestration rates in woody biomass (mean = 82.7 gC m−2 and accelerated (BCa) method (Carpenter and Bithell, 2000; yr−1 , range = 13–2,160 gC m−2 yr−1 ; Xiong et al., 2019), Mangiafico, 2021). these intertidal wetlands can be a cost-effective strategy for As noted elsewhere (Bukoski et al., 2020), due to the scarcity some nations to compensate for part of their carbon dioxide of field observations there are no regional or global mangrove (CO2 ) emissions (Taillardat et al., 2018). To date, however, few belowground biomass (BGB) maps. Thus, to be consistent with countries have the country-level inventories required to support previous studies, we used a BGB:AGB ratio of 0.5 to estimate BGB the inclusion of coastal wetlands into national carbon credit across the world’s mangroves (IPCC, 2014; Hamilton and Friess, markets (e.g., Holmquist et al., 2018 for the United States and 2018; Rovai et al., 2021b). Further, biomass (both AGB and BGB) Serrano et al., 2019 for Australia). Moreover, global estimates was converted to carbon units using a conversion factor of 0.475 generally focus on carbon stocks within either soil or biomass (Hamilton and Friess, 2018). (Hutchison et al., 2014; Jardine and Siikamäki, 2014; Atwood To warrant direct comparison among independent sources, et al., 2017; Rovai et al., 2018, 2021b; Sanderman et al., 2018; we standardized per-area (MgC ha−1 ) and total (TgC or PgC) Tang et al., 2018; Simard et al., 2019; Kauffman et al., 2020), carbon stock estimates across AGB and SOC datasets using which are important to determine potential CO2eq emissions a conservative mangrove extent of 82,849 and 7,675 km2 for from mangrove forest loss (see Adame et al., 2021), but do the world’s and Brazilian mangroves, respectively (Table 1; not provide comparable information in terms of mitigating after Hamilton and Casey, 2016 but see Hamilton et al., 2018; current emission rates. Further, global estimates often do Worthington et al., 2020a for comprehensive discussions on not accurately quantify within-country variability, relying, in existing mangrove extent databases). many cases, on averaged reference values or model-based Biomass (AGB and BGB) and SOC (top 1 meter) stock generalizations to extrapolate predictions to data-poor or data- estimates for Brazilian mangroves used throughout this absent nations when harnessing national datasets would be study were computed from Rovai et al. (2018, 2021b) more appropriate to inform country-specific conservation targets respectively, given the comparatively larger number of (Worthington et al., 2020a). observations (>900 forest plots for AGB and >65 sites Brazil is home to the second largest mangrove area in the for SOC stocks distributed only within Brazil’s mangroves; world, with forests distributed across diverse coastal morphology Supplementary Table 1) used in these studies. It is noteworthy and climate gradients (Hamilton and Casey, 2016; Worthington that mean AGB and SOC estimates for global and Brazilian et al., 2020b). Despite accounting for over 9% of the world’s mangroves are consistent to mean values computed among mangroves, Brazil still lacks an integrated inventory of carbon previous studies (Table 1). Biomass (AGB and BGB) and stocks and carbon sequestration rates that capture the diversity SOC (top 1 meter) density in other Brazilian vegetated of coastline types and climatic zones in which mangroves biomes (Amazon forest, Atlantic forest, Pampa grasslands, are present. To fill this gap, we performed a comprehensive Cerrado savannas, Pantanal wetlands, and Caatinga forests) review of published global datasets to derive within-country were extracted from harmonized biomass (Spawn et al., estimates of carbon stocks and sequestration rates in mangrove 2020) and soil (Hiederer and Köchy, 2011) databases. Due soils and biomass that represent both geographic gradients to some overlap between spatial datasets, cells containing and administrative divisions in Brazil. In addition to delivering mangroves were excluded when computing biomass and SOC state-level estimates, we provide a direct comparison between density estimates for other Brazilian vegetated biomes. Global mangroves and Brazil’s other major vegetated biomes, identifying datasets were clipped to Brazil’s territory, split by state-level mangroves as a major carbon hotspot that can help meet intended administrative divisions and classified into vegetated biomes Frontiers in Forests and Global Change | www.frontiersin.org 2 January 2022 | Volume 4 | Article 787533
Rovai et al.                                                                                                             Brazilian Mangroves: Blue Carbon Hotspots

TABLE 1 | Published above- and belowground biomass (AGB and BGB), and soil organic carbon (SOC) stock estimates for global and Brazilian mangroves.

Source                             Mean AGB (MgC ha−1 )           Mean BGB (MgC ha−1 )              Mean SOC (MgC ha−1 )

                                   Global            Brazil       Global              Brazil        Global              Brazil

Rovai et al., 2018, 2021b            78                66           39                 33            297a               241a
Kauffman et al., 2020               115b             125b          741b               347b           334                 155
Simard et al., 2019                  58                42           29                 21            283c
Hamilton and Friess, 2018            98                             49
Tang et al., 2018                    69                78           42                 31
Sanderman et al., 2018                                                                               361                 358
Atwood et al., 2017                                                                                  283                 308
Hutchison et al., 2014               87                80           34                 30            447
Jardine and Siikamäki, 2014                                                                          369                 342
Overall mean                       78 ± 7           67 ± 9        39 ± 3             29 ± 3        329 ± 16            281 ± 37

Source                                Total AGB (PgC)                Total BGB (PgC)                   Total SOC (PgC)                 Ecosystem-level C (PgC)

                                   Global            Brazil       Global              Brazil        Global              Brazil         Global             Brazil

Rovai et al., 2018, 2021b           0.81              0.06         0.41               0.03          2.26a               0.16a           3.48              0.25
Kauffman et al., 2020               0.95              0.05         2.90b              0.13b          2.70                0.12           6.55b             0.30b
Simard et al., 2019                 0.46              0.03         0.23               0.02          2.14c                               2.83
Hamilton and Friess, 2018            0.8                           0.41                             2.96d                               4.17              0.39
Tang et al., 2018                   0.56              0.06         0.34               0.02
Sanderman et al., 2018                                                                               3.80                0.27
Atwood et al., 2017                                                                                  2.60                0.24
Hutchison et al., 2014              0.72              0.06         0.28               0.02           3.64                               4.64
Jardine and Siikamäki, 2014                                                                          2.96                0.26
Overall mean                    0.72 ± 0.073     0.05 ± 0.006   0.33 ± 0.035       0.02 ± 0.003   2.99 ± 0.25      0.21 ± 0.03       3.78 ± 0.40      0.32 ± 0.07
Brazil’s % of global                         6.9%                          6.1%                                 7.0%                               8.5%
a Based on Rovai et al. (2018).
b Notincluded in the overall mean computation since per unit area values were >30 and >90% higher than mean AGB and SOC values computed from all other studies.
c Based on Atwood et al. (2017); not included in the overall mean computation.
d Based on Jardine and Siikamäki (2014); not included in the overall mean computation.

according to the Brazilian Geography and Statistics Institute                       returned a total of 19 studies. Only studies conducted in Brazilian
databases (IBGE, 2019).                                                             mangroves that presented data on carbon sequestration in either
                                                                                    woody AGB (N = 2) or soils (N = 7) were included in our
Literature Search: Carbon Sequestration in Biomass                                  analyses. Carbon sequestration rates in mangrove woody biomass
and Soils                                                                           and soils were classified into one of four coastal geomorphic
Carbon sequestration in mangrove woody biomass and soils were                       types along Brazil’s shoreline: deltas, estuaries, lagoons or open
estimated based on a comprehensive literature review performed                      coasts (after Worthington et al., 2020b). Differences among those
online on Google Scholar, Science Direct, Web of Science, and                       coastal typologies were assessed using analysis of variance for
the Brazilian SciELO databases. For carbon sequestration in                         unbalanced designs (ANOVA function from R “car” package; Fox
woody biomass, we performed searches using the following                            and Weisberg, 2019).
expressions: “carbon sequestration,” “carbon accumulation,”
“wood production,” “biomass production,” “stem growth,” “basal
area increment,” and “DBH increment” always in combination                          Carbon Dioxide Equivalents Emissions
with the terms “mangrove” and “Brazil.” Altogether the searches                     and Foregone Carbon Sequestration
returned a total of 1,000 articles (Google Scholar = 815,                           Carbon dioxide equivalents (CO2eq ) for both carbon stock and
Science Direct = 51, and Web of Science = 134). For carbon                          carbon sequestration rate values were estimated using a CO2 :C
sequestration in mangrove soils, we used the expressions “carbon                    stoichiometric ratio of 3.67 (i.e., CO2 /C = 44/12 = 3.67), which
sequestration,” “carbon accumulation,” “carbon burial,” and                         is used as a multiplying factor to convert carbon atoms to
“carbon accretion” again always in combination with the terms                       CO2 molecules. Potential CO2eq emissions were computed on
“mangrove” and “Brazil.” Initial searches returned a total of                       a “stock-difference” basis (sensu Kauffman et al., 2017) using
3,725 articles (Google Scholar = 3,240, Science Direct = 404,                       published mangrove biomass and soil carbon stock estimates
and Web of Science = 81). Searches performed at the Brazilian                       (based on Rovai et al., 2018, 2021b as detailed above) and
SciELO database included generic Portuguese terms “carbono”                         carbon sequestration rates (from the literature review). Further,
(for carbon) and “mangue∗ ” (for mangrove or mangal), which                         we coupled degradation-specific carbon emission factors (after

Frontiers in Forests and Global Change | www.frontiersin.org                   3                                            January 2022 | Volume 4 | Article 787533
Rovai et al. Brazilian Mangroves: Blue Carbon Hotspots
Sasmito et al., 2019: Erosion AGB = 1, SOC = 1; Clearing global stocks), BGB (0.02 PgC or 6.1% of global stocks) and
AGB = 0.7, SOC = 0.21; Settlement AGB = 1, SOC = 0.66; soils (0.21 PgC or 7.0% of global stocks). On a per-area basis,
Extreme weather AGB = 0.31, SOC = 0.14; Agriculture and Brazilian mangroves store on average 66, 33, and 241 MgC ha−1
aquaculture AGB = 0.83, SOC = 0.52) with a high-resolution map in AGB, BGB and soils, respectively (from Rovai et al., 2018,
of drivers of mangrove forest loss (covering the period 2000– 2021b for AGB and BGB, and SOC, respectively). Standardized to
2016; after Goldberg et al., 2020) to determine the dominant the same mangrove forest coverage, these values are comparable
historical cause of mangrove degradation for each Brazilian to and often more conservative than other studies’ estimates.
state. While some mangrove loss drivers may change over However, our ecosystem-level carbon stock estimate for Brazilian
time, dominant degradation causes, particularly those driven mangroves is 36% lower than that reported in Hamilton and
by climate (e.g., erosion caused by sea level rise and extreme Friess (2018) due to overestimated SOC density estimates for
weather events, which affects 85% of the country’s mangrove Brazil (from Jardine and Siikamäki, 2014) used in that study.
coverage; Goldberg et al., 2020), are likely to remain as a result Over 80% of all mangrove carbon stocks in Brazil are found in
of global climate change. Likewise, agriculture or aquaculture the states of Maranhão (91.3 TgC), Pará (61.2 TgC) and Amapá
and clearing may be harder to reduce in Brazil in the years to (47.3 TgC), reflecting extensive coverage which amounts to more
come due to increasing relaxation of environmental regulations. than 80% of the country’s total mangrove area (Table 2).
Once determined, dominant state-level emission factors were Largest per-area AGB values are also found in these three
multiplied by carbon stocks in AGB and in soils (top 1 states (215.5, 205.3, and 166.7 Mg ha−1 in Amapá, Pará and
meter) separately and then summed to compute ecosystem-level Maranhão, respectively) as well as in Piauí (143.4 Mg ha−1 ),
potential CO2eq emissions for each mangrove cell in the gridded where mangroves develop in nutrient-rich deltaic systems. In
dataset (that is, AGB and SOC density estimates combined from contrast, lowest per-area AGB was found in Santa Catarina
Rovai et al., 2018, 2021b). (56.8 Mg ha−1 ), near the austral distribution limit for mangrove
All raster and vector manipulations and geospatial analyses forests in the Southwestern Atlantic (Schaeffer-Novelli et al.,
were performed using R (R Core Team, 2020) packages ‘geobr’ 1990; Soares et al., 2012). AGB was also lower in São Paulo (84.2
(Pereira and Goncalves, 2021), ‘raster’ (Hijmans, 2020), and Mg ha−1 ) and Rio de Janeiro (83.1 Mg ha−1 ), where extensive
‘rgdal’ (Bivand et al., 2020). mangrove areas have been impacted by industrial activities and
urban expansion (Soares, 1999; Ferreira and Lacerda, 2016;
Moschetto et al., 2021). AGB values 100 Mg ha−1 were found in Espírito Santo
average 8.5% (or 0.32 PgC) of the world’s mangrove organic and Bahia mangroves where the multidecadal stability of more
carbon stocks, partitioned among AGB (0.05 PgC or 6.9% of than 70% of the mangrove coverage suggests that the integrity of
TABLE 2 | Median (95% Confidence Intervals) and total values for above- and belowground biomass (AGB and BGB) and, soil organic carbon (SOC) stock estimates for
Brazilian states.
State Mangrove AGB SOC Total OC in Total OC in Total SOC Ecosystem-level Ecosystem-level
area (ha)a (Mg ha−1 ) (Mg ha−1 ) AGB (Tg) BGB (Tg)b (Tg) C (Tg) C (%)
Maranhão (MA) 297,158.47 167 (160–171) 178 (174–179) 24.74 12.37 54.15 91.26 36.56
Pará (PA) 186,977.44 205 (200–208) 196 (173–209) 18.17 9.08 33.94 61.19 24.52
Amapá (AP) 141,625.98 215 (200–227) 209 (138–209) 14.26 7.13 25.92 47.31 18.95
Bahia (BA) 46,460.39 106 (90–114) 278 (276–279) 2.53 1.27 12.90 16.70 6.69
Paraná (PR) 19,581.39 99 (92–108) 269 (260–269) 0.97 0.48 5.26 6.71 2.69
São Paulo (SP) 14,776.24 84 (76–88) 270 (269–272) 0.60 0.30 4.07 4.97 1.99
Sergipe (SE) 10,056.71 98 (87–121) 286 (283–286) 0.53 0.26 2.90 3.69 1.48
Pernambuco (PE) 8,821.82 99 (93–121) 281 (276–281) 0.44 0.22 2.47 3.13 1.25
Paraíba (PB) 8,579.79 80 (75–84) 269 (268–269) 0.33 0.16 2.33 2.82 1.13
Rio de Janeiro (RJ) 7,182.39 83 (77–87) 293 (289–306) 0.35 0.17 2.21 2.73 1.09
Santa Catarina (SC) 6,430.90 57 (44–66) 285 (279–297) 0.21 0.10 1.82 2.14 0.86
Espírito Santo (ES) 5,796.23 119 (102–128) 292 (256–304) 0.29 0.14 1.68 2.11 0.85
Rio Grande do Norte (RN) 5,012.71 102 (93–105) 272 (268–272) 0.27 0.13 1.37 1.77 0.71
Ceará (CE) 3,532.48 79 (74–93) 253 (247–253) 0.16 0.08 0.89 1.14 0.46
Alagoas (AL) 2,826.20 97 (88–106) 284 (281–285) 0.13 0.06 0.81 1.00 0.40
Piauí (PI) 2,680.41 144 (80–182) 239 (237–239) 0.18 0.09 0.65 0.92 0.37
Total 64.14 32.07 153.37 249.58 100
a Estimated using Hamilton and Casey (2016) mangrove cover dataset.
b Estimated using Hamilton and Friess (2018) 0.5 AGB to BGB conversion factor.
OC, organic carbon.
Frontiers in Forests and Global Change | www.frontiersin.org 4 January 2022 | Volume 4 | Article 787533Rovai et al. Brazilian Mangroves: Blue Carbon Hotspots
are second only to the Amazon forest, and 2.7–4.7 times higher
350
Biomass (above− and belowground) than other Brazilian vegetation formations.
Ecosystem−level C stocks (MgC ha−1)
Soil (top meter)
300
Carbon Sequestration in AGB and Soils
Currently, only two studies in Brazil report on carbon
250
sequestration in mangrove woody AGB (Table 3). From these
studies, carbon sequestration in Brazilian mangroves’ woody
200
AGB was estimated at 3.18 MgC ha−1 yr−1 , consistent with
values reported for a diversity of coastal typologies worldwide
150 (Table 3). Thus, we used this reference value to produce a first
order country-level estimate of annual carbon sequestration in
100 Brazilian mangrove AGB, which totals 2.44 TgC yr−1 , equivalent
to 10% of all carbon sequestered in mangroves AGB globally.
50 Long-term carbon sequestration rates (mostly 210 Pb-dated
cores) in Brazilian mangrove soils was estimated at 2.81
MgC ha−1 yr−1 (Table 4). While there were no differences
0
(P > 0.05, results not shown) across the coastal geomorphic
for tic
tla a l
for a
for on
ssl pa
va do
for ve
t
s
ts
ts
ts
ds
a
ng
es
n
nd
nn
an
gro
az
m
rra
es
es
es
types found along Brazil’s shoreline, this value is 15–30% higher
nta
an
ati
a
At l
Am
Ce
n
P
Pa
Ca
than recent global estimates (e.g,. 1.94–2.39 MgC ha−1 yr−1 ;
Ma
sa
we
gra
Jennerjahn, 2020; MacKenzie et al., 2020; Wang et al., 2020),
Brazilian vegetated biomes likely due to the predominance of minerogenic coastlines (deltaic,
which accounts for >80% of the country’s mangrove area,
FIGURE 1 | Comparison of ecosystem-level carbon stocks (above-, and meso- and macrotidal estuarine systems) where deposition
belowground biomass and soil organic carbon in the top 1 meter combined)
among major Brazilian vegetated biomes.
of both autochthonous (mangrove detritus) and allochthonous
(terrestrial and marine detritus) sediments are amplified (Adame
et al., 2010; Kusumaningtyas et al., 2019; Cragg et al., 2020).
Importantly, when this national median value is multiplied by the
country’s mangrove area coverage, annual carbon sequestration
core areas have been maintained over time (Diniz et al., 2019). in Brazilian mangroves soils was estimated at 2.14 TgC yr−1 ,
Predicted median AGB for Rio Grande do Norte mangroves was corresponding to about 13.5% of the total amount of carbon
also >100 Mg ha−1 despite mangroves developing in a semi- buried annually in the world’s mangroves.
arid climate and historical damage from shrimp farming (Lacerda
et al., 2021). However, this result is likely due to the small number
of observations used to constrain biomass predictions for that Potential CO2eq Emissions and Foregone
region (only two AGB values available for Rio Grande do Norte at Carbon Sequestration
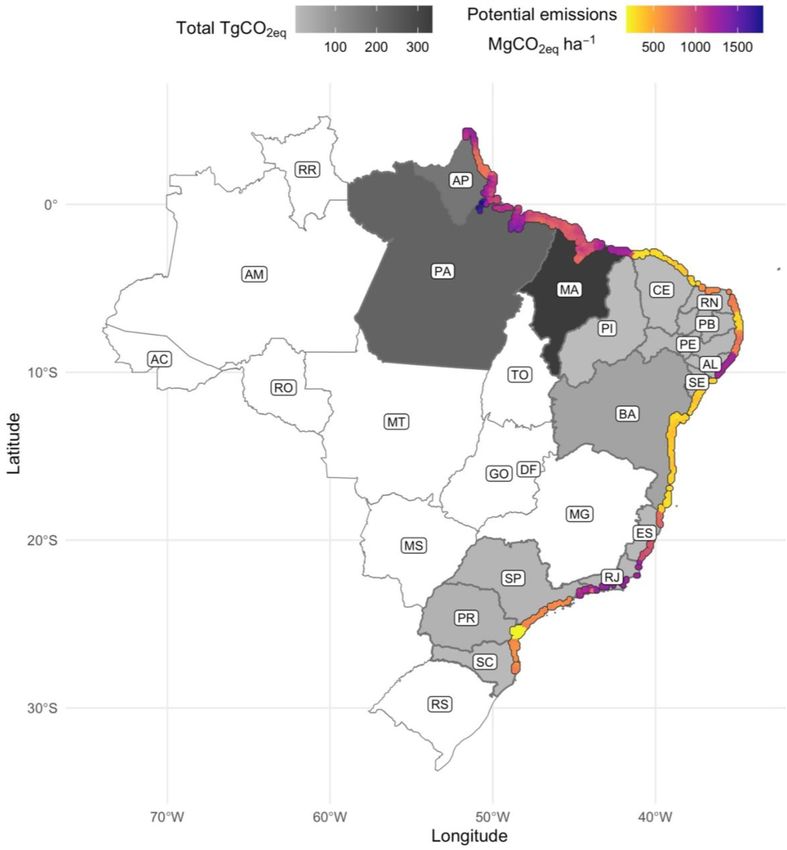
the time Rovai et al., 2021b study was conducted; Supplementary Highest potential CO2eq emissions (>900 MgCO2eq ha−1 )
Table 1). Regarding SOC stocks, deltaic mangroves in Piauí, resulting from loss of existing mangrove forests were estimated
Amapá, Pará and Maranhão states had lower soil carbon for Rio de Janeiro, Alagoas, Piauí, Pará, Amapá, and Maranhão
density due to higher inorganic-to-organic ratio per soil volume states driven by the dominance of erosion (Figure 2 and
characteristic of coastal deltaic floodplains when compared to Table 5) where eventually all carbon stored in soils (here based
predominantly estuarine or lagoonal mangroves (Rovai et al., on top 1 meter) and in AGB is lost to the atmosphere. It
2018; Sanderman et al., 2018; Jennerjahn, 2020; MacKenzie should be noted, however, that while eroded SOC is rapidly
et al., 2020) found in other Brazilian states (Table 2). When mineralized in aerobic estuarine waters (Sapkota and White,
summed, carbon stocks in biomass (AGB+BGB) and soils across 2021), carbon release back to the atmosphere from biomass loss
Brazilian mangroves averaged 341 MgC ha−1 (range: 297–397 is not immediate given slow decomposition rates of downed
MgC ha−1 ), showing little variation among states (e.g., maximum wood in mangrove forests (Romero et al., 2005). Notably,
difference of 23% or ∼80 MgC ha−1 ) (Table 2). This relatively when considering only the top 1 meter of soil to compute
small variability in per-unit area carbon stocks reflect mangrove such estimates, these values are amongst the highest CO2eq
plants’ resource partitioning strategies in response to broad emissions reported in the literature for other mangrove sites
geographical gradients (Rovai et al., 2021b), chiefly the role of worldwide (Kauffman et al., 2017; Alongi, 2020; Adame et al.,
coastal geomorphology in controlling the ratio between inorganic 2021). Further agriculture/aquaculture- and settlement-based
and organic matter in mangrove soils (Twilley et al., 2018; losses (emission factors of 0.83 and 1.00 for AGB and 0.52 and
Jennerjahn, 2020). 0.66 for SOC, respectively) were also anticipated to cause high
Comparatively, on a per-area basis mangroves store between potential CO2eq emissions (>500 MgCO2eq ha−1 ) in Espírito
2.2 and 4.3 times more carbon in the top meter of soil relative Santo, Pernambuco, Rio Grande do Norte, São Paulo, and
to other Brazilian vegetated biomes (Figure 1). Regarding mean Santa Catarina states as these activities represent a considerable
carbon stocks in biomass (AGB and BGB combined), mangroves loss of both aboveground and soil compartments (Figure 2).
Frontiers in Forests and Global Change | www.frontiersin.org 5 January 2022 | Volume 4 | Article 787533Rovai et al. Brazilian Mangroves: Blue Carbon Hotspots
TABLE 3 | Carbon sequestration rates in woody biomass for Brazilian and global mangroves.
Region State Typology Wood NPP (MgC ha−1 yr−1 ) Source
Southeast Rio de Janeiro (RJ) Open coast 2.64 ± 1.03 Estrada et al., 2015a
1.90 ± 1.00
2.39 ± 1.45
São Paulo (SP) Lagoon 7.03 ± 1.30 Data from Rovai et al., 2021ab
4.06 ± 1.16
3.71 ± 1.07
Overall median (95% Confidence Intervals) Brazil 3.18 (2.14–4.84)
Global Deltas 3.64 ± 0.30 Data from Xiong et al., 2019b
Estuaries 2.96 ± 0.39
Lagoons 4.64 ± 1.32
Open coasts 4.14 ± 0.63
Overall median (95% Confidence Intervals) global 3.89 (2.96–4.39)
a Mean ± 1SD as reported in the original study.
b Mean ± 1SE.
NPP, net primary productivity.
TABLE 4 | Carbon sequestration rates in soils for Brazilian mangroves.
Region State Site Typology Carbon Dating method Source
sequestration rate
(MgC ha−1 yr−1 )
North Pará (PA) Ajuruteua Delta 2.54 Wang et al., 2020
Northeast Pernambuco (PE) Tamandaré Estuary 3.53 210Pb Sanders et al., 2010b
Tamandaré Estuary 9.49 210Pb Sanders et al., 2010b
Bahia (BA) Jaguaripe Estuary 1.26 ± 0.14a 210Pb Hatje et al., 2021
Jaguaripe Estuary 1.28 ± 0.03a 210Pb Hatje et al., 2021
Jaguaripe Estuary 2.89 ± 0.09a 210Pb Hatje et al., 2021
Jaguaripe Estuary 3.37 ± 0.07a 210Pb Hatje et al., 2021
Jaguaripe Estuary 4.08 ± 0.04a 210Pb Hatje et al., 2021
‘ Jaguaripe Estuary 7.76 ± 1.28a 210Pb Hatje et al., 2021
Southeast Espírito Santo (ES) Caieira Velha Estuary 2.82 Wang et al., 2020
Vitoria Estuary 3.79 Wang et al., 2020
Anchieta Open coast 4.30 210Pb Wang et al., 2020
Rio de Janeiro (RJ) Ilha Grande Open coast 1.86 210Pb Sanders et al., 2008
Ilha Grande Open coast 1.69 210Pb Sanders et al., 2010c
Guanabara Estuary 2.76 Wang et al., 2020
Guanabara Estuary 2.93 Wang et al., 2020
Sepetiba Open coast 5.85 Wang et al., 2020
São Paulo (SP) Cananéia Lagoon 2.80 ± 0.14b 137Cs Sanders et al., 2014
Cubatão Lagoon 10.21 ± 0.93b,c 137Cs Sanders et al., 2014
Cananéia Lagoon 1.92 210Pb Sanders et al., 2010a
Cananéia Lagoon 2.34 210Pb Sanders et al., 2010a
South Paraná (PR) Paranaguá Estuary 1.68 210Pb Sanders et al., 2010c
Guaratuba Estuary 3.37 210Pb Sanders et al., 2010c
Overall median (95% Confidence Intervals) 2.81 (1.92–3.37)
a Mean ± 1SE computed from different depths within same cores for each site.
b Mean ± 1SE computed from two sites.
c Impacted site, not used to compute median and 95% CI’s.
Lowest potential CO2eq emissions were linked to episodic estimates are conservative considering only carbon stored in
extreme weather events that have the potential to release smaller AGB and soils (but not in BGB, since emission factors for
fractions on carbon stored in AGB (31%) and soils (14%) this plant compartment have not been established yet) were
followed by clearing, which can remove substantial carbon stocks used to compute potential CO2eq emissions resulting from
in aboveground (70%) and soil (21%) compartments. These mangrove forest loss.
Frontiers in Forests and Global Change | www.frontiersin.org 6 January 2022 | Volume 4 | Article 787533Rovai et al. Brazilian Mangroves: Blue Carbon Hotspots FIGURE 2 | Total CO2eq stored in biomass and soils (grayscale top left legend) and variability in potential CO2eq emissions (colored scale top right legend) across Brazilian mangroves. Mangrove coverage exaggerated to improve visualization. Estimates per state are given on Table 5. Mangrove states: AP, Amapá; PA, Pará; MA, Maranhão; PI, Piauí; CE, Ceará; RN, Rio Grande do Norte; PB, Paraíba; PE, Pernambuco; AL, Alagoas; SE, Sergipe; BA, Bahia; ES, Espírito Santo; RJ, Rio de Janeiro; SP, São Paulo; PR, Paraná; and SC, Santa Catarina. Non-mangrove states: RR, Roraima; AM, Amazonas; AC, Acre; RO, Rondônia; MT, Mato Grosso; TO, Tocantins; GO, Goiás; DF, Distrito Federal; MS, Mato Grosso do Sul; MG, Minas Gerais; RS, Rio Grande do Sul. The loss of carbon sequestration potential after mangrove Based on the current reference value of 2.81 MgC ha−1 forests are degraded was assumed here to be 100% considering yr−1 (Table 4), we estimated an annual loss of 10.31 that soil and vegetation loss represent either acute stressors, MgCO2 ha−1 yr−1 that would otherwise be buried in which ceases mangrove production altogether, or chronic mangrove soils. Combined with loss of carbon sequestration stressors that leave the system more susceptible to eventually potential in woody biomass, based on the current reference collapse (Lugo et al., 1981; Lewis et al., 2016; Krauss et al., 2018). value of 3.18 MgC ha−1 yr−1 (Table 3), foregone carbon Further, there are currently no consistent degradation-specific sequestration in Brazilian mangroves annually could total 22 emission factors available to estimate loss of carbon sequestration MgCO2 ha−1 yr−1 , in line with estimates reported for other potential as there is for change in carbon stocks resulting from mangroves worldwide (23-254 MgCO2 ha−1 yr−1 as reviewed distinct mangrove deforestation causes (e.g., Sasmito et al., 2019). in Alongi, 2014). Frontiers in Forests and Global Change | www.frontiersin.org 7 January 2022 | Volume 4 | Article 787533
Rovai et al.                                                                                                                Brazilian Mangroves: Blue Carbon Hotspots

TABLE 5 | Median values (95% Confidence Intervals) for potential CO2eq emissions resulting from mangrove forest loss across Brazil.

State                                  Dominant driver of                Potential emissions                Potential emissions                Potential emissions
                                        mangrove lossa                          AGB                                SOC                          Ecosystem-level
                                                                           (MgCO2eq ha−1 )                    (MgCO2eq ha−1 )                    (MgCO2eq ha−1 )

Alagoas (AL)                                 Erosion                        169 (154–185)                    1,040 (1,030–1,050)                1,210 (1,190–1,220)
Amapá (AP)                                   Erosion                        376 (348–397)                       767 (508–768)                    1,030 (911–1,110)
Bahia (BA)                                   Clearing                       130 (109–139)                       214 (212–215)                      341 (326–350)
Ceará (CE)                                   Clearing                         97 (91–113)                       195 (186–195)                      288 (283–315)
Espírito Santo (ES)                        Settlement                       208 (180–223)                       707 (620–736)                      885 (832–921)
Maranhão (MA)                                Erosion                        291 (279–298)                       655 (639–657)                      937 (919–957)
Pará (PA)                                    Erosion                        358 (349–363)                       719 (633–767)                   1,080 (1,010–1,110)
Paraíba (PB)                                 Clearing                         97 (92–102)                       207 (206–207)                      307 (299–309)
Paraná (PR)                             Extreme weather                       53 (49–58)                        138 (134–138)                      193 (189–195)
Pernambuco (PE)                          Agri/Aquiculture                   143 (135–176)                       536 (527–536)                      677 (657–713)
Piauí (PI)                                   Erosion                        251 (140–316)                       877 (871–877)                   1,120 (1,010–1,190)
Rio de Janeiro (RJ)                          Erosion                        145 (134–152)                    1,070 (1,060–1,120)                1,250 (1,200–1,260)
Rio Grande do Norte (RN)                 Agri/Aquiculture                   148 (134–153)                       519 (511–519)                      667 (651–672)
Santa Catarina (SC)                      Agri/Aquiculture                     82 (64–95.)                       545 (533–556)                      620 (612–655)
São Paulo (SP)                           Agri/Aquiculture                   122 (111–128)                       516 (513–519)                      645 (625–649)
Sergipe (SE)                                 Clearing                       120 (106–148)                       220 (218–220)                      340 (327–373)
Total                                                                            2,791                              8,925                             11,590
a After
     Goldberg et al. (2020). See “Materials and Methods” section for details about emission factors applied to estimate CO2eq emissions for each of these categories.
AGB, aboveground biomass; SOC, soil organic carbon.

CONCLUSION AND                                                                        account for 13.6% of the carbon buried in world’s mangroves
RECOMMENDATIONS                                                                       annually. Likewise, carbon sequestration in Brazilian mangroves
                                                                                      woody biomass is also higher than global estimates, accounting
Here we deliver the first integrated assessment of mangrove                           for nearly 10% of carbon accumulation in mangrove woody
carbon stocks, carbon sequestration rates and potential CO2eq                         biomass globally.
emissions for each Brazilian state. While more data are needed                           This study also highlights important research gaps and
(e.g., particularly on carbon sequestration and emission factors)                     uncertainties in Brazilian mangroves carbon inventories. For
to better quantify national level statistics, this study provides                     example, the greatest carbon sink capacity in mangroves lies
compelling information to both aid the inclusion of mangroves                         in the soils since this ecosystem compartment continuously
in national (or state-level) carbon credit markets and establish                      fixes and preserves layers of millennia-old atmospheric carbon
Brazilian mangroves as hotspots within the context of global blue                     beneath the surface. However, we still know very little about
carbon policies. Our estimates suggest that Brazilian mangroves                       the carbon sequestration potential of Brazilian mangroves
can potentially release substantial amounts of carbon following                       soils, particularly the contribution of the Amazon Macrotidal
mangrove forest loss, with CO2eq emissions nearing those                              Mangrove Coast (AMMC) to global carbon budgets. To date, we
estimated for other carbon-rich mangrove forests. In addition,                        have found only one study reporting on soil carbon sequestration
loss of carbon sequestration potential in both woody biomass                          rates in this region (Table 4). Overall, several of Brazil’s northern
and soils following deforestation amplifies cumulative emissions                      and northeastern states, where >80% of the country’s mangroves
annually, shortening the country’s capacity to mitigate its fossil                    are present, lack data; seven and nine states out of the 16
fuel emissions and meet intended NDC’s.                                               mangrove states in Brazil still lack data on soil organic carbon
   In summary, we showed that Brazil is home of 9.3% of the                           stocks and sequestration rates, respectively (Supplementary
world’s mangroves, commensurably holding 8.5% of the global                           Table 1). It should also be noted that, while this study focused
mangrove carbon stocks (biomass and soils combined). When                             on carbon stocks and long-term carbon sequestration rates
compared to other Brazilian vegetated biomes, on a per-area                           in biomass and soils, real time air-sea CO2 fluxes, and DOC
basis mangroves store between 2.2 and 4.3 times more carbon                           (dissolved organic carbon), DIC (dissolved inorganic carbon),
in the top meter of soil. While for carbon stocks in biomass,                         and alkalinity (bicarbonate) export are important mechanisms of
Brazilian mangroves are second only to the Amazon forest,                             the carbon cycling in mangroves (e.g., Sippo et al., 2016; Carvalho
and store between 2.7 and 4.7 times more carbon than other                            et al., 2017; Cotovicz et al., 2019; Cabral et al., 2021) and should
vegetated biomes. Moreover, on a per-area basis organic carbon                        be taken into account to better constrain carbon budgets for
sequestration rates in Brazilian mangroves are 15–30% higher                          Brazilian mangroves.
than recent global estimates. Importantly, integrated over the                           Mangrove AGB density has been consistently mapped across
country’s area, carbon sequestration in Brazilian mangroves soils                     Brazilian mangroves, but disparities exist. For instance, no data

Frontiers in Forests and Global Change | www.frontiersin.org                      8                                           January 2022 | Volume 4 | Article 787533
Rovai et al. Brazilian Mangroves: Blue Carbon Hotspots
was apparent for Alagoas’ mangroves and only a few plots have mangrove restoration where feasible to increase carbon
been implemented in Amapá (2 plots), Piauí (2 plots), Rio Grande crediting potential.
do Norte (2 plots), and Paraíba (6 plots) states (Supplementary
Table 1). While for carbon sequestration in woody biomass,
currently only two states (Rio de Janeiro and São Paulo) are DATA AVAILABILITY STATEMENT
represented (Table 3). The situation is far more critical for BGB
density and productivity estimates. In this study we used a 0.5 The original contributions presented in the study are included
BGB:AGB ratio to estimate BGB across Brazilian mangroves; in the article/Supplementary Material, further inquiries can be
however, to our knowledge, there are only two studies that directed to the corresponding author.
have comprehensively (using trenching vs. coring techniques;
see Adame et al., 2017 for a comprehensive discussion) assessed
actual BGB distribution in Brazilian mangroves (Santos et al., AUTHOR CONTRIBUTIONS
2017 in Rio de Janeiro and Virgulino-Júnior et al., 2020
in Pará). Moreover, BGB productivity and root necromass, AR conceived the study, collated and analyzed data, and wrote
which are important contributors to refractory carbon stored the draft. RT, TW, and PR analyzed data and wrote the
in mangroves soils (Kihara et al., 2021), remain unknown for draft. All authors contributed to the article and approved the
Brazilian mangroves. submitted version.
It is imperative that future research efforts and funding
opportunities focus on addressing these data coverage issues.
This is particularly pertinent for the data-poor northern states, ACKNOWLEDGMENTS
where the AMMC is located, as carbon fluxes are more
intense due to the synergistic contribution or riverine and AR is thankful to the Brazilian foundations CAPES and CNPq,
tidal forcings that dictate coastal and ecological processes (e.g., and their Science Without Borders program for having funded
deposition, erosion, mineralization, export). We recommend the Ph.D. research (BEX1930/13-3) in which much of the data
future carbon inventories in Brazilian mangroves to look used in this study has originated. We are grateful to Jacob Bukoski
beyond carbon stocks in biomass and soils and prioritize for providing insightful comments that have much improved the
carbon fluxes via biomass (e.g., woody biomass growth) quality of our original draft.
and soils (long-term carbon sequestration) as well as export
of other carbon forms (e.g., DOC, DIC, alkalinity), which
provide a direct comparison to greenhouse gases emission SUPPLEMENTARY MATERIAL
rates. Overall, this study consolidates the scientific basis
demonstrating the significance of Brazilian mangroves to The Supplementary Material for this article can be found
achieve NDC’s both by enforcing environmental regulations online at: https://www.frontiersin.org/articles/10.3389/ffgc.2021.
to protect the country’s existing mangroves and by promoting 787533/full#supplementary-material
REFERENCES Cabral, A., Dittmar, T., Call, M., Scholten, J., de Rezende, C. E., Asp, N., et al.
(2021). Carbon and alkalinity outwelling across the groundwater-creek-shelf
Adame, M. F., Cherian, S., Reef, R., and Stewart-Koster, B. (2017). Mangrove root continuum off Amazonian mangroves. Limnol. Oceanogr. Lett. 6, 369–378.
biomass and the uncertainty of belowground carbon estimations. For. Ecol. doi: 10.1002/lol2.10210
Manage. 403, 52–60. doi: 10.1016/j.foreco.2017.08.016 Carpenter, J., and Bithell, J. (2000). Bootstrap confidence intervals: when, which,
Adame, M. F., Connolly, R. M., Turschwell, M. P., Lovelock, C. E., Fatoyinbo, T., what? A practical guide for medical statisticians. Stat. Med. 19, 1141–1164. doi:
Lagomasino, D., et al. (2021). Future carbon emissions from global mangrove 10.1002/(SICI)1097-0258(20000515)19:93.0.CO;2-F
forest loss. Glob. Chang. Biol. 27, 2856–2866. doi: 10.1111/gcb.15571 Carvalho, A. C. O., Marins, R. V., Dias, F. J. S., Rezende, C. E., Lefèvre, N.,
Adame, M. F., Neil, D., Wright, S. F., and Lovelock, C. E. (2010). Sedimentation Cavalcante, M. S., et al. (2017). Air-sea CO2 fluxes for the Brazilian northeast
within and among mangrove forests along a gradient of geomorphological continental shelf in a climatic transition region. J. Mar. Syst. 173, 70–80. doi:
settings. Estuar. Coast. Shelf Sci. 86, 21–30. doi: 10.1016/j.ecss.2009.10.013 10.1016/j.jmarsys.2017.04.009
Alongi, D. M. (2014). Carbon cycling and storage in mangrove forests. Ann. Rev. Cotovicz, L. C., Knoppers, B. A., Deirmendjian, L., and Abril, G. (2019). Sources
Mar. Sci. 6, 195–219. doi: 10.1146/annurev-marine-010213-135020 and sinks of dissolved inorganic carbon in an urban tropical coastal bay revealed
Alongi, D. M. (2020). Global significance of mangrove blue carbon in climate by δ 13 C-DIC signals. Estuar. Coast. Shelf Sci. 220, 185–195. doi: 10.1016/j.ecss.
change mitigation. Science 2:67. doi: 10.3390/sci2030067 2019.02.048
Atwood, T. B., Connolly, R. M., Almahasheer, H., Carnell, P. E., Duarte, C. M., Cragg, S. M., Friess, D. A., Gillis, L. G., Trevathan-Tackett, S. M., Terrett, O. M.,
Ewers Lewis, C. J., et al. (2017). Global patterns in mangrove soil carbon stocks Watts, J. E. M., et al. (2020). Vascular plants are globally significant contributors
and losses. Nat. Clim. Chang. 7, 523–528. doi: 10.1038/nclimate3326 to marine carbon fluxes and sinks. Ann. Rev. Mar. Sci. 12, 16.1–16.29. doi:
Bivand, R., Keitt, T., and Rowlingson, B. (2020). R Package Rgdal: bindings For 10.1146/annurev-marine-010318-095333
The Geospatial Data Abstraction Library. 65. Available online at: https://cran. Diniz, C., Cortinhas, L., Nerino, G., Rodrigues, J., Sadeck, L., Adami, M., et al.
r-project.org/web/packages/rgdal/rgdal.pdf (accessed November 30, 2021). (2019). Brazilian mangrove status: Three decades of satellite data analysis.
Bukoski, J. J., Elwin, A., MacKenzie, R. A., Sharma, S., Purbopuspito, J., Kopania, Remote Sens. 11:808. doi: 10.3390/rs11070808
B., et al. (2020). The role of predictive model data in designing mangrove Estrada, G. C. D., Soares, M. L. G., Fernadez, V., and de Almeida, P. M. M.
forest carbon programs. Environ. Res. Lett. 15, 084019. doi: 10.1088/1748-9326/ (2015). The economic evaluation of carbon storage and sequestration as
ab7e4e ecosystem services of mangroves: A case study from southeastern Brazil. Int.
Frontiers in Forests and Global Change | www.frontiersin.org 9 January 2022 | Volume 4 | Article 787533Rovai et al. Brazilian Mangroves: Blue Carbon Hotspots
J. Biodivers. Sci. Ecosyst. Serv. Manag. 11, 29–35. doi: 10.1080/21513732.2014.96 mortality driven by belowground soil structural shifts during tidal hydrologic
3676 alteration. Estuar. Coast. Shelf Sci. 212, 51–62. doi: 10.1016/j.ecss.2018.06.026
Ferreira, A. C., and Lacerda, L. D. (2016). Degradation and conservation of Kusumaningtyas, M. A., Hutahaean, A. A., Fischer, H. W., Pérez-Mayo, M.,
Brazilian mangroves, status and perspectives. Ocean Coast. Manag. 125, 38–46. Ransby, D., and Jennerjahn, T. C. (2019). Variability in the organic carbon
doi: 10.1016/j.ocecoaman.2016.03.011 stocks, sources, and accumulation rates of Indonesian mangrove ecosystems.
Fox, J., and Weisberg, S. (2019). An {R} Companion to Applied Regression, 3rd Edn. Estuar. Coast. Shelf Sci. 218, 310–323. doi: 10.1016/j.ecss.2018.12.007
Thousand Oaks, CA: Sage. Lacerda, L. D., Ward, R. D., Godoy, M. D. P., Meireles, A. J., de, A., Borges, R.,
Gabler, C. A., Osland, M. J., Grace, J. B., Stagg, C. L., Day, R. H., Hartley, et al. (2021). 20-Years cumulative impact from shrimp farming on mangroves
S. B., et al. (2017). Macroclimatic change expected to transform coastal of northeast brazil. Front. For. Glob. Change 4:653096. doi: 10.3389/ffgc.2021.
wetland ecosystems this century. Nat. Clim. Chang 7, 142–147. doi: 10.1038/ 653096
NCLIMATE3203 Lewis, R. R. R., Milbrandt, E. C. E. C., Brown, B., Krauss, K. W. K. W. K. W.,
Goldberg, L., Lagomasino, D., Thomas, N., and Fatoyinbo, T. (2020). Global Rovai, A. S. A. S., Beever, J. W. J. W., et al. (2016). Stress in mangrove forests:
declines in human-driven mangrove loss. Glob. Chang. Biol. 26, 5844–5855. Early detection and preemptive rehabilitation are essential for future successful
doi: 10.1111/gcb.15275 worldwide mangrove forest management. Mar. Pollut. Bull. 109, 764–771. doi:
Hamilton, S. E., and Casey, D. (2016). Creation of a high spatio-temporal resolution 10.1016/j.marpolbul.2016.03.006
global database of continuous mangrove forest cover for the 21st century Lugo, A. E., Cintrón-Molero, G., and Goenaga, C. (1981). “Mangrove ecosystems
(CGMFC-21). Glob. Ecol. Biogeogr. 25, 729–738. doi: 10.1111/geb.12449 under stress,” in Stress Effects On Natural Systems, eds G. W. Barret and R.
Hamilton, S. E., and Friess, D. A. (2018). Global carbon stocks and potential Rosenberg (Chichester: John Wiley and Sons), 129–153.
emissions due to mangrove deforestation from 2000 to 2012. Nat. Clim. Chang. MacKenzie, R., Sharma, S., and Rovai, A. R. (2020). “Environmental drivers of
8, 240–244. doi: 10.1038/s41558-018-0090-4 blue carbon burial and soil carbon stocks in mangrove forests,” in Dynamic
Hamilton, S. E., Castellanos-Galindo, G. A., Millones-Mayer, M., and Chen, M. Eedimentary Environments Of Mangrove Coasts, eds F. Sidik and D. A.
(2018). “Remote sensing of mangrove forests: Current techniques and existing Friess (Amsterdam: Elsevier Inc), 275–294. doi: 10.1016/b978-0-12-816437-2.0
databases,” in Threats to Mangrove Forests, eds C. Makowski and C. W. Finkl 0006-9
(Cham: Springer), 497–520. doi: 10.1007/978-3-319-73016-5_22 Mangiafico, S. S. (2021). Rcompanion: Functions to Support Extension Education
Hatje, V., Masqué, P., Patire, V. F., Dórea, A., and Barros, F. (2021). Blue Program Evaluation. 2.4.1. New Brunswick, NJ: Rutgers Cooperative.
carbon stocks, accumulation rates, and associated spatial variability in Brazilian McLeod, E., Chmura, G. L., Bouillon, S., Salm, R., Björk, M., Duarte, C. M., et al.
mangroves. Limnol. Oceanogr. 66, 321–334. doi: 10.1002/lno.11607 (2011). A blueprint for blue carbon: toward an improved understanding of the
Hiederer, R., and Köchy, M. (2011). Global soil organic carbon estimates and the role of vegetated coastal habitats in sequestering CO2. Front. Ecol. Environ.
Harmonized World 20 Soil Database, JRC Scientific and Technical Reports, 9:552–560. doi: 10.1890/110004
68528/EUR 25225 EN. Ispra: Joint ResearchCentre. Moschetto, F. A., Ribeiro, R. B., and De Freitas, D. M. (2021). Urban expansion,
Hijmans, R. J. (2020). raster: Geographic Data Analysis and Modeling. R package. regeneration and socioenvironmental vulnerability in a mangrove ecosystem at
249. Available online at: https://cran.r-project.org/package=raster (accessed the southeast coastal of São Paulo, Brazil. Ocean Coast. Manag. 200:105418.
November 30, 2021). Pereira, R. H. M., and Goncalves, C. N. (2021). geobr: Download Official Spatial
Holling, C. S. (1973). Resilience and stability of ecological systems. Annu. Rev. Ecol. Data Sets of Brazil, 38. Available online at: https://cran.r-project.org/web/
Syst. 4, 1–23. doi: 10.1146/annurev.es.04.110173.000245 packages/geobr/geobr.pdf (accessed November 30, 2021).
Holmquist, J. R., Windham-Myers, L., Bliss, N., Crooks, S., Morris, J. T., Megonigal, R Core Team (2020). R: A Language And Environment For Statistical Computing.
J. P., et al. (2018). Accuracy and precision of tidal wetland soil carbon mapping Available online at: http://www.r-project.org/ (accessed November 30, 2021).
in the conterminous United States. Sci. Rep. 8:9478. doi: 10.1038/s41598-018- Rogers, K., Kelleway, J. J., Saintilan, N., Megonigal, J. P., Adams, J. B., Holmquist,
26948-7 J. R., et al. (2019). Wetland carbon storage controlled by millennial-scale
Hutchison, J., Manica, A., Swetnam, R., Balmford, A., and Spalding, M. (2014). variation in relative sea-level rise. Nature 567, 91–95. doi: 10.1038/s41586-019-
Predicting Global Patterns in Mangrove Forest Biomass. Conserv. Lett. 7, 0951-7
233–240. doi: 10.1111/conl.12060 Romero, L. M., Smith, T. J., and Fourqurean, J. W. (2005). Changes in mass and
IBGE (2019). Biomas e Sistema Costeiro-Marinho do Brasil: Compatível com a escala nutrient content of wood during decomposition in a south Florida mangrove
1:250.000 / IBGE, Coordenação de Recursos Naturais e Estudos Ambientais. Rio forest. J. Ecol. 93, 618–631. doi: 10.1111/j.1365-2745.2005.00970.x
de Janeiro: Instituto Brasileiro de Geografia e Estatística IBGE. Rovai, A. S., Twilley, R. R., Castañeda-Moya, E., Midway, S. R., Friess, D. A.,
IPCC (2014). 2013 Supplement to the 2006 IPCC guidelines for national greenhouse Trettin, C. C., et al. (2021b). Macroecological patterns of forest structure and
gas inventories: Wetlands. Geneva: IPCC. allometric scaling in mangrove forests. Glob. Ecol. Biogeogr. 30, 1000–1013.
Jardine, S. L., and Siikamäki, J. V. (2014). A global predictive model of carbon doi: 10.1111/geb.13268
in mangrove soils. Environ. Res. Lett. 9:104013. doi: 10.1088/1748-9326/9/10/ Rovai, A. S., Coelho, C., de Almeida, R., Cunha-Lignon, M., Menghini,
104013 R. P., Twilley, R. R., et al. (2021a). Ecosystem-level carbon stocks and
Jennerjahn, T. C. (2020). Relevance and magnitude of “Blue Carbon” storage in sequestration rates in mangroves in the Cananéia-Iguape lagoon estuarine
mangrove sediments: carbon accumulation rates vs. stocks, sources vs. sinks. system, southeastern Brazil. For. Ecol. Manage. 479:118553. doi: 10.1016/j.
Estuar. Coast. Shelf Sci. 247:107027. doi: 10.1016/j.ecss.2020.107027 foreco.2020.118553
Kauffman, B. J., Arifanti, V. B., Hernández Trejo, H., del Carmen, Jesús García, M., Rovai, A. S., Twilley, R. R., Castañeda-Moya, E., Riul, P., Cifuentes-Jara, M.,
Norfolk, J., et al. (2017). The jumbo carbon footprint of a shrimp: carbon losses Manrow-Villalobos, M., et al. (2018). Global controls on carbon storage
from mangrove deforestation. Front. Ecol. Environ. 15:183–188. doi: 10.1002/ in mangrove soils. Nat. Clim. Change 8, 534–538. doi: 10.1038/s41558-018-
fee.1482 0162-5
Kauffman, J. B., Adame, M. F., Arifanti, V. B., Schile-Beers, L. M., Bernardino, A. F., Saintilan, N., Khan, N. S., Ashe, E., Kelleway, J. J., Rogers, K., Woodroffe, C. D.,
Bhomia, R. K., et al. (2020). Total ecosystem carbon stocks of mangroves across et al. (2020). Thresholds of mangrove survival under rapid sea level rise. Science
broad global environmental and physical gradients. Ecol. Monogr. 90:e01405. 368, 1118–1121. doi: 10.1126/science.aba2656
doi: 10.1002/ecm.1405 Sanderman, J., Hengl, T., Fiske, G., Solvik, K., Adame, M. F., Benson, L., et al.
Kihara, Y., Dannoura, M., and Ohashi, M. (2021). Estimation of fine root (2018). A global map of mangrove forest soil carbon at 30 m spatial resolution.
production, mortality, and decomposition by using two core methods and Environ. Res. Lett. 13:055002. doi: 10.1088/1748-9326/aabe1c
litterbag experiments in a mangrove forest. Ecol. Res. doi: 10.1111/1440-1703. Sanders, C. J., Eyre, B. D., Santos, I. R., Machado, W., Luiz-silva, W., Smoak,
12275 J. M., et al. (2014). Elevated rates of organic carbon, nitrogen, and phosphorus
Krauss, K. W., Demopoulos, A. W. J., Cormier, N., From, A. S., McClain-Counts, accumulation in a highly impacted mangrove wetland. Geophys. Res. Lett. 41,
J. P., and Lewis, R. R. R. III (2018). Ghost forests of marco island: mangrove 2475–2480. doi: 10.1002/2014gl059789
Frontiers in Forests and Global Change | www.frontiersin.org 10 January 2022 | Volume 4 | Article 787533Rovai et al. Brazilian Mangroves: Blue Carbon Hotspots Sanders, C. J., Smoak, J. M., Naidu, A. S., and Patchineelam, S. R. (2008). Recent at the national scale. Biol. Lett. 14:20180251. doi: 10.1098/rsbl.201 sediment accumulation in a mangrove forest and Its relevance to local sea-level 8.0251 rise (Ilha Grande, Brazil). J. Coast. Res. 24, 533–536. doi: 10.2112/07-0872.1 Tang, W., Zheng, M., Zhao, X., Shi, J., Yang, J., and Trettin, C. (2018). Big Sanders, C. J., Smoak, J. M., Naidu, A. S., Sanders, L. M., and Patchineelam, S. R. geospatial data analytics for global mangrove biomass and carbon estimation. (2010b). Organic carbon burial in a mangrove forest, margin and intertidal mud Sustainability 10:472. doi: 10.3390/su10020472 flat. Estuar. Coast. Shelf Sci. 90, 168–172. doi: 10.1016/j.ecss.2010.08.013 Twilley, R. R., Rovai, A. S., and Riul, P. (2018). Coastal morphology explains global Sanders, C. J., Smoak, J. M., Sanders, L. M., Sathy Naidu, A., and Patchineelam, S. R. blue carbon distributions. Front. Ecol. Environ. 16:503–508. doi: 10.1002/fee. (2010c). Organic carbon accumulation in Brazilian mangal sediments. J. South 1937 Am. Earth Sci. 30, 189–192. doi: 10.1016/j.jsames.2010.10.001 Virgulino-Júnior, P. C. C., Carneiro, D. N., Nascimento, W. R., Cougo, M. F., and Sanders, C. J., Smoak, J. M., Naidu, A. S., Araripe, D. R., Sanders, L. M., and Fernandes, M. E. B. (2020). Biomass and carbon estimation for scrub mangrove Patchineelam, S. R. (2010a). Mangrove forest sedimentation and its reference forests and examination of their allometric associated uncertainties. PLoS One to sea level rise, Cananeia, Brazil. Environ. Earth Sci. 60, 1291–1301. doi: 10. 15:e0230008. doi: 10.1371/journal.pone.0230008 1007/s12665-009-0269-0 Wang, F., Sanders, C. J., Santos, I. R., Tang, J., Schurech, M., Kirwan, Santos, D. M. C., Estrada, G. C. D., Fernandez, V., Estevam, M. R. M., Souza, M. L., et al. (2020). Global blue carbon accumulation in tidal wetlands B. T., and Soares, M. L. G. (2017). First assessment of carbon stock in the increases with climate change. Natl. Sci. Rev. 8:nwaa296. doi: 10.1093/nsr/nw belowground biomass of brazilian mangroves. An. Acad. Bras. Cienc. 89, 1579– aa296 1589. doi: 10.1590/0001-3765201720160496 Worthington, T. A., Andradi-Brown, D. A., Bhargava, R., Buelow, C., Bunting, P., Sapkota, Y., and White, J. R. (2021). Long-term fate of rapidly eroding carbon stock Duncan, C., et al. (2020a). Harnessing big data to support the conservation soil profiles in coastal wetlands. Sci. Total Environ. 753:141913. doi: 10.1016/j. and rehabilitation of mangrove forests globally. One Earth 2, 429–443. doi: scitotenv.2020.141913 10.1016/j.oneear.2020.04.018 Sasmito, S. D., Taillardat, P., Clendenning, J. N., Cameron, C., Friess, D. A., Worthington, T. A., Ermgassen, P. S. E., Friess, D. A., Krauss, K. W., Lovelock, Murdiyarso, D., et al. (2019). Effect of land-use and land-cover change on C. E., Thorley, J., et al. (2020b). A global biophysical typology of mangroves mangrove blue carbon: a systematic review. Glob. Chang. Biol. 25, 4291–4302. and its relevance for ecosystem structure and deforestation. Sci. Rep. 10:14652. doi: 10.1111/gcb.14774 doi: 10.1038/s41598-020-71194-5 Schaeffer-Novelli, Y., Cintrón-Molero, G., Adaime, R. R., and Camargo, T. M. Xiong, Y., Cakir, R., Phan, S. M., Ola, A., Krauss, K. W., and Lovelock, C. E. (2019). (1990). Variability of mangrove ecosystems along the Brazilian coast. Estuaries Global patterns of tree stem growth and stand aboveground wood production in 13, 204–218. doi: 10.2307/1351590 mangrove forests. For. Ecol. Manage. 444, 382–392. doi: 10.1016/j.foreco.2019. Serrano, O., Lovelock, C. E., Atwood, T. B., Macreadie, P. I., Canto, R., Phinn, 04.045 S., et al. (2019). Australian vegetated coastal ecosystems as global hotspots for climate change mitigation. Nat. Commun. 10:4313. doi: 10.1038/s41467-019- Conflict of Interest: The authors declare that the research was conducted in the 12176-8 absence of any commercial or financial relationships that could be construed as a Simard, M., Fatoyinbo, L., Smetanka, C., Rivera-Monroy, V. H., Castañeda-Moya, potential conflict of interest. E., Thomas, N., et al. (2019). Mangrove canopy height globally related to precipitation, temperature and cyclone frequency. Nat. Geosci. 12, 40–45. doi: The reviewer SC declared a past collaboration with one of the authors TW to the 10.1038/s41561-018-0279-1 handling editor. Sippo, J. Z., Maher, D. T., Tait, D. R., Holloway, C., and Santos, I. R. (2016). Are mangroves drivers or buffers of coastal acidification? Insights from alkalinity The reviewer JB declared a past co-authorship with the authors to the and dissolved inorganic carbon export. Glob. Biogeochem. Cycles 30, 753–766. handling editor. doi: 10.1111/1462-2920.13280 Soares, M. L. G. (1999). Estrutura vegetal e grau de perturbação dos manguezais Publisher’s Note: All claims expressed in this article are solely those of the authors da Lagoa da Tijuca, Rio de Janeiro, RJ, Brasil. Rev. Bras. Biol. 59, 503–515. and do not necessarily represent those of their affiliated organizations, or those of doi: 10.1590/S0034-71081999000300016 the publisher, the editors and the reviewers. Any product that may be evaluated in Soares, M. L. G., Estrada, G. C. D., Fernandez, V., and Tognella, M. M. P. (2012). this article, or claim that may be made by its manufacturer, is not guaranteed or Southern limit of the Western South Atlantic mangroves: assessment of the endorsed by the publisher. potential effects of global warming from a biogeographical perspective. Estuar. Coast. Shelf Sci. 101, 44–53. doi: 10.1016/j.ecss.2012.02.018 Copyright © 2022 Rovai, Twilley, Worthington and Riul. This is an open-access Spawn, S. A., Sullivan, C. C., Lark, T. J., and Gibbs, H. K. (2020). Harmonized global article distributed under the terms of the Creative Commons Attribution License maps of above and belowground biomass carbon density in the year 2010. Sci. (CC BY). The use, distribution or reproduction in other forums is permitted, provided Data 7:112. doi: 10.1038/s41597-020-0444-4 the original author(s) and the copyright owner(s) are credited and that the original Taillardat, P., Friess, D. A., and Lupascu, M. (2018). Mangrove blue publication in this journal is cited, in accordance with accepted academic practice. No carbon strategies for climate change mitigation are most effective use, distribution or reproduction is permitted which does not comply with these terms. Frontiers in Forests and Global Change | www.frontiersin.org 11 January 2022 | Volume 4 | Article 787533
You can also read