BMO Conference 28 February 2022 Inspired people creating a premier global gold company - Evolution Mining
←
→
Page content transcription
If your browser does not render page correctly, please read the page content below
BMO Conference 28 February 2022 Inspired people creating a premier global gold company
FORWARD LOOKING STATEMENT

These materials prepared by Evolution Mining Limited (or “the Company”) include forward looking statements. Often, but not always, forward looking statements
can generally be identified by the use of forward looking words such as “may”, “will”, “expect”, “intend”, “plan”, “estimate”, “anticipate”, “continue”, and “guidance”,
or other similar words and may include, without limitation, statements regarding plans, strategies and objectives of management, anticipated production or
construction commencement dates and expected costs or production outputs.

Forward looking statements inherently involve known and unknown risks, uncertainties and other factors that may cause the Company’s actual results,
performance and achievements to differ materially from any future results, performance or achievements. Relevant factors may include, but are not limited to,
changes in commodity prices, foreign exchange fluctuations and general economic conditions, increased costs and demand for production inputs, the speculative
nature of exploration and project development, including the risks of obtaining necessary licenses and permits and diminishing quantities or grades of reserves,
political and social risks, changes to the regulatory framework within which the Company operates or may in the future operate, environmental conditions including
extreme weather conditions, recruitment and retention of personnel, industrial relations issues and litigation.

Forward looking statements are based on the Company and its management’s good faith assumptions relating to the financial, market, regulatory and other
relevant environments that will exist and affect the Company’s business and operations in the future. The Company does not give any assurance that the
assumptions on which forward looking statements are based will prove to be correct, or that the Company’s business or operations will not be affected in any
material manner by these or other factors not foreseen or foreseeable by the Company or management or beyond the Company’s control.

Although the Company attempts and has attempted to identify factors that would cause actual actions, events or results to differ materially from those disclosed in
forward looking statements, there may be other factors that could cause actual results, performance, achievements or events not to be as anticipated, estimated or
intended, and many events are beyond the reasonable control of the Company. Accordingly, readers are cautioned not to place undue reliance on forward looking
statements. Forward looking statements in these materials speak only at the date of issue. Subject to any continuing obligations under applicable law or any
relevant stock exchange listing rules, in providing this information the Company does not undertake any obligation to publicly update or revise any of the forward
looking statements or to advise of any change in events, conditions or circumstances on which any such statement is based.

This presentation has been approved for release by Evolution’s Board of Directors.

AUD:USD exchange rate assumption of 0.725 used throughout this presentation unless stated otherwise.

                                                                                                                                                                           2
EVOLUTION SNAPSHOT
MARKET CAPITALISATION 1                                          US$5.8B
PRO FORMA NET DEBT 2                                             US$906M
                                                                                                                                                                                          Red Lake
GOLD MINERAL RESOURCES 3                                         29.6Moz
GOLD ORE RESERVES 3                                              10.3Moz
FY22 PRODUCTION GUIDANCE                                         >670koz
FY22 AISC GUIDANCE                   4                           < US$865/oz
OPERATING ASSETS                                                 5
                                                                                                                             Ernest Henry
PORTFOLIO MINE LIFE                   5                          14+ years
                                                                 Van Eck
                                                                                                                                                                                         Mt Rawdon
                                                                 Australian Super
MAJOR SHAREHOLDERS
                                                                 BlackRock
                                                                 Fidelity
                                                                                                                             Mungari                                               Cowal

     1.   Based on share price of A$4.34 per share on 22 February 2022
     2.   Net debt as at 31 December 2021 adjusted for the initial payment to Glencore on 6 January 2022 to acquire Ernest Henry (US$580M)
     3.   See the announcement titled “Annual Mineral Resources and Ore Reserves Statement as at 31 December 2021” released to the ASX on 16 February 2022 for details on Mineral Resources and Ore Reserves
     4.   AISC is based on Gold price of US$1,600/oz (royalties) and Copper price of US$8,000/t (By-product credits)                                                                                           3
     5.   Portfolio mine life refers to a production weighted average of asset mine lives
CONSISTENT STRATEGY
                                                  Reserve Price Assumption (US$/oz)1,2

                                                                                                                                                            1,500

                                                                                                                                                                    1,500

                                                                                                                                                                            1,500
                                                                                                                                                  1,450
                                                                                                                                          1,350
                                                                                                                 1,300

                                                                                                                         1,300

                                                                                                                                  1,300
                                                                                                         1,270
                                                                                1,250

                                                                                        1,250

                                                                                                 1,250
                                                        1,200

                                                                1,200

                                                                        1,200
                                                1,160
 Proven team

                                        1,050
                  Quality and
                  margin over
                     quantity

                                                           2022 AISC Guidance (US$/oz)2,3
                  Act counter-
 Return on         cyclically to
 capital drives

                                                                                                                                                                            1,350
                                                                                                                                                                    1,325
                      improve

                                                                                                                                                          1,215
                                                                                                                                              1,180
                                                                                                                                     1,160
                                                                                                                          1,106
                                                                                                         1,080

                                                                                                                 1,080
                                                                                                1,060
 investment

                                                                                    1,050
                                                                           1,030
                      portfolio

                                                                  963
                                                        915
                                                < 865
                                    775
 decisions

                                   1.       Reserve price based on latest Mineral Resource and Ore Reserve statement available as at 21
                                            February 2022, rounded to the nearest US$5
                                   2.       AUD amounts converted to USD using an AUD/USD rate of 0.7250
                                   3.       Mid point of latest guidance for either FY22 or CY22 (whichever applies)                                                                4
STRONG FOUNDATIONS
TIER 1 JURISDICTIONS SUSTAINABILITY BALANCE SHEET
Australia and Canada are ‘Net Zero’ future commitment Investment grade credit rating
amongst the highest rated Shared value of health and Average debt maturity of over
countries based on the Fraser safety 6 years
Institute and World Bank Safeguard our social licence to Low interest cost with ~55%
metrics operate fixed at ~3%
Disciplined risk management 18 consecutive dividends
totaling US$724M
Evolution vs. peers World Bank Cumulative Dividends (US$M)
investment attractiveness1
‘Enviro’ category improved from 6 to 1
and ‘Social’ category improved from 8
to 2 (year-on-year)
91 88 86 684 724
77 73 71 531
67 65 60 59
40
29
333
216
5 15 31 63 124
FY13 FY14 FY15 FY16 FY17 FY18 FY19 FY20 FY21 FY22
H1
1. Investment attractiveness based on The World Bank’s Ease of Doing Business Index of the asset location, weighted according to 22E production of each asset from Wood Mackenzie estimates.
Peers include Newcrest, Newmont, Barrick, Kinross, IAMGOLD, Agnico Eagle, Gold Fields, Eldorado, New Gold, Yamana and AngloGold 5
IMPROVING THE QUALITY OF THE PORTFOLIO
                                       Accretive to shareholders
            Principles                  Improve portfolio quality
                                                                              4 cornerstone
                              Concentrated high quality portfolio of assets       assets
                                                                                 acquired

        Cowal            Red Lake       Ernest Henry         Mungari
                                                                               2 districts
                                                                              consolidated

                                                                               4 founding
                                                                                 assets
                                     Motivated seller                           divested

   Value                                Synergies
  Drivers                      Deep turnaround opportunity

                                    Geological upside
                                                                                            6
HIGH QUALITY CORNERSTONE ASSETS
                                                                                                              RETURNS GENERATED1                                   ORGANIC GROWTH

       Cowal                 Mine life at
                             acquisition
                                                    8
                                                                                                                                                                 230 – 250kozpa in FY22
                                                                                                                            16% pa                                growing to 350kozpa
                          Mine life now
                                                                                                                                                                        from FY24
                                                6.5                              19

                                                        Years owned              Remaining mine life

      Red Lake               Mine life at
                                                             13                                                                                                    ~200kozpa production
                             acquisition
                                                                                                                         Turnaround                                 rate from Q4 FY23
                          Mine life now     2                         18                                                  underway                                      growing to
                                                        Years owned               Remaining mine life                                                              ~350kozpa from FY26

 Ernest Henry                Mine life at
                                                        11
                             acquisition
                                                                                                                                                                      Mine life extension
                                                                                                                            27% pa
                          Mine life now         5                 6              5+                                                                                     beyond FY26
                                        Years owned               Remaining mine life   Extension potential

      Mungari                Mine life at
                             acquisition
                                                6
                                                                                                                                                                  Mill expansion to enable
                                                                                                                            13% pa                                 +200kozpa from end
                           Mine life now        6.5                     12
                                                                                                                                                                           FY25
                                                        Years owned              Remaining mine life

 1.    Average annual return on acquisition cost. Mungari excludes the Kundana asset acquisition completed in August 2021. Ernest Henry excludes the acquisition of full ownership completed in January 2022   7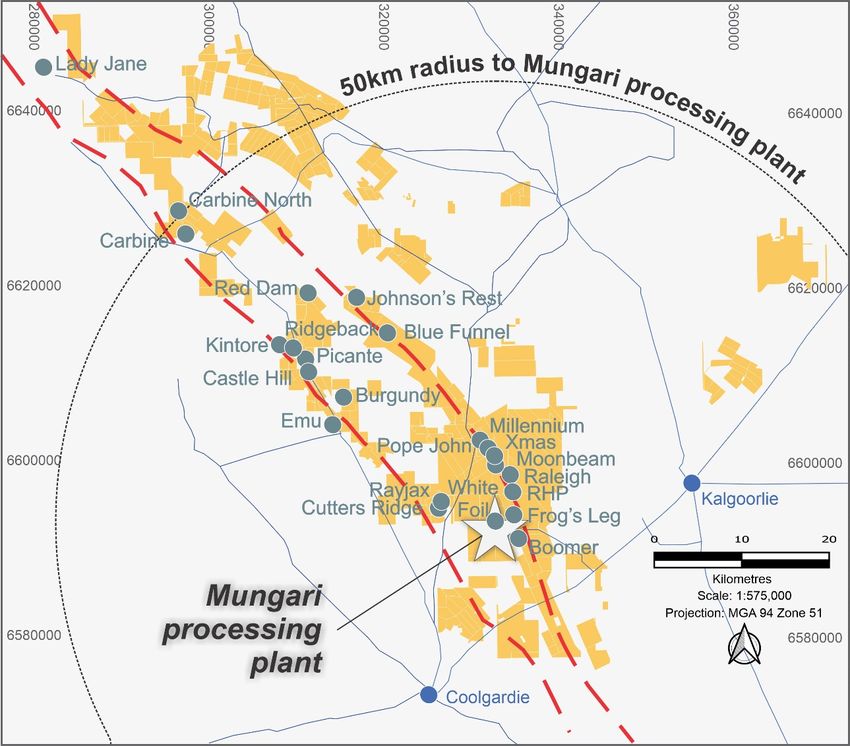
MATERIAL MINE LIFE
EXTENSIONS AT COWAL

                                                  Acquisition                 December
                                                   July 2015                    2021

 Total acquisition cost                             US$550M

 Ore Reserves                                        1.6Moz                     4.6Moz1

 Mineral Resources                                   3.4Moz                     9.6Moz1

 Mine life                                               2024                     2040

 Plant capacity                                      7.2Mtpa                   ~9.0Mtpa

 Gold production                                                                1.6Moz

 Operating cash flow                                                          US$1.25B

 Net mine cash flow2                                                          US$570M

1.   Mineral Resources and Ore Reserves estimate at 31 December 2021. See the Appendix of this
     presentation for details on Mineral Resources and Ore Reserves
2.   Post all capital and exploration                                                            8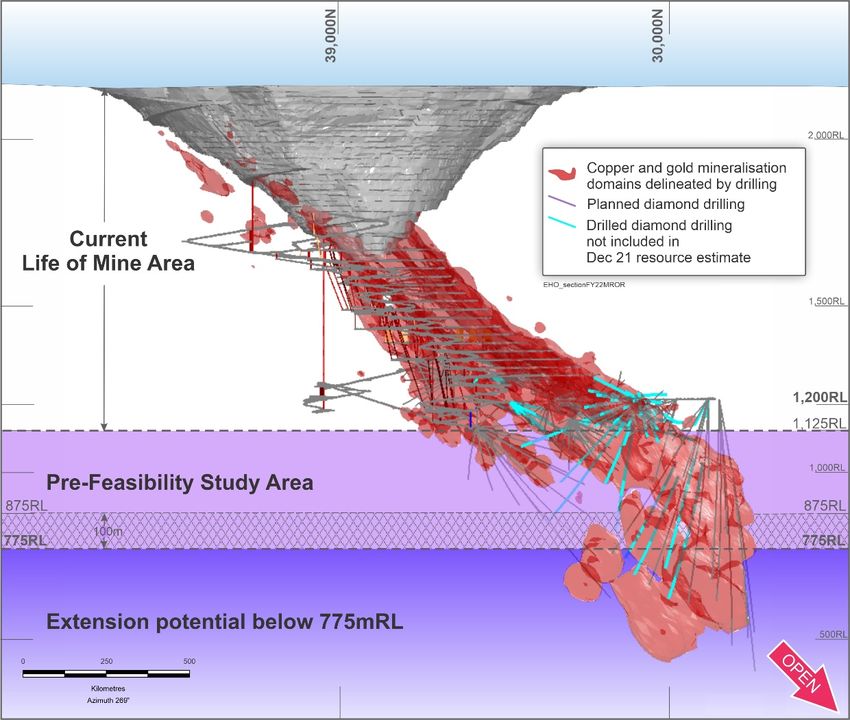
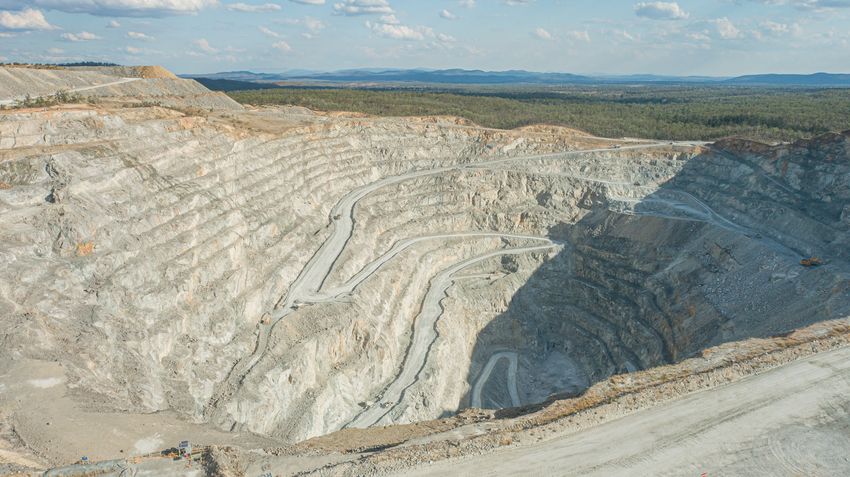
COWAL ORGANIC GROWTH OPPORTUNITIES
FUTURE OPPORTUNITIES
350kozpa from
230 – 250kozpa in FY22
FY24
Higher grade from Stage H post cutback
completion
US$275M to develop the Underground mine
Government approvals received
Development on budget and schedule
First stoping ore H2 FY23
Feasibility study underway on new open pits
adjacent to E42
9
FULL OWNERSHIP OF ERNEST HENRY IS A
GAME CHANGER
                                                                                                                                  Copper Production (Cu kt)

                                                                                                                                                                                          ~60

  November                       ~5 years                          January
                                                                                                                                                                        38
    2016                                                             2022
                                                                                                                                                                        34
  US$650M                         Over                                                                          21                 21                18
 Acquisition of                US$900M of                       US$725M to
                                                                                                              FY19A              FY20A              FY21A             FY22PF            FY23PF
  Economic                      net mine                        acquire full
   Interest1                    cash flow                       ownership1
                                                                                                                                Operating Cash Flow (US$M)2

 Annual copper production increases to 60,000t                                                                                                                                            ~470
                                                                                                                                                                       ~385

                                                                                                                                                                                          ~360
              Material lift in cash flow                                                                                                                               ~300

           12% decrease in Group AISC/oz                                                                       168                194                234

                                                                                                              FY19A              FY20A              FY21A             FY22PF            FY23PF

      1.   Original economic interest comprised 100% of gold and 30% of copper production within an agreed Life of Asset (LOA) area, and 49% of gold and copper production below the LOA area. Full
           ownership now comprises 100% of all gold and copper production from Ernest Henry. See ASX releases ‘EVN Secures Full Ownership of Ernest Henry’ dated 17 November 2021 and ‘“Full Ownership
           of Ernest Henry – Acquisition Completed” dated 6 January 2022 at www.evolutionmining.com.au
      2.   Base scenario based on Evolution’s planning assumptions of A$2,200/oz (~US$1,600) for Gold and A$11,000/t (~US$8,000/t) for Copper. Upside scenario based on spot price of A$2,520/oz
           (~US$1,825/oz) for Gold and A$13,300/t (~US$9,650/t) for Copper                                                                                                                             10
EXCELLENT POTENTIAL FOR FURTHER GROWTH
AT ERNEST HENRY
Pre-feasibility Study (PFS) on a mine extension
beyond FY26 underway – due for completion end of
calendar year 2022
Glencore concept study cut off at the 875mRL
Evolution PFS considers a larger mine area down
to the 775mRL
Further growth opportunity with mineralisation
intersected 300m vertically below the PFS area and
open at depth
North-south section looking east of the Ernest Henry orebody
11CREATING A NEW FUTURE FOR RED LAKE
200kozpa
milestone Campbell mill operating at ≥2,000tpd
by Q4 Red Lake mill operating at 1,000tpd
350kozpa goal FY23 Addition of Bateman mill provides 2Mtpa of site processing capacity
from FY26
Currently the bottleneck
~12Moz Mineral Resource
Resources
~3Moz Ore Reserve at 7.0g/t gold
& Opportunity for further additions
Reserves
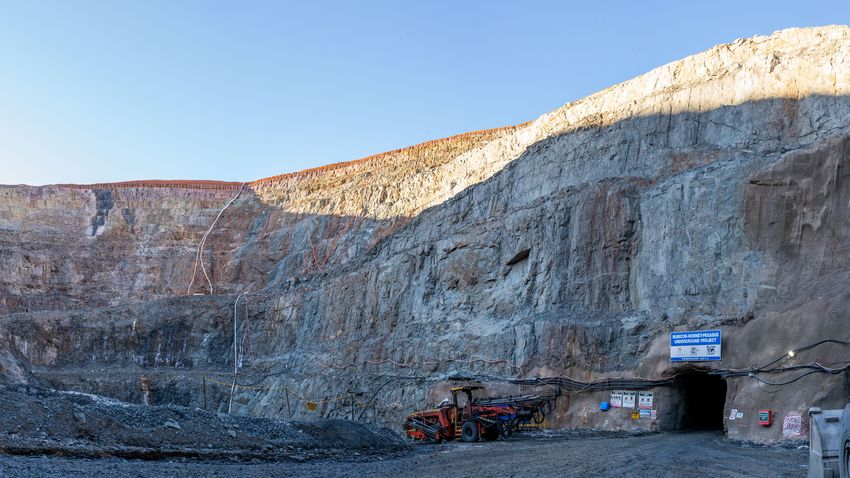
12RED LAKE MINING TRANSFORMATION
Mining Consistently mine 3,000 safe tonnes per day By June 2022
Mining Development rates consistently above 1,200m per month
Infrastructure New locomotives to transport ore from Cochenour
Mining Access new mining fronts at Aviation and MMTP End Q2 FY23
Mining Complete CYD surface decline into Upper Campbell End Q3 FY23
FY22 provides a platform to deliver material improvements in FY23 and beyond
13MUNGARI ELEVATED TO A CORNERSTONE ASSET
August December
2015 2021
Mungari acquisition US$260M
(August 2021)
Kundana asset acquisition
US$290M
Ore Reserves 0.7Moz 1.2Moz1
Mineral Resources 1.8Moz 4.9Moz1
Mine life 2021 2033
Plant capacity 1.5Mtpa ~2.0Mtpa
Gold production 838koz
Operating cash flow US$489M
Net mine cash flow2 US$214M
1. Mineral Resources and Ore Reserves estimate at 31 December 2021. See the Appendix of this presentation for details on Mineral Resources and Ore Reserves
2. Post all capital and exploration
14FIRST TIME THE DISTRICT IS UNDER ONE OWNER
Significant ~5Moz Mineral Resource and
1.2Moz Ore Reserve
District consolidation along the highly
prospective Zuleika shear zone
Potential for further extensions at Kundana
and East Kundana
Plant expansion a key enabler to maximise
value from the resource base
Provides pathway to a 12+ year mine life and
annual gold production of 200kozpa
US$6.5M committed to deliver a Feasibility
Study by December 2022
Plan showing extent of Mineral Resources in the Mungari region
15HIDDEN OPTION AT MT RAWDON
Mining operations to continue for two years,
followed by processing of stockpiles
Opportunity to convert site into pumped hydro
power station post mine life
Up to 2GW of generation capacity for 10 hours
Favourable location due to topography, existing
open pit and proximity to transmission
infrastructure
Transmission network stability benefits
Planned commissioning in 2028 to align with
planned retirement of State owned coal fired
power stations
16DARING
DARINGTO
TOBE
BEDIFFERENT
DIFFERENT
PORTFOLIO
TRANSFORMED
STRONG MARGINS AND
BALANCE SHEET
HIGH-QUALITY
RESOURCES &
RESERVES
STRONG FOCUS ON
DELIVERY
17APPENDIX
SUSTAINABILITY PRINCIPLES
 The objective of our sustainability efforts is to deliver long-term stakeholder value through
 safe, low-cost gold production in an environmentally and socially responsible manner

 Be an employer of choice      Demonstrate robust risk   Contribute positively to     Actively manage climate        Protect and enhance our
 attracting the most           management and safety     local, regional and          related risks and              reputation as a trusted
 talented people and foster    leadership                national sustainability      opportunities including        partner and provide
 a safe, diverse and                                     efforts by achieving an      improving energy efficiency    community benefits that
 inclusive workplace                                     outstanding level of         and the responsible            endure beyond the life of
                                                         environmental                management of water            our mines
                                                         stewardship

      Advance the outcomes for         Respect the human rights     Be transparent at all levels of     Relentlessly drive for
      indigenous peoples and           of all our stakeholders      Corporate Governance,               operational excellence
      protect their Cultural                                        comply with applicable laws         through an innovative
      Heritage                                                      and regulations and operate at      culture and inspired
                                                                    the highest standards of            people delivering to plan
                                                                    financial and ethical behaviour

                              OUR VALUES:     SAFETY      EXCELLENCE         ACCOUNTABILITY           RESPECT                                    19
FY22 GUIDANCE AND THREE-YEAR OUTLOOK
Evolution Group FY22 FY23 FY24
830 915
725
Gold Production 855
(koz) 670 775
~60 ~60
Copper 38
Production (kt)1
34
865 760
690
AISC2
825 720
(US$/Gold oz) 650
Sustaining
110 – 125 110 – 140 115 – 145
Capex (US$/M)3
Major Capital
320 – 365 385 – 435 235 – 285
(US$M)3
(1) Ernest Henry only. Excludes copper production in FY22 from Mt Carlton
(2) AISC is based on Gold price of ~US$1,600/oz (royalties) and Copper price of ~US$8,000/t (By-product credits)
(3) Corporate capital of $2.5 million (Sustaining) and $1.5 million (Major) not included above
For information on Production Targets and Forecast Financials, refer to the ASX releases entitled “Evolution Secures Full Ownership of Ernest Henry” dated 17 November 2021 and available to view at www.evolutionmining.com.au. The Company
confirms that all material assumptions underpinning the Production Target and Forecast Financial information derived from the Production Target in the 17 November 2021 releases continue to apply and have not materially changed
20CAPITAL OUTLOOK SUSTAINING CAPITAL (US$)
Cowal $30 – 35M per year
Red Lake $40 – 50M (FY22); $45 – 60M (FY23 & FY24)
Ernest Henry $25 – 35M (FY22), $30 – 40M (FY23 & FY24)
Sustaining Capital
(US$M)
MAJOR CAPITAL (US$)
Cowal FY22 FY23 FY24
110 - 125 115 - 145
Underground $105 – 115M1 $170 – 180M $25 – 30M2
77 110 - 140
Integrated Waste Landform $55 – 60M $35 – 40M $20 – 25M
FY21A FY22 FY23 FY24
Open Pits Feasibility Study $10 – 15M
Red Lake
Major Capital Existing Mining Operations $35 – 40M $35 – 40M $40 – 45M
(US$M)
Upper Campbell $25 – 30M $50 – 55M $40 – 45M
McFinley $20 – 25M $25 – 30M $10 – 15M
Campbell Mill Expansion $10 – 15M $15 – 20M
320 - 365 385 - 435
199 235 - 285 Bateman Mill Expansion3 $10 – 15M $30 – 35M
Mungari
FY21A FY22 FY23 FY24
Mine development $15 – 20M $15 - 20M
Plant expansion $60 – 65M
Ernest Henry
1. Includes $10-15M for completion of Galway Decline Mine extension $10 - 15M $35 – 45M $35 – 45M
2. Mine capital development post-commissioning
3. Includes water treatment project of $10-15M
For information on Production Targets and Forecast Financials, refer to the ASX releases entitled “Evolution Secures Full Ownership of Ernest Henry” dated 17 November 2021 and available to view at www.evolutionmining.com.au. The
Company confirms that all material assumptions underpinning the Production Target and Forecast Financial information derived from the Production Target in the 17 November 2021 releases continue to apply and have not materially changed 21EVOLUTION 2021 GOLD MINERAL RESOURCES
Gold Measured Indicated Inferred Total Resource
Gold Gold Gold Gold Gold Gold Gold Gold
Tonnes Tonnes Tonnes Tonnes CP5
Project Type Cut-Off Grade Metal Grade Metal Grade Metal Grade Metal
(Mt) (Mt) (Mt) (Mt)
(g/t) (koz) (g/t) (koz) (g/t) (koz) (g/t) (koz)
Cowal1 Open pit 0.35 24.8 0.46 367 207.5 0.83 5,555 37.3 0.78 929 269.6 0.79 6,852 1
Cowal Underground 1.50 - - - 22.4 2.47 1,776 13.3 2.32 991 35.7 2.41 2,766 1
Cowal1 Total 24.8 0.46 367 229.9 0.99 7,331 50.6 1.18 1,920 305.3 0.98 9,618 1
Red Lake Underground 3.30 0.0 4.20 4 29.7 7.30 6,973 18.7 6.66 4,013 48.5 7.05 10,990 2
Bateman Underground 2.50 - - - 2.1 4.93 335 3.0 4.37 422 5.1 4.60 757 2
Red Lake3 Total 0.0 4.20 4 31.8 7.14 7,303 21.7 6.34 4,435 53.6 6.82 11,742 2
Mungari1 Open pit 0.40 - - - 44.3 1.18 1,676 10.5 1.36 458 54.8 1.21 2,134 3
Mungari4 Underground 1.80 1.7 5.39 295 10.1 4.26 1,387 9.4 3.58 1,086 21.2 4.05 2,767 3
Mungari1 Total 1.7 5.39 295 54.4 1.75 3,063 19.9 2.41 1,544 76.1 2.00 4,902 3
Mt Rawdon1 Total 0.21 6.3 0.32 65 27.2 0.55 481 5.7 0.46 84 39.2 0.50 630 4
Ernest Henry2 Total 13.3 0.69 294 32.2 0.78 808 25.9 0.69 572 71.4 0.73 1,674 5
Marsden Total 0.20 - - - 119.8 0.27 1,031 3.1 0.22 22 123.0 0.27 1,053 1
Total 46.1 0.69 1,025 495.5 1.26 20,017 127.0 2.10 8,577 668.5 1.38 29,619
Data is reported to significant figures to reflect appropriate precision and may not sum precisely due to rounding.
Mineral Resources are reported inclusive of Ore Reserves.
1. Includes stockpiles
2. Ernest Henry Operations reported Mineral Resources are above a 0.7% Cu cut-off within an interpreted 0.7% Cu mineralised envelope.
3. Red Lake Mineral Resource cut-off is 3.3g/t Au except for Cochenour (3.0g/t Au) and HG Young (3.2g/t Au) deposit
4. Mungari Underground Mineral Resource cut-offs vary from 1.56g/t Au to 2.61g/t Au per deposit. The average underground cut-off is1.8g/t Au. The Mungari Mineral Resource estimate excludes the Falcon deposit (142koz) held by the East Kundana Joint Venture (Evolution Mining 51%,
Tribune Resources Ltd 36.75% and Rand Mining (12.25%). Information on the Falcon deposit is provided in Northern Star Resources ASX release titled “Strong Growth in Reserves and Resources” dated 3 May 2021 and available to view at www.nsrltd.com
5. Group Gold Mineral Resources Competent Person (CP) Notes refer to 1. James Biggam; 2. Jason Krauss; 3. Brad Daddow; 4. Justin Watson; 5. Aaron Meakin (CSA Global)
This information is extracted from the release titled ‘Annual Mineral Resources and Ore Reserves Statement’ dated 16 February 2022 and available to view at www.evolutionmining.com.au. The Company confirms that it is not aware of any new information or data that materially affects the
information included in the release and that all material assumptions and parameters underpinning the estimates in the release continue to apply and have not materially changed. The Company confirms that the form and context in which the Competent Persons’ findings are presented have
not been materially modified from the Reports.
22EVOLUTION 2021 GOLD ORE RESERVES
Gold Proved Probable Total Reserve
Competent
Tonnes Gold Gold Metal Tonnes Gold Grade Gold Metal Tonnes Gold Gold Metal Person6
Project Type Cut-Off
(Mt) Grade (g/t) (koz) (Mt) (g/t) (koz) (Mt) Grade (g/t) (koz)
Cowal1 Open pit 0.45 23.9 0.46 356 99.7 0.99 3,164 123.6 0.89 3,520 1
Cowal Underground 1.80 - - - 14.4 2.31 1,069 14.4 2.31 1,069 2
Cowal Total 23.9 0.46 356 114.1 1.15 4,233 138.0 1.03 4,589
Red Lake3 Total 4.50 - - - 13.1 7.00 2,935 13.1 7.00 2,935 3
Mungari4 Underground 4.82 0.8 4.89 132 2.6 4.33 365 3.5 4.46 498 4
Mungari1,5 Open pit 0.73 3.0 1.54 149 14.2 1.29 587 17.2 1.33 736 5
Mungari1 Total 3.9 2.27 282 16.8 1.76 952 20.6 1.86 1,234
Mt Rawdon1 Open pit 0.33 3.1 0.39 40 12.6 0.64 260 15.7 0.59 300 6
Ernest Henry2 Underground 9.8 0.77 241 19.2 0.35 217 29.0 0.49 459 7
Marsden Open pit 0.30 - - - 65.2 0.39 817 65.2 0.39 817 8
Total 40.7 0.70 919 241.0 1.22 9,414 281.7 1.14 10,333
Data is reported to significant figures to reflect appropriate precision and may not sum precisely due to rounding
1. Includes stockpiles
2. Ernest Henry Operations reported Ore Reserve uses Glencore price assumptions: Gold Price ($US/oz): 1300, Copper Price ($US/t): 6500, Exchange Rate (AU:US): 0.75. December 2021 Ore Reserves reported above 0.7% Cu
3. Red Lake Ore Reserve cut-off is 4.5g/t Au except for Cochenour and Lower Campbell (4.1g/t Au), HG Young (3.0g/t Au) and Upper Campbell (2.5g/t Au)
4. Mungari Underground Ore Reserve cut-off is 4.82g/t Au except for Kundana (4.08g/t Au) and Frog’s Leg (2.90g/t Au)
5. Mungari Open Pit Ore Reserve cut-offs vary from 0.61g/t Au to 0.80g/t Au per deposit. The average open pit cut-off is 0.73g/t Au
6.Group Gold Ore Reserve Competent Person (CP) Notes refer to 1. Dean Basile (Mining One); 2. Joshua Northfield; 3. Brad Armstrong; 4. Peter Merry; 5. Chris Honey; 6. Martin Sonogan; 7. Mike Corbett (Glencore); 8. Anton Kruger
This information is extracted from the release titled ‘Annual Mineral Resources and Ore Reserves Statement’ dated 16 February 2022 and available to view at www.evolutionmining.com.au. The Company confirms that it is not aware of any new information or data that materially affects the
information included in the release and that all material assumptions and parameters underpinning the estimates in the release continue to apply and have not materially changed. The Company confirms that the form and context in which the Competent Persons’ findings are presented
have not been materially modified from the Reports.
23EVOLUTION 2021 COPPER RESERVES & RESOURCES
Group Copper Mineral Resource Statement
Copper Measured Indicated Inferred Total Resource
Copper Copper Copper Copper CP1
Tonnes Copper Tonnes Copper Tonnes Copper Tonnes Copper
Project Type Cut-Off Metal Metal Metal Metal
(Mt) Grade (%) (Mt) Grade (%) (Mt) Grade (%) (Mt) Grade (%)
(kt) (kt) (kt) (kt)
Marsden Total 0.2 - - - 119.8 0.46 553 3.1 0.24 7 123.0 0.46 560 1
Ernest Henry Total 0.7 13.3 1.25 165 32.2 1.29 416 25.9 1.17 304 71.4 1.24 885 2
Total 13.3 1.25 165 152.1 0.64 969 29.0 1.07 311 194.4 0.74 1,445
Data is reported to significant figures to reflect appropriate precision and may not sum precisely due to rounding. Mineral Resources are reported inclusive of Ore Reserves
1. Group Mineral Resources Competent Person (CP) Notes refer to: 1. James Biggam; 2. Aaron Meakin (CSA)
Group Copper Ore Reserve Statement
Copper Proved Probable Total Reserve
Competent
Tonnes Copper Copper Tonnes Copper Copper Tonnes Copper Copper Person2
Project Type Cut-Off
(Mt) Grade (%) Metal (kt) (Mt) Grade (%) Metal (kt) (Mt) Grade (%) Metal (kt)
Marsden Total 0.3 - - - 65.2 0.57 371 65.2 0.57 371 1
Ernest Henry1 Total 0.7 9.8 1.41 139 19.2 0.68 130 29.0 0.93 269 2
Total 9.8 1.41 139 84.4 0.59 501 94.2 0.68 640
Data is reported to significant figures to reflect appropriate precision and may not sum precisely due to rounding
1. Ernest Henry Operations reported Ore Reserve uses Glencore price assumptions: Gold Price ($US/oz): 1300, Copper Price ($US/t): 6500, Exchange Rate (AU:US): 0.75
2. Group Ore Reserve Competent Person (CP) Notes refer to: 1. Anton Kruger; 2. Mike Corbett (Glencore)
Note on the Ernest Henry December 2020 comparison: Prior to acquisition of full ownership of Ernest Henry (effective as of 1 January 2022), Evolution Mining had an economic interest earning rights to 100% of the revenue from future gold production and 30% of future
copper and silver produced from an agreed life of mine area, and 49% of future gold, copper and silver produced from the Ernest Henry Resource outside the agreed area. The December 2020 Ernest Henry Reserve is reported here on the basis of economic interest
and not the entire mine reserve. The reported December 2020 figures constitute 38% of the total Ernest Henry copper resource and 35% of the total Ernest Henry copper reserve.
This information is extracted from the release titled ‘Annual Mineral Resources and Ore Reserves Statement’ dated 16 February 2022 and available to view at www.evolutionmining.com.au. The Company confirms that it is not aware of any new information or data that
materially affects the information included in the release and that all material assumptions and parameters underpinning the estimates in the release continue to apply and have not materially changed. The Company confirms that the form and context in which the
Competent Persons’ findings are presented have not been materially modified from the Reports.
24You can also read