Blockchain mechanism and distributional characteristics of cryptos
←
→
Page content transcription
If your browser does not render page correctly, please read the page content below
Blockchain mechanism and distributional characteristics of
                                                                   cryptos ∗

                                                      Min-Bin Lin†              Kainat Khowaja‡                Cathy Yi-Hsuan Chen§
arXiv:2011.13240v2 [cs.CR] 24 Aug 2021

                                                                                   Wolfgang Karl Härdle¶

                                                                                             Abstract
                                                   We investigate the relationship between underlying blockchain mechanism of cryptocurren-
                                               cies and its distributional characteristics. In addition to price, we emphasise on using actual
                                               block size and block time as the operational features of cryptos. We use distributional charac-
                                               teristics such as fourier power spectrum, moments, quantiles, global we optimums, as well as
                                               the measures for long term dependencies, risk and noise to summarise the information from
                                               crypto time series. With the hypothesis that the blockchain structure explains the distribu-
                                               tional characteristics of cryptos, we use characteristic based spectral clustering to cluster the
                                               selected cryptos into five groups. We scrutinise these clusters and find that indeed, the clus-
                                               ters of cryptos share similar mechanism such as origin of fork, difficulty adjustment frequency,
                                               and the nature of block size. This paper provides crypto creators and users with a better un-
                                               derstanding toward the connection between the blockchain protocol design and distributional
                                               characteristics of cryptos.
                                               Keywords:        Cryptocurrency, price, blockchain mechanism, distributional characteristics,
                                               clustering
                                               JEL Classification: C00

                                             ∗ Financial support of the European Union’s Horizon 2020 research and innovation program “FIN- TECH: A Finan-

                                         cial supervision and Technology compliance training programme” under the grant agreement No 825215 (Topic: ICT-
                                         35-2018, Type of action: CSA), the European Cooperation in Science & Technology COST Action grant CA19130 -
                                         Fintech and Artificial Intelligence in Finance - Towards a transparent financial industry, the Deutsche Forschungs-
                                         gemeinschaft’s IRTG 1792 grant, the Yushan Scholar Program of Taiwan and the Czech Science Foundation’s grant
                                         no. 19-28231X / CAS: XDA 23020303 are greatly acknowledged.
                                             † International Research Training Group 1792, Humboldt-Universität zu Berlin, Spandauer Str. 1, 10178 Berlin,

                                         Germany. Email: min-bin.lin@hu-berlin.de
                                             ‡ International Research Training Group 1792, Humboldt-Universität zu Berlin, Spandauer Str. 1, 10178 Berlin,

                                         Germany. Email: kainat.khowaja@hu-berlin.de
                                             § Adam Smith Business School, University of Glasgow, United Kingdom; IRTG 1792 High Dimensional Non

                                         Stationary Time Series, Humboldt-Universität zu Berlin. Email: cathyyi-hsuan.chen@glasgow.ac.uk
                                            ¶ BRC Blockchain Research Center, Humboldt-Universität zu Berlin, Berlin, Germany; Sim Kee Boon Institute,

                                         Singapore Management University, Singapore; WISE Wang Yanan Institute for Studies in Economics, Xiamen Uni-
                                         versity, Xiamen, China; Dept. Information Science and Finance, National Chiao Tung University, Hsinchu, Taiwan,
                                         ROC; Dept. Mathematics and Physics, Charles University, Prague, Czech Republic, Grants–DFG IRTG 1792 grate-
                                         fully acknowledged. Email: haerdle@hu-berlin.de

                                                                                                 1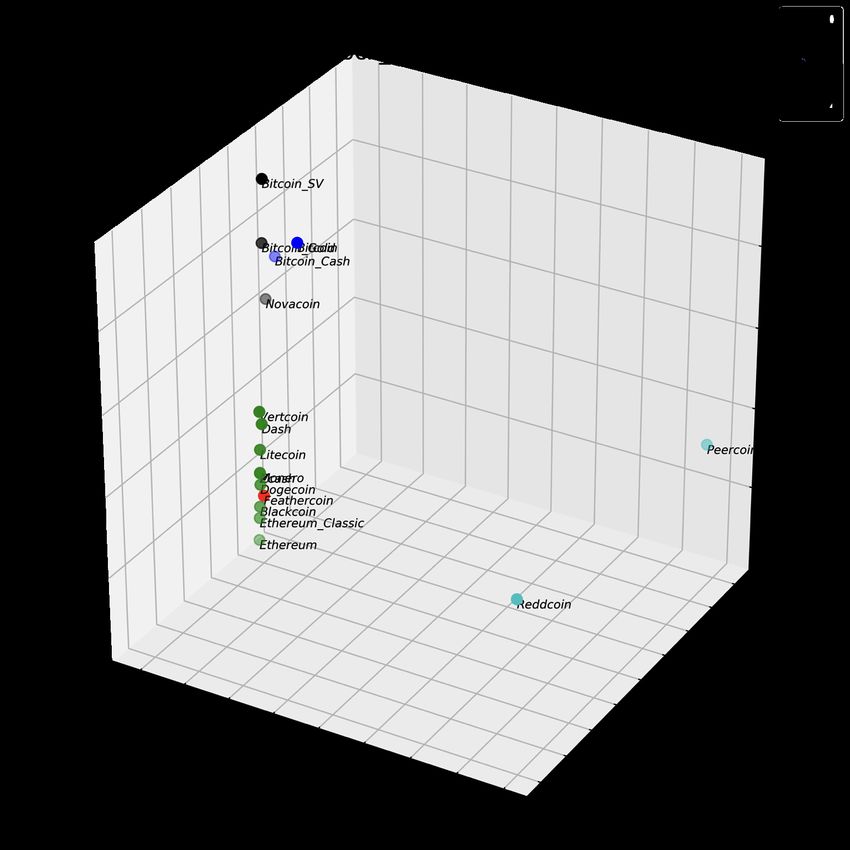
1     Introduction

Cryptocurrency (crypto) is a digital asset designed to be as a medium of exchange wherein individual

coin ownership is recorded in a digital ledger or computerised database. Its creation of monetary

units and verification of fund transactions are secured using encryption techniques and distributed

across several nodes (devices) on a peer-to-peer network. Such technology-enhanced and privacy-

preserving features make it potentially different to other existing financial instruments and has

attracted attention of many investors and researchers (Härdle et al., 2020). Many studies have

investigated the similarity between a pool of cryptocurrencies in order to classify the important

features of digital currencies. For example, Blau et al. (2020) has concluded that the top sixteen

most active cryptocurrencies co-move with bitcoin. Researchers have also focused on describing the

price behaviour of cryptos using economic factors (Ciaian et al., 2016; Sovbetov, 2018). However,

owing to the unique technology of cryptocurrencies, there still exists a gap between the creators of

blockchain mechanism and users operating the financial market of the crytocurrencies and through

this research, we aim to take a step towards mitigating that gap.

    We specialise our research on the following research questions. First, we characterise crypto

behaviour using distributional characteristics of time series data. Also, instead of using the prices

alone, we use actual block time and block size to incorporate the operational features of cryp-

tos. Second, we hypothesise that the blockchain structure that the coin attaches plays a pivotal

role in explaining the behaviour. More explicitly, we investigate the extent to which blockchain

structure leads to explain the distributional characteristics. Using a characteristic based clustering

coupled with spectral clustering technique, we group the selected cryptos into a number of clusters

and stratify the mechanisms that make the coins within the particular cluster showing the same

behaviour in price, actual block time, and actual block size, respectively.

    When studying cryptocurrencies, many researchers only focus on crypto price and daily returns

(Trimborn and Härdle, 2018; Hou et al., 2020). While price is important when cryptos are used

as a medium of payment, it is definitely not the only measure for evaluation of cryptocurrencies.

For example, many low price coins are highly traded and many coins that are not used as medium

                                                  2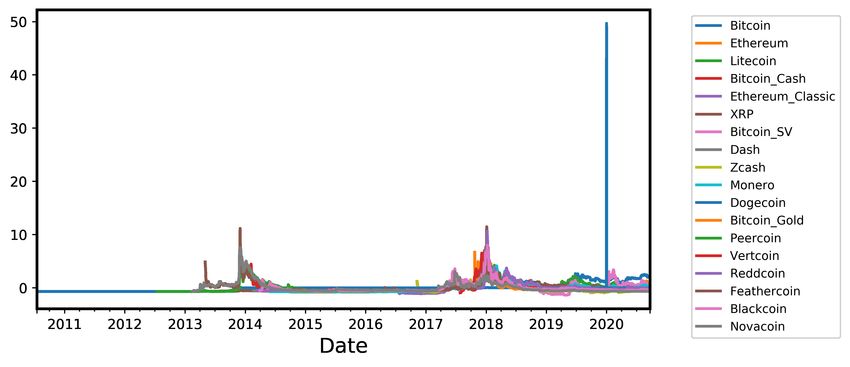
of payment have low prices, e.g., XPR and Dogecoin. Cryptos were introduced to serve various

purposes and the purpose of the coin does matter. This makes it necessary to use other time series

while studying crypto markets. In this research, we propose to use actual block size and actual

block time alongside price.

      Actual block size is the average actual size ”usage” of a single block in data storage for one

day. Since a block comprises of transaction data, it can represent the status of how a blockchain

mechanism allocates transactions to a block. We consider it a measure of scalability of the system. A

well-functioning blockchain should be able to level the transaction arrivals. Transaction distribution

within a day for any crypto needs such balancing because it affects miners rewards and hence the

demand of the coin. An ideal block size would keep confirmation times from ballooning while

keeping fees and security reasonable. Therefore, actual block size of cryptos can provide insight

into the behaviour of cryptos.

      Actual block time, on the other hand, measures the consistency and performance of the system.

It is defined as the mean time required in minutes for each day to create the next block. In other

words, it is the average amount of time for the day a user has to wait, after broadcasting their

transaction, to see this transaction appear on the blockchain. Think of crypto markets as a fast

food franchise and miners as customers who have to wait a certain time to make the purchase. If

the waiting time is shorter on certain days while on other instances, the customers have to wait

much longer, there is a discrepancy in the system. Analogously, the time series of block time, which

is the distribution of waiting time, can be seen as a service level of the whole system and it is

necessary to maintain as the users’ expectation or target block time set by the system depend on

it.

      The idea of investigating the underlying blockchain mechanism, a cornerstone of crypto technol-

ogy, and its connection to the crypto behaviour is still in its infancy. One of the first endeavours in

explaining this relationship was made by Guo et al. (2018) who highlight that the the fundamental

characteristics of cryptocurrencies (e.g., algorithm and proof type) have a vital role in differen-

tiating the performance of cryptocurrencies. They develop a spectral clustering methodology to

                                                   3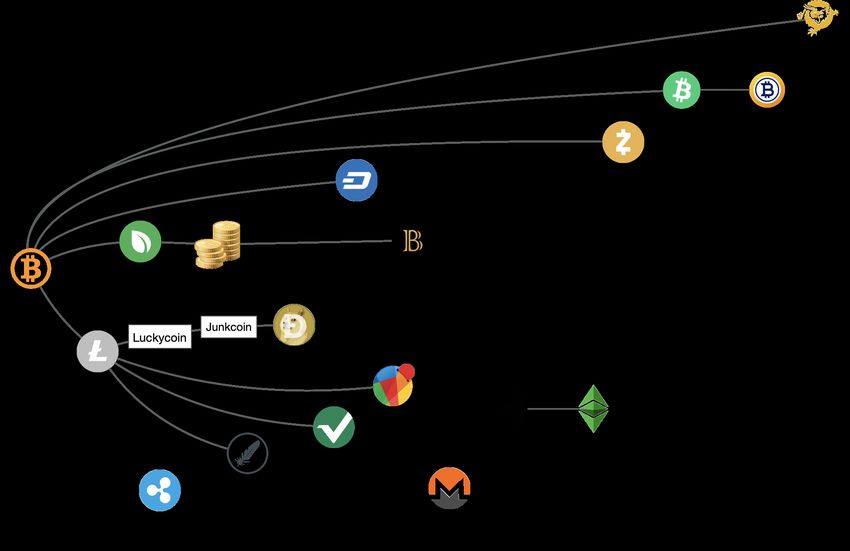
group cryptos in a dynamic fashion, but their research is limited in the exploitation of blockchain

characteristics. With a similar spirit, Iwamura et al. (2019) start by claiming that high fluctuation

is a reflection of the lack of flexibility in the Bitcoin supply schedule. They further strengthen their

arguments by considering the predetermined algorithm of cryptos (specifically, the proof of work)

to explain the volatility in cryptocurrency market. Zimmerman (2020) argue in their work that the

higher congestion in blockchain technology leads to higher volatility in crypto prices. They claim

that the limited settlement space in blockchain architecture makes users compete with one another,

affecting the demand. In his model, the value of cryptos is governed by its demand, making the

price sensitive to blockchain capacity.

   These research results, albeit true, are limited to a particular set of cryptocurrency mechanism

and do not thoroughly explain the dynamics of cryptocurrencies. Also, most of the papers only

use price as a proxy of behaviour. We advance the previous findings by incorporating a rich set

of underlying mechanisms and connecting them to multiple time series. We take a deep dive into

eighteen cryptos with a variety of mechanisms- concluded in Garriga et al. (2020))- from a technical

perspective to summarise their mechanism and algorithm designs using variables, such as consensus

algorithm, type of hashing algorithm, difficulty adjustment frequency and so on.

   We investigate a relationship between underlying blockchain mechanism of cryptocurrencies

and the distributional characteristics. Using the a characteristic-based clustering technique, we

cluster the selected coins into a number of clusters and scrutinise the compositions of fundamental

characteristics in each group. We observe that the clusters obtained from these time series indeed

share common underlying mechanism. Through empirical evidence, we show that the cryptos forked

from same origin and same consensus mechanism tend to become part of same clustering group.

Furthermore, the clusters obtained by the time series of block time have same hashing algorithms

and difficulty adjustment algorithms. Also, a similar nature (static or dynamic) of block size was

observed within clusters obtained by the time series of actual block size. We conclude with empirical

evidence that the crypto behaviour is actually linked with their blockchain protocol architectures.

   The implications of this study are abundant. The creators of cryptocurrencies can manage the

                                                   4
impact of blockchain underlying mechanisms on the corresponding distributional characteristics, in
a consideration of adoption rate of invented coins. From the users’ perspective, they can make an
optimal decision in which coins should be adopted while concerning the price fluctuation.
This paper proceeds as follows. Section 2 discusses data source and the underlying mechanisms
of the cryptos. Section 3 presents the methodology used for classifying characteristics of time series
and clustering algorithm. Section 4 provides an illustration of analysis results. Section 5 concludes
and provides several avenues for future research.
2 Data Source and Description
According to CoinMarketCap (https://coinmarketcap.com), currently there are over 7,000 cryp-
tocurrencies and their total market capitalisation has surpassed USD$400 billion as of November
09, 2020. Most of studies have focused on the mainstream coins (e.g., Bitcoin, Ethereum), and
little has been investigated on the coins which have been introduced and featured with a diverse
blockchain mechanisms and invented technologies. The work of Guo and Donev (2020) is one of
exceptions. In this study, 18 cryptos with different set of blockchain mechanisms have been ex-
amined –Bitcoin, Bitcoin Cash, Bitcoin Gold, Bitcoin SV, Blackcoin, Dash, Dogecoin, Ethereum,
Ethereum Classic, Feathercoin, Litecoin, Monero, Novacoin, Peercoin, Reddcoin, Vertcoin, XRP
(Ripple), and Zcash. We explore an interplay between distributional characteristics of crpytos and
blockchain mechanism. We discuss the key characteristics of blockchain mechanisms and the time
series data in this section.
2.1 Underlying Mechanism
Most of cryptos nowadays apply blockchain-based systems in which transactions are grouped into
blocks and cryptographically interlinked to form a back-linked list of blocks containing transactions.
The transactions are validated using the nodes within the crypto peer-to-peer network through
a majority consensus directed by algorithms instead of a central authority’s approval. In such
an operation process, many algorithmic mechanisms are required to govern the performance and
5outcome of a crypto system. Some key blockchain-based characteristics are discussed below:
Fork: It occurs as user base or developers conduct a fundamental or significant software change,
see as in Figure 1. There are two types of forks – soft and hard forks. The former is an update
to the protocol architecture and then all the nodes are enforced to follow in order to proceed with
the operations of a crypto. The latter one creates a duplicate copy of the origin blockchain and
modifies the copy to meet the desired quality (e.g., safety, scalability). In this case, a new crypto
can be generated accordingly. For example, Peercoin network facilitates an alternative consensus
mechanism –proof-of-stake (PoS) to Bitcoin’s proof-of-work (PoW) system for reducing dependency
on energy consumption from mining process (King and Nadal, 2012).
Going beyond a digital currency, Ethereum establishes an open-ended decentralised platform
for diverse applications such as decentralised applications (dapps) and smart contracts (Buterin,
2014).
Consensus mechanism: In order to establish an agreement on a specific subset of the candi-
date transactions, consensus mechanism provides a protocol for a large number of trust-less nodes
in a decentralised blockchain network. For instance, PoW (Proof-of-Work, as adopted by e.g.,
Bitcoin, Litecoin) achieves consensus with a competition among miners on solving computational
puzzles, which consume numerous computational resources; and PoS (Proof-of-Stake, as adopted by
e.g., Peercoin, Blackcoin) randomly assigns a block creator (transaction validator) with probability
proportional to their coins staked.
Hashing algorithm: It is a mathematical algorithm that encrypts a new transaction (or a new
block) into a fixed length character string, known as hash value, and later interlinks this string with
a given blockchain to ensure the security and immutability of a crypto. Various hashing algorithms
are implemented in cryptos such as SHA-256, Scrypt and Equihash. These provide different degree
of complexity to blockchain operations.
Difficulty adjustment algorithm: It is an adaptive mechanism which periodically adjusts the
difficulty toward hashrate to target an average time interval between blocks, known as target block
6Figure 1: Blockchain software forks in cryptocurrency.
time or target confirmation time. It regulates the creation rate of a block and maintains a certain
amount of outputs of a blockchain. Such a mechanism is commonly seen in a PoW framework.
An example from Bitcoin is shown in Figure 2 where its difficulty adjustment algorithm, known as
DAA, modifies the difficulty every 2016 blocks to meet target block time of 10 minutes.
2.2 Time Series Data
The data applied in this paper are collected from Bitinfocharts which is available at https://bitinfocharts.com/.
These time series are composed of data points observed daily from the genesis date of each crypto.
The lengths of these time series are thus varied coin by coin, but as explained in the section 2.2,
we continue to use the whole time series for each coin.
Price: Much previous literature has been triggered by the substantial fluctuations in crypto
7Figure 2: Bitcoin’s difficulty adjustment toward actual block time. Blockchain mechanism -
plotting
prices. In this study we investigate 18 crypto prices in USD on daily time series. Among these
18 cryptos, Bitcoin has been dominant and Reddcoin has the lowest price on balance as seen in
Figure 3. We characterise these price time series in Table 1. Most of these coins (i.e., Bitcoin,
Ethereum, Bitcoin Cash) have high fluctuations in price; while some coins (i.e., XRP, Blackcoin)
tends to be steady.
Figure 3: Time series of prices of the 18 cryptos Blockchain mechanism plotting
8Actual block time: It is the mean time required in minutes for each day to create the next
block. In other words, it is the average amount of time for the day a user has to wait, after
broadcasting their transaction, to see this transaction appear on the blockchain. Some literature
also refers it as confirmation time. It can be considered as a service level indicator for cryptos which
should be maintained by underlying mechanisms. Most of the coins discussed in this paper tend to
have lower block time compared with Bitcoin as seen in Figure 4. Also, many coins show outliers
in observations and this can indicate that the extreme events appear in the blockchain system.
The underlying mechanisms can be ineffective to accommodate the current system demand. The
distributional characteristics for time series of actual block time are presented in Table 2. The data
for XRP are missing but its designed block time is around 5 second per transaction.
Figure 4: Actual block time in minutes. Blockchain mechanism plotting
9Actual block size: It is defined as the average actual size ”usage” of a single block in data
storage for one day. Since a block is is comprised of transaction data, it can represent the status
of how a cryptocurrency mechanism allocates transactions to a block. In this study, as introduced
in Section 1, we consider it as an indicator for the stableness of scalability of a crypto. In Figure 5
shows that most of the cryptos under study have smaller block size usage than Bitcoin, except
Bitcoin SV. The plot also depicts that almost all the coins have outliers. These outliers can lead
to the imbalance in transaction fee and reward which can influence the ecosystem of a crypto. The
characteristics for block size time series are shown in Table 3. XRP does not have typical blockchain
structure, hence, there is no block size data in the study. The data for Peercoin are missing.
Figure 5: Actual block size in megabytes. Blockchain mechanism plotting
103 Methodology
In order to investigate the relationship between underlying blockchain mechanism of cryptocur-
rencies and the distributional characteristics of cryptos as a proxy of behaviour, we aim to group
them into number of clusters and scrutinise the compositions of features in each group. These
blockchain-based features manifest the underlying mechanism of how the cryptos operate trans-
actions on their chains, and subsequently govern the price, actual block size and block time. As
described in the previous section, we use the time series data of 18 different cryptos with a range
of different mechanisms.
The time series data available for the cryptos is subject to numerous limitations. The most
important one of them is that different coins were introduced at different time points, therefore,
the data available for each coin has different lengths. For the clustering problems (Aghabozorgi
et al., 2015), defining the distance metric between points in time series with various lengths is not
conventional. For many analytical problems, this issue is easily tackled by truncating the time series
to the shared sample period. We refrain from doing so because, in the analysis of cryptocurrency
prices, the evolution of the data in time is highly crucial for an investigation in the short term
and long term dynamics and therefore, truncating the time series would lead to loss of important
information. Hence, we deal with the time series data of cryptos with different lengths and do not
directly impose a distance metric on the input data points.
Furthermore, characterising the behaviour of a time series in terms of a single quantitative
attribute (such as range based volatility) has its own limitations. The chosen attribute usually
captures the dynamics of time series in one particular aspect, which may not be sufficient to
encompass an entire behaviour or introduces a biased assessment. This becomes particularly true
in the problems of crypto classification and clustering where these attributes, used as a similarity
measure, are very diverse, resulting in weak robustness in the results.
To cope with these limitations, we resort to the characteristic based clustering method proposed
by Wang et al. (2005). It was recently applied by Pele et al. (2020) for classifying cryptos in order to
11distinguish them from traditional assets. This methods recommends to incorporate various global
measures describing the structural characteristics of a time series for a clustering problem. These
global measures are obtained by applying statistical operations that best represent the underlying
characteristics. Also, by extracting a set of measures from the original time series we simply bypass
the issue of defining a distance metric. It’s understood that the global measures are domain-
specific. Employing a greedy search algorithm, Wang et al. (2005) selects the pivotal features in
the clustering tasks. In our case, we import the experts’ discretion on the choice of features as
distributional characteristics which best represent the dynamics of cryptocurrencies.
We choose a variety of measures for our analysis. Starting from the first four moments and
quantiles that characterises the distribution and symmetry of the data, we include the statistics
for concluding the global structure such as global optimum, as well as the measures for long term
dependencies, risk and noise. The selected features are mean, standard deviation, skewness, kur-
tosis, maximum, minimum, first quartile, median, third quartile, 1% and 5% extreme quantiles
as a measure of downside risk, linear trend, intercept, autocorrelation for long term dependency,
self-similarity using Hurst exponent and chaos using Lyaponav’s exponents.
We further extend the methodology by including the power spectrum of time series as an addi-
tional measure. The power spectrum is obtained in this work using Fast Fourier Transform (FFT).
For computational ease, discrete fourier transform (DFT) has been formalised as a linear operator
that maps the data points in a discrete input signal X {x1 , x2 , · · · , xn } to the frequency domain
f = {f1 , f2 , · · · fn }.
For a given time series X of n time points, sine and cosine functions are used to get the
coefficients ωn = e−2πi /η and the frequencies are calculated using the matrix multiplication:
12
f1 1 1 1 ··· 1 x1
f2
1 ωn ωn2 ··· ωnn−1
x2
2(n−1)
f3 = 1 ωn2 ωn4 ··· ωn x3 (1)
.. .. .. .. .. .. ..
.
. . . . .
.
(n−1)2
2(n−1)
fn 1 ωnn−1 ωn ··· ωn xn
This matrix multiplication involves O(n2 ) and makes DFT computationally expensive. FFT is
a fast algorithm to compute DFT using only O(n log n) operations (Brunton and Kutz, 2019). A
simple fft command in python computes the FFT of the given time signal. The power spectrum of
this signal is the normalised squared magnitude of the f and it indicates how much variance of the
initial space each frequency explains (Brunton and Kutz, 2019). Including the power spectrum as
a feature for characteristic based clustering allows capturing the variability in the time signal that
is not explained by any other measure.
Accumulating all the aforementioned features in a vector gives in a reduced dimensional rep-
resentation of time series of each crypto. These vectors are then used to cluster the cryptos into
groups using spectral clustering. Spectral clustering exploits the eigenvalues of similarity matrix
to cluster and results in more balanced clusters than other techniques that were employed during
the process. For details related to spectral clustering, the readers are recommended to follow the
tutorial on spectral clustering by von Luxburg (2006). The results of the above methodology are
discussed in detail in the next section.
4 Empirical Evidence
In this section, we showcase the result from the characteristic based clustering individually on the
crypto price and operational features–which are constructed with price, block size ”scalability” and
block time ”service level” time series. We explore the clustering results and classify them with the
underlying mechanisms of the investigated 18 cryptos. The 18 cryptos are: Bitcoin, Bitcoin Cash,
Bitcoin Gold, Bitcoin SV, Blackcoin , Dash, Dogecoin, Ethereum, Ethereum Classic, Feathercoin,
13Litecoin, Monero, Novacoin, Peercoin, Reddcoin, Vertcoin, XRP, and Zcash.
We calculate the characteristics for each of these cryptos for prices, block size and block time
separately. The results of all other attributes except the FFT are summarised in Tables 1, 2, 3
correspondingly in Appendix. Note that the data for XRP are not available for the block size and
block time, and for Peercoin block size is missing as described before in Section 3.
After calculating the attributes and FFT power spectrum described in section 2.2, the feature
space is 216 dimensional (200 dimensional vector of power spectrum and 16 characteristics), vi-
sualisation of which is not possible. We project the feature space into a three dimensional space
using principle component analysis (PCA), and the results of which are exhibited for an intuitive
understanding. We discuss each of the clustering in detail below. Moreover, in order to avoid a
monopoly outcome and sustain a certain level of interpretability, we impose the maximum number
of the clusters to avoid a single coin case in each cluster.
4.1 Clustering with crypto prices
Table 1 shows that as expected, Bitcoin has the highest average price and highest standard deviation,
due to high magnitude of its prices. The VaR99 and VaR95 for Bitcoin are, however, very low,
showing a low downside risk of Bitcoin. On the contrary, Bitcoin Cash, Bitcoin SV, Bitcoin Gold and
Zcash all show high value at risk. This could be due to low persistence of risk shocks (de Souza,
2019; Katsiampa et al., 2019). The high positive coefficients of self similarity for all the coins
show high dependency on the previous time values. The high autocorrelation further confirms the
presence of long term dependencies of the time series. The Lyaponov exponent as a measure of
chaos is greater than 0 for all the time series which shows unstable dynamics throughout the prices
of cryptos.
The characteristics of Dogecoin in Table 1 assume very low values, unlike any other coin, because
the prices of Dogecoin are very low, despite it being a popular coin. This can be due to high supply
of the coin with no limit on the total number of coins created. The coin also has no technical
innovations, which is considered as one of the reasons why the coin has such small price. Hence,
14the uncontrolled underlying mechanism of the coin has significant impact on the prices, despite the
high trading volumes of the coin. Same can be concluded for XRP and Reddcoin, which also have
a very high maximum supply that is reflected in their very low prices.
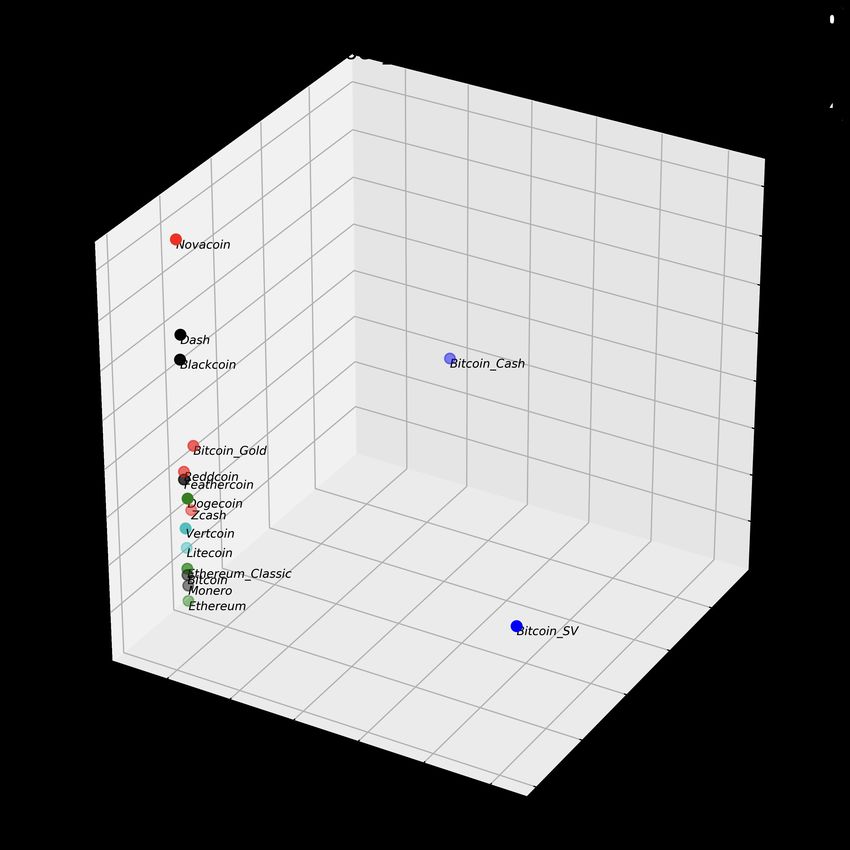
Using characteristic based clustering on price time series, we have the result with 5 clusters as
below:
0. Bitcoin, Dash
1. Bitcoin SV, Zcash
2. Bitcoin Cash, Bitcoin Gold
3. Ethereum, Litecoin, XRP, Monero, Peercoin, Vertcoin, Reddcoin, Feathercoin, Blackcoin
4. Ethereum Classic, Dogecoin, Novacoin
Most of coins are close to each others in a three-dimensional space, as seen in Figure 6. Except
Dash, all the altcoins are in a different clusters than Bitcoin. Bitcoin Cash and Bitcoin Gold, which
principally inherit the protocol architecture from Bitcoin, are clustered together, but not centred
around with other coins. However, Bitcoin SV–which is a fork from Bitcoin Cash and mainly
increases the designed block size to lower the transaction fee as a main software change–is not in
the same cluster. This indicates that even as a crypto adopts a similar blockchain mechanism with
the other crypto, it might have different price dynamics than its origin.
XRP, Monero, Peercoin, Reddcoin, and Blackcoin which apply significantly different blockchain
protocols in their governance types and consensus mechanisms are in the same cluster. Specifically,
XRP, Monero and Peercoin are private based blockchain which possesses a stronger moderator
to control the entrants (users or investors) to their network. Peercoin, Reddcoin, and Blackcoin,
instead of using PoW as their consensus mechanisms, employ PoS which does not depends on miners’
effort to create a block. So that, coin supply and demand can reach an equilibrium without the
interference of miners, which leads to higher transaction costs. Moreover, the forks from Litecoin–
Vertcoin, Reddcoin and Feathercoin are within the same cluster with Litecoin.
15Figure 6: Visualisation of five clusters 0, 1, 2, 3, 4 of cryptos based on the prices Blockchain -
mechanism clustering
Ethereum Classic is, in fact, the version of Ethereum that existed before the hard fork of
Ethereum resulting after the DAO attack, but it is not within the cluster with Ethereum.
4.2 Clustering with actual block time
The block time here is measured in minutes. Likewise, we apply the characteristic based clustering
on the data and conclude them into 5 clusters as below.
0. Dogecoin, Feathercoin
161. Ethereum, Litecoin, Ethereum Classic, Dash, Zcash, Monero, Blackcoin
2. Bitcoin, Bitcoin Cash, Vertcoin
3. Bitcoin SV, Bitcoin Gold, Novacoin
4. Peercoin, Reddcoin
The result is correspondingly visualised in Figure 4. The figure shows that Peercoin and Redd-
coin lie far away from other coins (marked by cyan cluster). They are clustered in the same group
because they both use PoS and their initial block takes the maximum time to be added, as shown
by the maximum and intercept characteristics in Table 2. This shows that even though the coins
have lower actual block time later (with low mean), their behaviour is still the similar, resulting
them in the same cluster. Also, the cryptos using PoS tend to lower the complexity of their hashing
algorithms since it is not required for miners to spend computational effort on them. The difficulty
adjustment algorithms of theirs are purely used as a mechanism for maintaining the certain service
level for users without considering hashrate from miners. Their block time performance is relatively
stable after the initialisation. Here we emphasise that the initial price, block time and block size
that are usually characterised by the underlying mechanism play a pivotal role in determining the
price behaviour of cryptos. This is why we did not truncate the time series, as mentioned in the
Section 4.
Though Bitcoin, Bitcoin Gold, Bitcoin Cash and Bitcoin SV are not completely grouped into
the same cluster, they are close to each others in the three dimensional space as seen in Figure 4.
They apply the same hashing algorithm–SHA-256 and also with the same expected block time for
their difficulty adjustment algorithms. Let’s call attention to forks again. Dogecoin and Feathercoin
are both forked from Litecoin with the Script-based hashing algorithm and difficulty adjustment
frequency after large number of blocks–240 and 504 blocks. Litecoin is in a different cluster because
the frequency is much higher as 2016 blocks. Given the cryptos forked from the same origin coins,
their block time can be found in the same group, likewise Ethereum and Ethereum Classic.
17Figure 7: Visualisation of five clusters 0, 1, 2, 3, 4 of cryptos based on block time Blockchain -
mechanism clustering
4.3 Clustering with actual block size
As previously done for price and block time, we use the characteristics based clustering and grouped
these cryptos into 5 clusters according to the characteristics of their time series. The block size
here is measured in bytes for a better data representation. As stated before in Section 3, XRP
and Peercoin data are missing due to the mechanism design and incomplete data from the source,
respectively. The clustering result is shown as below and the corresponding visualisation is in
Figure 5.
180. Zcash, Bitcoin Gold, Reddcoin, Novacoin
1. Ethereum, Ethereum Classic, Dogecoin
2. Bitcoin Cash, Bitcoin SV
3. Bitcoin, Dash, Monero, Feathercoin
4. Litecoin, Vertcoin, Blackcoin
Figure 8: Visualisation of five clusters 0, 1, 2, 3, 4 of cryptos based on block size Blockchain -
mechanism clustering
The actual block size (usage) of these cryptos does rarely meet their designed block size limit
19(capacity), except for Bitcoin that it nearly outstretches its limit, 1 megabyte, as seen in Table 3.
In this case, it raises an issue: Can increasing crypto’s block size limit improves scalability? For
example, Bitcoin SV enlarges dramatically its limit to 128 megabytes but it is out of the necessity for
such a design. Likewise, Bitcoin Cash, which Bitcoin SV forks from, has its limit as 32 megabytes.
These two coins are, therefore, clustered together. Moreover, instead of having a static block size
limit, Ethereum and Ethereum Classic grouped in the same cluster apply block gas limit, which is
the energy consumption limit for a block, to adaptively regulate its block size. Both Monero and
Blackcoin have a dynamic mechanisms to control the block size, however, it does not represent in
the clustering result.
5 Conclusion
In this paper we investigate the relationship between crypto behaviours and their underlying mech-
anisms. We specify the crypto behaviour with their price and operational features defined by actual
block time and block size. We calculate the distributional characteristics to define the behaviour of
time series. Using a characteristics based spectral clustering technique, we cluster the selected coins
into a number of clusters and scrutinise the blockchain mechanism in each group. We find that the
underlying mechanism of cryptos are reflected in the clustering results. We observe that cryptos
forked from same origin and same consensus mechanism tend to become part of same clustering
group. Furthermore, the clusters obtained by the time series of block time have same hashing al-
gorithms and difficulty adjustment algorithms. Also, a similar nature (static or dynamic) of block
size was observed within clusters obtained by the time series of actual block size. We conclude
with empirical evidence that the crypto behaviour is indeed linked with their blockchain protocol
architectures. As a result, cryptocurrency users and investors can have a better understanding and
explanation of price and operational features through cryptocurrency mechanism. In the future re-
search, we would elaborate the relation of price and operational features to underlying mechanism
with an economic model and conduct relevant simulations. We would also like to investigate the
impact of versions revisions on the dynamics of cryptos.
20References
S. Aghabozorgi, A. S. Shirkhorshidi, and T. Y. Wah. Time-series clustering–a decade review.
Information Systems, 53:16–38, 2015.
B. Blau, T. Griffith, and R. Whitby. Comovement in the Cryptocurrency Market. Economics
Bulletin, 40(1):448–455, 2020.
S. L. Brunton and J. N. Kutz. Data-Driven Science and Engineering: Machine Learning, Dynamical
Systems, and Control. Cambridge University Press, 2019. doi: 10.1017/9781108380690.
V. Buterin. A next-generation smart contract and decentralized application platform. white paper,
2014.
P. Ciaian, M. Rajcaniova, and d’Artis Kancs. The economics of bitcoin price formation. Applied
Economics, 48(19):1799–1815, 2016. doi: 10.1080/00036846.2015.1109038.
M. de Souza. Var and persistence of risk shocks in cryptocurrencies market. The Empirical Eco-
nomics Letters, 18:1–12, 04 2019.
M. Garriga, S. Dalla Palma, M. Arias, A. Derenzis, R. Pareschi, and D. Tamburri. Blockchain
and cryptocurrencies: A classification and comparison of architecture drivers. Concurrency and
Computation Practice and Experience, 10 2020. doi: 10.1002/cpe.5992.
L. Guo, Y. Tao, and W. Härdle. Understanding latent group structure of cryptocurrencies market:
A dynamic network perspective. SSRN Electronic Journal, 01 2018. doi: 10.2139/ssrn.3658206.
X. Guo and P. Donev. Bibliometrics and network analysis of cryptocurrency research. Journal of
Systems Science and Complexity, pages 1–26, 2020.
A. J. Hou, W. Wang, C. Y. H. Chen, and W. K. Härdle. Pricing Cryptocurrency Options*.
Journal of Financial Econometrics, 18(2):250–279, 05 2020. ISSN 1479-8409. doi: 10.1093/
jjfinec/nbaa006. URL https://doi.org/10.1093/jjfinec/nbaa006.
W. K. Härdle, C. R. Harvey, and R. C. G. Reule. Understanding Cryptocurrencies*. Journal of
21Financial Econometrics, 18(2):181–208, 02 2020. ISSN 1479-8409. doi: 10.1093/jjfinec/nbz033.
URL https://doi.org/10.1093/jjfinec/nbz033.
M. Iwamura, Y. Kitamura, T. Matsumoto, and K. Saito. Can we stabilize the price of a cryp-
tocurrency?: Understanding the design of bitcoin and its potential to compete with central bank
money. Hitotsubashi Journal of Economics, 60(1):41–60, 2019.
P. Katsiampa, S. Corbet, and B. Lucey. High frequency volatility co-movements in cryptocur-
rency markets. Journal of International Financial Markets, Institutions and Money, 62:35
– 52, 2019. ISSN 1042-4431. doi: https://doi.org/10.1016/j.intfin.2019.05.003. URL http:
//www.sciencedirect.com/science/article/pii/S104244311930023X.
S. King and S. Nadal. Ppcoin: Peer-to-peer crypto-currency with proof-of-stake. self-published
paper, August, 19:1, 2012.
D. T. Pele, N. Wesselhöfft, W. K. Härdle, M. Kolossiatis, and Y. Yatracos. A statistical classification
of cryptocurrencies. Available at SSRN 3548462, 2020.
Y. Sovbetov. Factors influencing cryptocurrency prices: Evidence from bitcoin, ethereum, dash,
litcoin, and monero. Journal of Economics and Financial Analysis, 2(2):1–27, 2018.
S. Trimborn and W. K. Härdle. Crix an index for cryptocurrencies. Journal of Empirical Finance,
49:107 – 122, 2018. ISSN 0927-5398. doi: https://doi.org/10.1016/j.jempfin.2018.08.004. URL
http://www.sciencedirect.com/science/article/pii/S0927539818300616.
U. von Luxburg. A tutorial on spectral clustering. Technical Report 149, Max Planck Institute for
Biological Cybernetics, Tübingen, Aug. 2006.
X. Wang, K. Smith-Miles, and R. Hyndman. Characteristic-based clustering for time series data.
Data Mining and Knowledge Discovery, 13:335–364, 2005.
P. Zimmerman. Blockchain structure and cryptocurrency prices. Bank of England Working Paper,
2020.
22Appendix
Table 1: Characteristics of prices of different cryptocurrencies
Bitcoin Ethereum
Characteristic Bitcoin Ethereum Litecoin XRP
Cash Classic
mean 2659.127 178.966 34.394 537.723 9.381 0.192
standard deviation 3798.466 222.452 48.645 509.244 7.827 0.302
skewness 1.338 1.950 2.389 2.322 1.491 4.193
kurtosis 0.672 4.654 7.272 6.157 2.239 29.471
maximum 19401.000 1356.000 352.799 3526.000 43.765 3.649
minimum 0.050 0.401 0.032 58.626 0.687 0.003
lowerquant 20.193 7.975 3.153 233.404 4.364 0.007
median 455.892 136.557 8.618 324.646 6.571 0.024
upperquant 5128.000 250.965 53.128 620.947 13.813 0.291
VaR99 0.062 0.578 0.040 107.426 0.809 0.004
VaR95 0.393 0.696 0.072 129.491 1.105 0.005
slope 2.781 0.163 0.032 -0.876 -0.002 0.000
intercept 0.050 2.820 0.033 63.765 0.892 0.006
autocorrelation 0.998 0.998 0.997 0.992 0.994 0.991
self similarity 1.574 1.611 1.596 1.609 1.564 1.551
chaos 0.088 0.093 0.091 0.086 0.087 0.085
Bitcoin Bitcoin
Characteristic Dash Zcash Monero Dogecoin
SV Gold
mean 145.401 113.910 135.596 57.588 0.006 43.167
standard deviation 66.784 187.915 125.654 75.569 0.193 70.420
skewness 0.678 3.126 1.756 2.145 49.692 2.879
kurtosis 0.079 11.777 3.208 5.300 2469.511 8.351
maximum 370.647 1436.000 728.159 439.391 9.608 513.293
minimum 52.683 0.516 23.940 0.233 0.000 5.093
lowerquant 87.323 3.950 50.251 1.100 0.000 9.710
median 135.217 66.508 72.251 44.090 0.001 15.869
upperquant 191.739 133.239 199.807 84.834 0.003 29.706
VaR99 53.377 0.711 27.767 0.272 0.000 5.357
VaR95 62.111 1.833 31.842 0.417 0.000 6.604
slope 0.218 0.083 -0.134 0.053 0.000 -0.147
intercept 111.700 1.380 286.297 1.911 0.000 513.293
autocorrelation 0.990 0.997 0.995 0.997 0.002 0.961
self similarity 1.628 1.642 1.573 1.577 1.024 1.431
chaos 0.077 0.090 0.092 0.091 0.086 0.073
Peer Redd- Feather- Black- Nova-
Characteristic Vertcoin
coin coin coin coin coin
mean 1.004 0.670 0.001 0.062 0.095 2.185
standard deviation 1.238 1.319 0.003 0.102 0.127 2.989
skewness 2.511 3.637 4.175 3.379 3.397 3.102
kurtosis 7.017 14.792 24.526 17.172 15.251 12.916
maximum 9.118 9.386 0.029 1.203 1.108 24.777
minimum 0.110 0.006 0.000 0.002 0.014 0.078
lowerquant 0.291 0.043 0.000 0.008 0.030 0.507
median 0.445 0.23723 0.001 0.019 0.045 0.901
upperquant 1.275 0.626 0.001 0.072 0.088 3.301
VaR99 0.125 0.009 0.000 0.003 0.015 0.156
VaR95 0.168 0.015 0.000 0.004 0.020 0.187
slope 0.000 0.000 0.000 0.000 0.000 -0.001
intercept 0.382 6.315 0.000 0.559 0.035 0.078
autocorrelation 0.993 0.992 0.988 0.983 0.993 0.994
self similarity 1.577 1.603 1.548 1.523 1.537 1.596
chaos 0.088 0.085 0.079 0.078 0.084 0.091Table 2: Characteristics of Block time of different cryptocurrencies
Bitcoin Ethereum
Characteristic Bitcoin Ethereum Litecoin XRP
Cash Classic
mean 10.453 0.257 2.507 11.167 0.246 NA
standard deviation 8.814 0.045 0.385 11.009 0.032 NA
skewness 21.779 3.098 5.003 11.597 5.144 NA
kurtosis 701.717 11.987 54.589 160.209 61.066 NA
maximum 360.000 0.509 8.521 205.714 0.800 NA
minimum 2.081 0.208 0.149 1.275 0.153 NA
lowerquant 8.623 0.235 2.357 9.664 0.235 NA
median 9.474 0.241 2.474 9.931 0.238 NA
upperquant 10.435 0.268 2.599 10.360 0.242 NA
VaR99 5.923 0.220 1.710 2.331 0.215 NA
VaR95 7.129 0.222 2.111 8.479 0.218 NA
slope -0.001 0.000 0.000 -0.007 0.000 NA
intercept 102.857 0.208 0.149 160.000 0.208 NA
autocorrelation 0.494 0.981 0.705 0.395 0.818 NA
self similarity 1.027 1.522 0.787 0.704 1.249 NA
chaos 0.012 0.070 0.012 0.003 0.068 NA
Bitcoin Bitcoin
Characteristic Dash Zcash Monero Dogecoin
SV Gold
mean 10.195 2.659 2.409 1.686 1.048 9.823
standard deviation 1.639 0.805 0.345 0.541 0.043 0.741
skewness 12.504 19.831 -3.025 3.258 -9.220 -5.375
kurtosis 221.950 409.827 7.261 57.807 222.460 60.686
maximum 40.000 22.500 2.618 10.992 1.288 11.250
minimum 7.310 0.348 1.240 0.829 0.100 0.254
lowerquant 9.600 2.609 2.487 1.025 1.038 9.664
median 10.000 2.623 2.509 1.951 1.044 9.931
upperquant 10.511 2.637 2.531 2.020 1.050 10.141
VaR99 8.361 2.476 1.248 0.947 0.980 7.767
VaR95 9.034 2.571 1.258 0.984 1.031 8.623
slope -0.001 0.000 0.000 0.001 0.000 0.001
intercept 40.000 0.348 2.286 1.627 0.100 0.254
autocorrelation -0.115 0.707 0.982 0.805 0.787 0.378
self similarity 0.367 0.811 1.121 0.922 1.044 0.494
chaos 0.023 0.003 0.010 0.001 0.011 -0.001
Peer- Vert- Redd- Feather- Black- Nova-
Characteristic
coin coin coin coin coin coin
mean 10.085 2.502 4.646 2.005 1.090 6.819
standard deviation 47.070 0.180 68.175 6.443 0.105 2.295
skewness 30.324 -1.782 20.761 11.521 -4.368 24.326
kurtosis 919.356 30.015 434.280 157.793 18.525 891.281
maximum 1440.000 4.079 1440.000 130.909 1.335 96.000
minimum 1.377 0.151 0.646 0.148 0.442 0.451
lowerquant 7.742 2.412 0.986 1.042 1.111 6.154
median 8.372 2.500 1.007 1.048 1.114 6.606
upperquant 9.057 2.590 1.028 1.171 1.117 7.164
VaR99 5.464 2.144 24 0.935 1.034 0.551 4.364
VaR95 6.545 2.289 0.957 1.036 0.949 5.390
slope -0.003 0.000 -0.010 -0.002 0.000 -0.001
intercept 1440.000 0.151 1440.000 0.291 1.309 1.765
autocorrelation 0.667 0.154 0.821 0.914 0.976 0.373
self similarity 0.717 0.437 1.051 1.210 1.337 0.697
chaos 0.002 0.008 -0.001 0.032 0.006 0.009Table 3: Characteristics of Block size of different cryptocurrencies
Bitcoin Ethereum
Characteristic Bitcoin Ethereum Litecoin XRP
Cash Classic
mean 407162.152 14376.916 12909.684 138173.724 1297.638 NA
standard deviation 363245.372 11337.562 15590.195 284058.956 340.581 NA
skewness 0.241 0.285 4.309 9.176 0.679 NA
kurtosis -1.583 -0.819 31.780 109.791 2.106 NA
maximum 998092.000 58953.000 206020.000 4710539.000 3594.000 NA
minimum 134.000 575.164 134.000 4982.000 575.164 NA
lowerquant 21246.000 1627.750 4004.750 60455.500 1054.750 NA
median 310990.000 17024.000 7016.000 94775.000 1310.500 NA
upperquant 777369.500 23068.750 19366.500 122827.500 1492.250 NA
VaR99 134.548 658.423 561.630 15574.520 653.404 NA
VaR95 134.952 788.678 800.306 27169.700 775.052 NA
slope 266.541 17.464 8.806 -89.253 0.189 NA
intercept 204.000 643.886 199.000 385996.000 643.886 NA
autocorrelation 0.985 0.981 0.872 0.626 0.850 NA
self similarity 1.067 1.310 1.148 1.074 1.131 NA
chaos 0.058 0.058 0.065 0.027 0.045 NA
Bitcoin Bitcoin
Characteristic Dash Zcash Monero Dogecoin
SV Gold
mean 1100149.254 12999.389 23802.102 39874.397 10523.242 25312.953
standard deviation 1278250.457 26340.294 38911.209 47310.430 6607.125 67527.275
skewness 6.673 27.654 8.711 1.703 5.917 6.269
kurtosis 84.455 1040.743 117.847 4.063 68.981 45.828
maximum 20460199.000 1059232.000 687685.000 347816.000 116605.000 739259.000
minimum 5005.000 226.545 379.573 375.434 143.000 133.000
lowerquant 257789.500 3038.000 7189.500 3047.250 6775.000 6512.500
median 996071.500 9240.000 11670.000 20980.000 9510.000 9316.000
upperquant 1573243.000 19193.000 28242.000 62002.000 12022.000 14118.000
VaR99 6435.000 1312.960 2605.530 1058.990 3432.400 2727.870
VaR95 14660.750 1736.200 3103.900 1320.350 4491.000 3983.600
slope 2318.003 14.357 -25.267 26.939 1.018 -67.625
intercept 10871172.000 226.545 379.573 375.434 143.000 133.000
autocorrelation 0.377 0.298 0.836 0.958 0.798 0.618
self similarity 1.004 0.947 1.138 1.214 1.070 1.015
chaos 0.009 0.018 0.030 0.041 0.021 -0.012
Peer- Vert- Redd- Feather- Black- Nova-
Characteristic
coin coin coin coin coin coin
mean NA 2641.881 772.025 806.556 687.622 539.712
standard deviation NA 3611.409 634.442 1621.154 3441.373 1223.175
skewness NA 3.420 3.613 10.605 28.388 38.218
kurtosis NA 16.189 21.857 158.924 894.526 1712.453
maximum NA 36709.000 7808.000 36789.000 120169.000 57527.000
minimum NA 105.000 105.000 109.625 252.514 110.835
lowerquant NA 682.104 388.361 359.746 286.296 360.352
median NA 1149.000 526.043 460.827 386.251 436.181
upperquant NA 3185.000 937.696 598.841 627.727 542.228
VaR99 NA 248.950 317.797 126.333 255.520 262.588
VaR95 NA 310.697 337.320 247.907 261.297 284.524
slope NA -0.586 -0.475 -0.739 -0.025 -0.204
intercept NA 130.000 175.000 109.625 464.500 141.000
autocorrelation NA 0.894 0.609 0.705 0.360 0.069
self similarity NA 1.129
25 1.007 1.063 0.959 0.951
chaos NA 0.100 0.034 0.034 0.039 0.011IRTG 1792 Discussion Paper Series 2020
For a complete list of Discussion Papers published, please visit
http://irtg1792.hu-berlin.de.
001 ”Estimation and Determinants of Chinese Banks’ Total Factor Efficiency: A New
Vision Based on Unbalanced Development of Chinese Banks and Their Overall Risk”
by Shiyi Chen, Wolfgang K. Härdle, Li Wang, January 2020.
002 ”Service Data Analytics and Business Intelligence” by Desheng Dang Wu, Wolfgang
Karl Härdle, January 2020.
003 ”Structured climate financing: valuation of CDOs on inhomogeneous asset pools”
by Natalie Packham, February 2020.
004 ”Factorisable Multitask Quantile Regression” by Shih-Kang Chao, Wolfgang K.
Härdle, Ming Yuan, February 2020.
005 ”Targeting Cutsomers Under Response-Dependent Costs” by Johannes Haupt, Ste-
fan Lessmann, March 2020.
006 ”Forex exchange rate forecasting using deep recurrent neural networks” by Alexander
Jakob Dautel, Wolfgang Karl Härdle, Stefan Lessmann, Hsin-Vonn Seow, March
2020.
007 ”Deep Learning application for fraud detection in financial statements” by Patricia
Craja, Alisa Kim, Stefan Lessmann, May 2020.
008 ”Simultaneous Inference of the Partially Linear Model with a Multivariate Unknown
Function” by Kun Ho Kim, Shih-Kang Chao, Wolfgang K. Härdle, May 2020.
009 ”CRIX an Index for cryptocurrencies” by Simon Trimborn, Wolfgang Karl Härdle,
May 2020.
010 ”Kernel Estimation: the Equivalent Spline Smoothing Method” by Wolfgang K.
Härdle, Michael Nussbaum, May 2020.
011 ”The Effect of Control Measures on COVID-19 Transmission and Work Resumption:
International Evidence” by Lina Meng, Yinggang Zhou, Ruige Zhang, Zhen Ye,
Senmao Xia, Giovanni Cerulli, Carter Casady, Wolfgang K. Härdle, May 2020.
012 ”On Cointegration and Cryptocurrency Dynamics” by Georg Keilbar, Yanfen Zhang,
May 2020.
013 ”A Machine Learning Based Regulatory Risk Index for Cryptocurrencies” by Xinwen
Ni, Wolfgang Karl Härdle, Taojun Xie, August 2020.
014 ”Cross-Fitting and Averaging for Machine Learning Estimation of Heterogeneous
Treatment Effects” by Daniel Jacob, August 2020.
015 ”Tail-risk protection: Machine Learning meets modern Econometrics” by Bruno
Spilak, Wolfgang Karl Härdle, October 2020.
016 ”A data-driven P-spline smoother and the P-Spline-GARCH models” by Yuanhua
Feng, Wolfgang Karl Härdle, October 2020.
017 ”Using generalized estimating equations to estimate nonlinear models with spatial
data” by Cuicui Lu, Weining Wang, Jeffrey M. Wooldridge, October 2020.
018 ”A supreme test for periodic explosive GARCH” by Stefan Richter, Weining Wang,
Wei Biao Wu, October 2020.
019 ”Inference of breakpoints in high-dimensional time series” by Likai Chen, Weining
Wang, Wei Biao Wu, October 2020.
IRTG 1792, Spandauer Strasse 1, D-10178 Berlin
http://irtg1792.hu-berlin.de
This research was supported by the Deutsche
Forschungsgemeinschaft through the IRTG 1792.IRTG 1792 Discussion Paper Series 2020
For a complete list of Discussion Papers published, please visit
http://irtg1792.hu-berlin.de.
020 ”Long- and Short-Run Components of Factor Betas: Implications for Stock Pricing”
by Hossein Asgharian, Charlotte Christiansen, Ai Jun Hou, Weining Wang, October
2020.
021 ”Improved Estimation of Dynamic Models of Conditional Means and Variances” by
Weining Wang, Jeffrey M. Wooldridge, Mengshan Xu, October 2020.
022 ”Tail Event Driven Factor Augmented Dynamic Model” by Weining Wang, Lining
Yu, Bingling Wang, October 2020.
023 ”The common and speci
fic components of infl ation expectation across European countries” by Shi Chen,
Wolfgang Karl Härdle, Weining Wang, October 2020.
024 ”Dynamic Spatial Network Quantile Autoregression” by Xiu Xu, Weining Wang,
Yongcheol Shin, October 2020.
025 ”Non-Parametric Estimation of Spot Covariance Matrix with High-Frequency Data”
by Konul Mustafayeva, Weining Wang, October 2020.
026 ”Data Analytics Driven Controlling: bridging statistical modeling and managerial
intuition” by Kainat Khowaja, Danial Saef, Sergej Sizov, Wolfgang Karl Härdle,
November 2020.
027 ”Blockchain mechanism and distributional characteristics of cryptos” by Min-Bin
Lin, Kainat Khowaja, Cathy Yi-Hsuan Chen, Wolfgang Karl Härdle, November 2020.
IRTG 1792, Spandauer Strasse 1, D-10178 Berlin
http://irtg1792.hu-berlin.de
This research was supported by the Deutsche
Forschungsgemeinschaft through the IRTG 1792.You can also read