Biomass burning pollution in the South Atlantic upper troposphere: GLORIA trace gas observations and evaluation of the CAMS model
←
→
Page content transcription
If your browser does not render page correctly, please read the page content below
Research article
Atmos. Chem. Phys., 22, 3675–3691, 2022
https://doi.org/10.5194/acp-22-3675-2022
© Author(s) 2022. This work is distributed under
the Creative Commons Attribution 4.0 License.

          Biomass burning pollution in the South Atlantic upper
            troposphere: GLORIA trace gas observations and
                    evaluation of the CAMS model
            Sören Johansson1 , Gerald Wetzel1 , Felix Friedl-Vallon1 , Norbert Glatthor1 , Michael Höpfner1 ,
                  Anne Kleinert1 , Tom Neubert2 , Björn-Martin Sinnhuber1 , and Jörn Ungermann3
       1 Institute of Meteorology and Climate Research – Atmospheric Trace Gases and Remote Sensing (IMK-ASF),
                                       Karlsruhe Institute of Technology, Karlsruhe, Germany
                   2 Central Institute of Engineering, Electronics and Analytics – Electronic Systems (ZEA-2),

                                            Forschungszentrum Jülich, Jülich, Germany
       3 Institute of Energy and Climate Research – Stratosphere (IEK-7), Forschungszentrum Jülich, Jülich, Germany

                             Correspondence: Sören Johansson (soeren.johansson@kit.edu)

                               Received: 8 September 2021 – Discussion started: 2 December 2021
                       Revised: 2 February 2022 – Accepted: 14 February 2022 – Published: 17 March 2022

      Abstract. In this study, we present simultaneous airborne measurements of peroxyacetyl nitrate (PAN), ethane
      (C2 H6 ), formic acid (HCOOH), methanol (CH3 OH), and ethylene (C2 H4 ) above the South Atlantic in Septem-
      ber and October 2019. Observations were obtained from the Gimballed Limb Observer for Radiance Imaging
      of the Atmosphere (GLORIA), as two-dimensional altitude cross sections along the flight path. The flights were
      part of the SouthTRAC (Transport and Composition in the Southern Hemisphere Upper Troposphere/Lower
      Stratosphere) campaign with the German High Altitude and Long Range Research Aircraft (HALO). On two
      flights (8 September 2019 and 7 October 2019), large enhancements of all these substances were found between
      7 and 14 km altitude with maximum volume mixing ratios (VMRs) of 1000 pptv for PAN, 1400 pptv for C2 H6 ,
      800 pptv for HCOOH, 4500 pptv for CH3 OH, and 200 pptv for C2 H4 . One flight showed a common filamen-
      tary structure in the trace gas distributions, while the second flight is characterized by one large plume. Using
      backward trajectories, we show that measured pollutants likely reached upper troposphere and lower strato-
      sphere (UTLS) altitudes above South America and central Africa, where elevated PAN VMRs are visible at the
      surface layer of the Copernicus Atmosphere Monitoring Service (CAMS) model during the weeks before both
      measurements. In comparison to results of the CAMS reanalysis interpolated onto the GLORIA measurement
      geolocations, we show that the model is able to reproduce the overall structure of the measured pollution trace
      gas distributions. For PAN, the absolute VMRs are in agreement with the GLORIA measurements. However,
      C2 H6 and HCOOH are generally underestimated by the model, while CH3 OH and C2 H4 , the species with the
      shortest atmospheric lifetimes of the pollution trace gases discussed, are overestimated by CAMS. The good
      agreement between model and observations for PAN suggests that the general transport pathways and emissions
      locations are well captured by the model. The poorer agreement for other species is therefore most likely linked
      to model deficiencies in the representation of loss processes and emission strength.

Published by Copernicus Publications on behalf of the European Geosciences Union.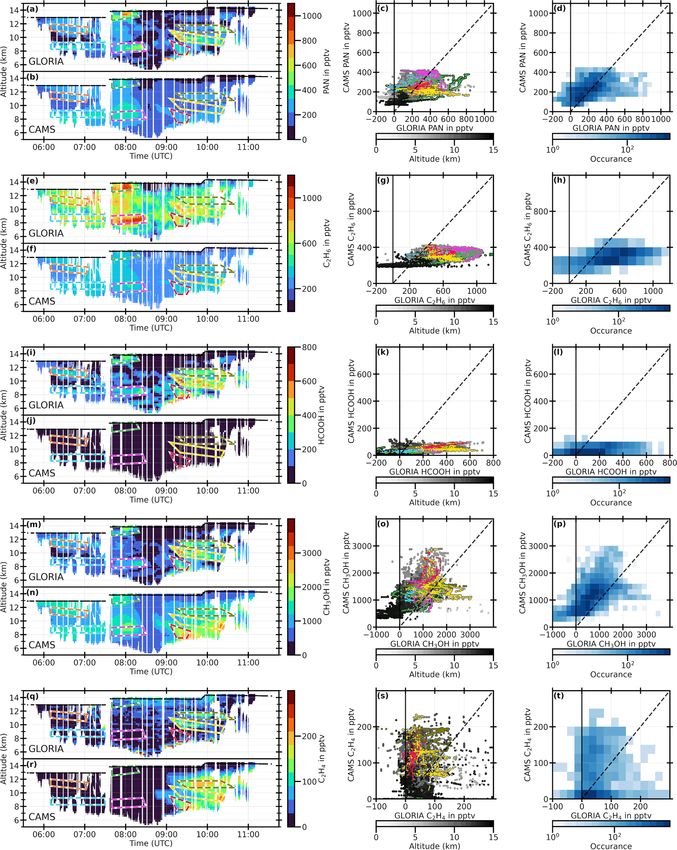
3676                                   S. Johansson et al.: GLORIA biomass burning measurements and CAMS evaluation

1   Introduction                                                   In addition, airborne in situ (e.g., Singh et al., 2001; Peis-
                                                                   chl et al., 2018) and remote sensing (e.g., Ungermann et al.,
The composition of the upper troposphere and lower strato-         2013; Johansson et al., 2020; Wetzel et al., 2021) observa-
sphere (UTLS) above South America and even above remote            tions provided detailed studies of filamentary structures (i.e.,
regions of the South Atlantic is strongly influenced by fre-       mesoscale structures with horizontal extension of up to hun-
quent biomass burning events in central Africa, South Amer-        dreds of kilometers) of these pollution trace gases.
ica, and Australia (e.g., Andreae and Merlet, 2001; Glatthor          Atmospheric model simulation of such pollution trace
et al., 2015). Pollution trace gases and aerosols, resulting       gases is challenging: for good model performance, knowl-
from fires, can be transported to the UTLS. Here, some of          edge of pollutant emissions, chemistry, and transport are nec-
these trace gases (e.g., carbon monoxide (CO), nitrogen diox-      essary. Location, time, and emitted species of biomass burn-
ide (NO2 )) are able to produce ozone (O3 ), which acts as         ing events are typically represented by emission data sets
efficient greenhouse gas at these altitudes (Xia et al., 2017;     in atmospheric models. If major fire events are missing in
Bozem et al., 2017; Bourgeois et al., 2021). Further, some         these emissions, the model is not able to reproduce upper
pollution trace gases (in particular volatile organic com-         tropospheric distributions of those species. Further, injection
pounds) may act as aerosol precursor (e.g., Hobbs et al.,          heights of polluted air masses from fires are difficult to es-
2003; Lim et al., 2019; Akherati et al., 2020, and refer-          timate, and only few emission data sets include this infor-
ences therein). Together with directly emitted aerosols, they      mation (e.g., Rémy et al., 2017). In addition, it is difficult
influence surface climate. It is well known that the UTLS          to estimate the type of fuel of biomass burning events, and
is of great importance for global climate (Gettelman et al.,       thus the concentration of the emitted compounds is uncer-
2011; Riese et al., 2012), and it is thus important to study       tain (e.g., van der Werf et al., 2017). Another challenge is
biomass burning trace gases at UTLS altitudes. Due to in-          the accurate simulation of transport pathways of polluted air
creasing biomass burning activities in Africa, South Amer-         masses during pyroconvective updraft (e.g., Khaykin et al.,
ica, and Australia (Torres et al., 2010; Abram et al., 2021),      2020). Furthermore, chemical reactions and physical pro-
the potential influence of biomass burning trace gases on cli-     cesses that are relevant for these biomass burning pollu-
mate may increase over time.                                       tion trace gases are subject of recent research, such as the
   Typical biomass burning trace gases have different atmo-        formation of HCOOH (Franco et al., 2021), or secondary
spheric lifetimes and atmospheric sinks. Further, they may         aerosol formation (Lim et al., 2019). As an example, Wet-
have additional non-pyrogenic sources, such as fuel combus-        zel et al. (2021) showed that it is difficult to reproduce mea-
tion or biogenic emissions. In this work, peroxyacetyl nitrate     sured pollution trace gas plumes above the North Atlantic
(PAN), ethane (C2 H6 ), formic acid (HCOOH), methanol              without artificially enhanced emissions. Earlier, Coheur et al.
(CH3 OH), and ethylene (C2 H4 ) are discussed, and their char-     (2007) compared ACE-FTS (Atmospheric-Chemistry Exper-
acteristics are summarized in Table 1. These trace gases have      iment Fourier Transform Spectrometer) observations of a
been selected for this study because they all are potentially      biomass burning plume with their model and found consid-
emitted from biomass burning events, have a large range            erable differences in the vertical profiles of CO.
of upper tropospheric lifetimes (from a few days to several           Between September and November 2019, the SouthTRAC
months), and because they are part of the GLORIA (Gim-             (Transport and Composition in the Southern Hemisphere Up-
balled Limb Observer for Radiance Imaging of the Atmo-             per Troposphere/Lower Stratosphere; see https://www.pa.op.
sphere) measurements and CAMS (Copernicus Atmosphere               dlr.de/southtrac/, last access 17 January 2022) aircraft cam-
Monitoring Service) model output. In addition, these trace         paign was conducted with base in Rio Grande, Argentina.
gases are measured by various infra- red satellite sounders        Onboard the German research aircraft HALO (High Alti-
(see below) but in coarser spatial resolution than the GLO-        tude and Long Range Research Aircraft), 10 in situ and three
RIA measurements. Typical atmospheric sinks of those pol-          remote sensing instruments performed measurements dur-
lutants are reactions with the hydroxyl radical (OH), wet and      ing transfer flights from Oberpfaffenhofen, Germany, to Rio
dry deposition, and thermal decomposition (see Table 1 for         Grande, Argentina, and during local flights from Rio Grande.
details). In previous studies, these trace gases have been ob-     The GLORIA instrument was part of the HALO payload and
served by several satellite instruments in nadir (e.g., Coheur     measured two-dimensional distributions of temperature and
et al., 2009; Dolan et al., 2016; Franco et al., 2018; Pope        various trace gases, such as PAN, C2 H6 , HCOOH, CH3 OH,
et al., 2021) as well as in limb views (e.g., Rinsland et al.,     and C2 H4 , along the flight track. In this work, we use these
2005; Dufour et al., 2007; Grutter et al., 2010; Wiegele et al.,   measurements to identify polluted air masses, estimate the
2012). These measurements allowed for monitoring of large-         points at which the air masses reached UTLS altitudes us-
scale biomass burning plume transport and chemical com-            ing backward trajectories, and perform quantitative compar-
position. Further, these satellite measurements allowed bet-       isons of the measurements with the CAMS model simulation
ter estimation of biomass burning sources (e.g., Stavrakou         results. The CAMS reanalysis uses a state-of-the-art atmo-
et al., 2011), and examined transport and composition of sim-      spheric chemistry model for data assimilation, which is pub-
ulated biomass burning plumes (e.g., Glatthor et al., 2013).       licly available and widely used for air quality and pollution

Atmos. Chem. Phys., 22, 3675–3691, 2022                                             https://doi.org/10.5194/acp-22-3675-2022
S. Johansson et al.: GLORIA biomass burning measurements and CAMS evaluation                                                                          3677

Table 1. Sources, sinks, estimated lifetimes, and approximate upper tropospheric background volume mixing ratios (VMRs) of pollution
trace gases PAN, C2 H6 , HCOOH, CH3 OH, and C2 H4 which are discussed in this paper.

                 Sources                            Sinks                            Lifetime              Background VMRs   References
    PAN          Precursors:                        Thermal decomposition            1 h (BL)              < 100 pptv        Fischer et al. (2014)
                 Fuel combustion                    Photolysis (UT)                  5 months (UT)                           Glatthor et al. (2007)
                 Biomass burning
    C2 H6        Biomass burning                    Reaction with OH                 2 months              < 500 pptv (NH)   Rudolph (1995)
                 Natural gas loss                                                                          < 300 pptv (SH)   Xiao et al. (2008)
                 Fossil fuel production
                 Biofuel use
    HCOOH        Biogenic emissions                 Reaction with OH                 1–2 d (BL)            < 100 pptv        Paulot et al. (2011)
                 Biomass burning                    Wet and dry deposition           weeks (UT)                              Millet et al. (2015)
                 Fossil fuel combustion                                                                                      Mungall et al. (2018)
                 Secondary production
    CH3 OH       Biogenic emissions                 Reaction with OH                 5.3 d                 < 300 pptv        Bates et al. (2021)
                 Oceanic emissions                  Wet and dry deposition
                 Biomass burning                    Ocean uptake
                 Anthropogenic emissions
                 Secondary production
    C2 H4        Biogenic emissions                 Reaction with OH                 0.5 d (LT)            < 50 pptv         Sawada and Totsuka (1986)
                 Biomass burning                    Reaction with O3                 1.2 d (UT)                              Mauzerall et al. (1998)
                 Fossil fuel combustion                                                                                      Morgott (2015)
 BL – boundary layer; LT – lower troposphere; UT – upper troposphere; NH – northern hemisphere; SH – southern hemisphere.

related studies (e.g., studies citing Inness et al., 2019). In this                      trometer with an imaging detector, which allows for simul-
work, we aim to evaluate the CAMS reanalysis in the re-                                  taneous observations of 128 × 48 atmospheric spectra. An
mote upper troposphere above the South Atlantic, a sparsely                              actively controlled gimbal frame enables compensation of
measured region. With our comparisons we further aim to                                  aircraft movements and targeted line of sight control. Two
provide recommendations for improving the CAMS model                                     external black bodies, as well as measurements into deep
with respect to emissions and atmospheric lifetimes for the                              space, are used for in-flight radiometric calibration. In this
studied species.                                                                         study, we use interferograms recorded in GLORIA’s high-
   In the following, we present an overview of GLORIA mea-                               spectral-resolution mode. This mode utilizes an optical path
surements and retrievals during the SouthTRAC campaign,                                  difference of 8.0 cm, which results in spectral sampling of
together with a description of the atmospheric models used                               0.0625 cm−1 , and a horizontal sampling along the flight path
by this study. The measured concentrations of biomass burn-                              of approximately 3.5 km. These recorded interferograms are
ing trace gases for two research flights above the South At-                             radiometrically and spectrally calibrated according to GLO-
lantic are discussed in detail, followed by a backward tra-                              RIA level 1 processing as described by Kleinert et al. (2014),
jectory analysis to estimate the point at which these biomass                            Guggenmoser et al. (2015), and Ungermann et al. (2021).
burning plumes reached UTLS altitudes. Finally, GLORIA                                   The spectra are horizontally binned after filtering of bad pix-
observations are directly compared to CAMS model simula-                                 els, such that the final data product is a set of 127 vertical
tion results.                                                                            spectra per measurement (one row is filtered completely).
                                                                                            These calibrated spectra are then used to retrieve atmo-
                                                                                         spheric profiles of temperature, aerosols, and trace gases. The
2     Observations and atmospheric model simulations                                     retrieval applies a nonlinear least-squares fit algorithm with
                                                                                         Tikhonov regularization, and is based on the retrieval strat-
2.1    GLORIA measurements during the SouthTRAC                                          egy as described by Johansson et al. (2018). Overall, the
       aircraft campaign                                                                 retrievals are similar to retrievals of pollution trace gases
                                                                                         as described by Wetzel et al. (2021) and Johansson et al.
The GLORIA instrument (Friedl-Vallon et al., 2014; Riese
                                                                                         (2020). Specific retrieval properties are summarized in Ta-
et al., 2014) has been deployed on various aircraft campaigns
                                                                                         ble 2. Detailed error estimation and vertical resolution analy-
with the Russian M55 Geophysica (e.g., Höpfner et al., 2019)
                                                                                         ses are provided as Supplement to this paper, and a summary
and the German HALO research aircraft (e.g., Oelhaf et al.,
                                                                                         per species is presented in Table 2. Spectroscopic errors are
2019. The instrument combines a Fourier-transform spec-

https://doi.org/10.5194/acp-22-3675-2022                                                                      Atmos. Chem. Phys., 22, 3675–3691, 2022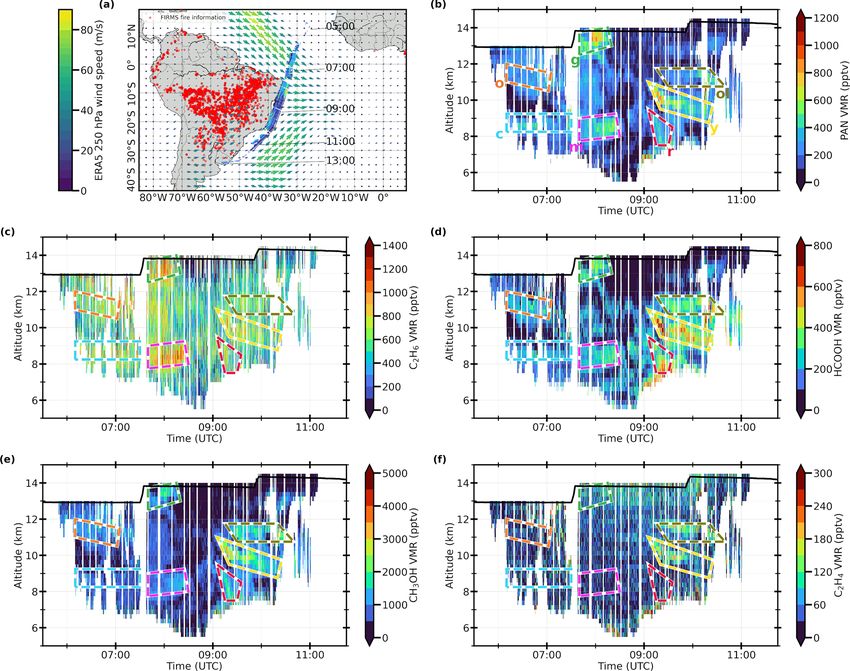
3678                                   S. Johansson et al.: GLORIA biomass burning measurements and CAMS evaluation

noted in the Supplement and are, among other sources, based       tively. They found an overall underestimation of those pollu-
on uncertainties reported by Rothman et al. (2005) and Gor-       tants in the model and, for the Asian Monsoon, it is suggested
don et al. (2017).                                                that some emission sources are missing in CAMS. Because
   GLORIA observations used in this study were recorded           these evaluations are limited to the Northern Hemisphere and
during the SouthTRAC HALO aircraft campaign. This cam-            do not capture large scale biomass burning events, our arti-
paign was conducted in two phases between September and           cle may contribute to estimates of the general performance
November 2019, of which the phase in September focused            of CAMS in reproducing pollution trace gas distributions in
on measurements of gravity waves (Rapp et al., 2021). GLO-        the upper troposphere.
RIA measurements have been obtained during transfer flights
between Oberpfaffenhofen, Germany, and Rio Grande, Ar-            2.3    HYSPLIT trajectory model
gentina, and local flights from Rio Grande. In this study, re-
sults from two transfer research flights are discussed. The       The HYbrid Single-Particle Lagrangian Integrated Trajec-
flights on 8 September 2019 and 7 October 2019 were di-           tory model (HYSPLIT; Stein et al., 2015; Rolph et al., 2017)
rected from Sal, Cabo Verde, to Buenos Aires, Argentina,          is a commonly used transport and dispersion model de-
and vice versa, as part of the aircraft transfer between Ger-     veloped by the Air Resources Laboratory of the National
many and Rio Grande. Those flights were selected for this         Oceanic and Atmospheric Administration. In this work, we
study, because they covered the UTLS region above the             use HYSPLIT to calculate backward trajectories based on
South Atlantic and revealed the highest volume mixing ra-         Global Forecast System (GFS) global model results with a
tios of the examined pollution trace gases.                       horizontal resolution of 0.25◦ × 0.25◦ latitude × longitude.
                                                                  Seven day backward trajectories are started at measurement
2.2    CAMS atmospheric model
                                                                  geolocations with enhanced pollution trace gas signatures in
                                                                  the GLORIA measurements. Upward transport of the trajec-
The Copernicus Atmosphere Monitoring Service (CAMS)               tories is limited to the vertical motion prescribed by the me-
provides the ECMWF (European Centre for Medium-Range              teorological fields. It is well known that these meteorolog-
Weather Forecast) Atmospheric Composition Reanalysis              ical fields underestimate upward transport, particularly for
version 4 (EAC4) data product (Flemming et al., 2015; In-         convective events, which are usually not resolved or suffi-
ness et al., 2019). This data product (in this paper abbre-       ciently parameterized by meteorological models (e.g., Hoyle
viated as “CAMS”) utilizes the ECMWF Integrated Fore-             et al., 2011). Advanced schemes for convection detection
cast System (IFS) model, which assimilates various obser-         along backward trajectories (e.g., Wohltmann et al., 2019)
vations of atmospheric state and composition. The model           are not applied for backward trajectories used in this study.
applies a chemistry module named IFS(CB05) (Flemming              For this reason, the vertical motion of the HYSPLIT trajecto-
et al., 2015) and an aerosol module as described by Mor-          ries is not discussed in detail here. Hence, we do not attempt
crette et al. (2009). The model has 60 vertical levels be-        to retrieve the origin of the measured air masses, but rather
tween 0.1 and 1000 hPa, and has a horizontal resolution of        the location, at which the air masses reached upper tropo-
0.75◦ × 0.75◦ latitude × longitude. Output is provided every      spheric altitudes.
3 h and includes a variety of meteorological parameters, con-
centrations of chemical tracers, and aerosol properties for the
                                                                  3     Pollution trace gas measurements
time between 2003 and 2020. CAMS uses prescribed emis-
sions from MACCity (MACC/CityZEN; Granier et al., 2011)           3.1    Flight on 8 September 2019
for anthropogenic emissions, from MEGAN2.1 (Model of
Emissions of Gases and Aerosols from Nature; Guenther             The SouthTRAC research flight on 8 September 2019 was
et al., 2012) for biogenic emissions, and from GFAS v1.2          part of the transfer of the HALO aircraft from Oberpfaf-
(Global Fire Assimilation System; Kaiser et al., 2012) for        fenhofen, Germany, to Rio Grande, Argentina, and started
biomass burning emissions. GFAS assimilates information           in Sal, Cabo Verde, in a southwest direction toward Buenos
of fire radiative power and injection height from satellite ob-   Aires, Argentina. Figure 1a shows the flight track as well as
servations. In a model evaluation study, Wang et al. (2020)       PAN volume mixing ratios (VMRs) at the horizontal tan-
compared tropospheric trace gas profile measurements from         gent point locations of the GLORIA field of view. To fa-
aircraft campaigns to CAMS reanalysis data. They compared         cilitate the interpretation of the trace gas cross sections in
measurements taken over the Arctic, North America, and            the figure panels, measurement times are also indicated. Fire
Hawaii to model simulation results and show that simulated        events in South America and Africa over 3 days before the
PAN is in agreement with observations, while CAMS C2 H6           GLORIA measurements, obtained from the Fire Informa-
is generally underestimated. Further, Johansson et al. (2020)     tion for Resource Management System (FIRMS; see https://
and Wetzel et al. (2021) compared GLORIA PAN, C2 H6 , and         firms.modaps.eosdis.nasa.gov/, last access 17 January 2022)
HCOOH to CAMS reanalysis data in the upper troposphere            are shown as red dots in the background of the map. These
above the Asian Monsoon, and the North Atlantic, respec-          data are based on observations from the Moderate Resolution

Atmos. Chem. Phys., 22, 3675–3691, 2022                                            https://doi.org/10.5194/acp-22-3675-2022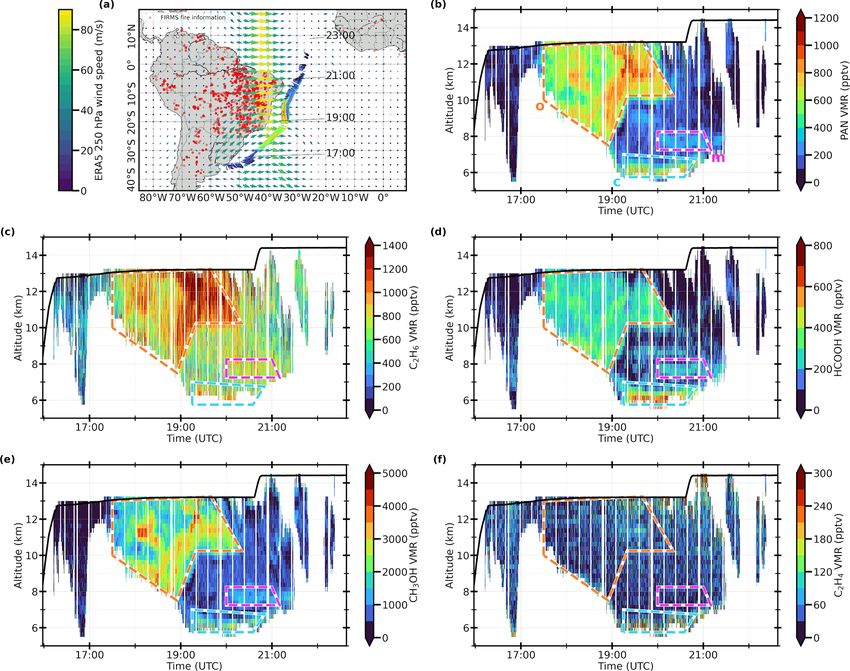
S. Johansson et al.: GLORIA biomass burning measurements and CAMS evaluation 3679
Table 2. Retrieval properties for PAN, C2 H6 , HCOOH, CH3 OH, and C2 H4 : Spectral regions used, and handling of interfering species.
10 and 90 percentile ranges are given for vertical resolution and estimated errors (combination of random and systematic errors). In the
Supplement, it is shown that larger absolute errors are typically connected to higher VMRs.
Target gas Spectral regions Fitted species Forward-calculated species Vert. resolution Estimated error
PAN 780.0–790.0 cm−1 H2 O∗ , O3 ∗ , CO2 , NO2 , NH3 , HNO3 ∗ , ClO, OCS, 0.4–0.8 km 40–130 pptv
794.0–805.0 cm−1 HCFC-22, HCN, CH3 Cl, C2 H2 , C2 H6 , COF2 ,
CCl4 , PAN C2 H4 , CFC-11∗ , CFC-113, CFC-141,
ClONO2 ∗ , CH3 OH, HNO4 , CH3 COCH3
C2 H6 819.000–822.625 cm−1 O3 ∗ , C2 H6 , H2 O∗ , CO2 , NO2 , NH3 , HNO3 ∗ , HCN, 0.8–1.1 km 130–380 pptv
829.750–833.125 cm−1 HCFC-22 CH3 Cl, C2 H2 , COF2 , CFC-11∗ , CCl4 ,
ClONO2 ∗ , CH3 CCl3 , PAN
HCOOH 1086.50–1089.44 cm−1 HCOOH, O3 ∗ , H2 O∗ , CO2 , NH3 , CFC-11∗ , 0.5–1.2 km 30–140 pptv
1103.50–1106.12 cm−1 CFC-12∗ , CFC-113, CFC-114
1112.50–1116.88 cm−1 HCFC-22
CH3 OH 982.875–999.312 cm−1 H2 O∗ , O3 ∗ , NH3 , CO2 , CFC-113 0.4–0.9 km 200–680 pptv
CH3 OH, PAN
C2 H4 945.188–952.312 cm−1 H2 O∗ , NH3 , CO2 , O3 ∗ , N2 O, NO2 , HNO3 ∗ , COF2 , 0.3–0.7 km 30–110 pptv
C2 H4 , SF6 CFC-11∗ , CFC-12∗ , HCFC-22,
CH3 CCl3 , CH3 COCH3 , PAN
∗ Results of previous retrievals (not shown in this paper) targeting these species have been used for simulation of the spectra, or as an initial guess for the retrieval.
Imaging Spectroradiometer (MODIS; Giglio, 2000) onboard altitude (green). These air masses also contain strongly en-
the NASA Terra and Aqua satellites and are shown here to hanced C2 H6 (up to 1000 pptv), weaker enhanced HCOOH
provide an overview of biomass burning events prior to the (up to 500 pptv) and CH3 OH (up to 2000 pptv), but no signa-
research flight. These fire data reveal a large density of fires tures of enhanced C2 H4 . At the same time, but at lower alti-
in central South America. Furthermore, horizontal winds at tudes of around 8 km (magenta), a weaker local maximum is
250 hPa (approximately 10 km altitude) from the fifth gen- observed for PAN (up to 500 pptv), C2 H6 (up to 1100 pptv),
eration of the ECMWF Reanalysis (ERA5; Hersbach et al., HCOOH (up to 400 pptv), and CH3 OH (up to 1600 pptv),
2018) are shown as colored arrows to provide meteorolog- but again not for C2 H4 . Later during the flight, at 09:15 UTC
ical context of the GLORIA measurements. These horizon- and 10 km altitude (yellow), a strong enhancement is mea-
tal winds indicate strong southwesterly currents reaching the sured for all five discussed trace gases (up to 1000 pptv for
flight path at the Equator (approximately 07:00 UTC). An- PAN, 900 pptv for C2 H6 , 800 pptv for HCOOH, 4000 pptv
other region of strong winds is located above the South At- for CH3 OH, and 200 pptv for C2 H4 ). Above this horizontally
lantic with northwesterlies parallel to the flight path. Above extending local maximum, a similar structure is observed at
the South American continent, where many fire counts are 11 km altitude (olive). For all measured trace gases but C2 H4 ,
displayed, weaker northwesterly winds are marked, which absolute VMRs are smaller compared to the enhancement at
may transport polluted air from the fires to the measurement 10 km altitude. Again, at 09:15 UTC but at altitudes above
locations. However, these winds, which are only shown at cloud tops (7 km; red), a local enhancement with smaller ab-
250 hPa, can only provide a simple overview of the situation, solute VMRs is measured for all discussed trace gases, ex-
which will be more closely analyzed by trajectory calcula- cept C2 H4 . Towards the end of the flight (after 10:15 UTC),
tions below. measurements are affected by aerosol or clouds, which re-
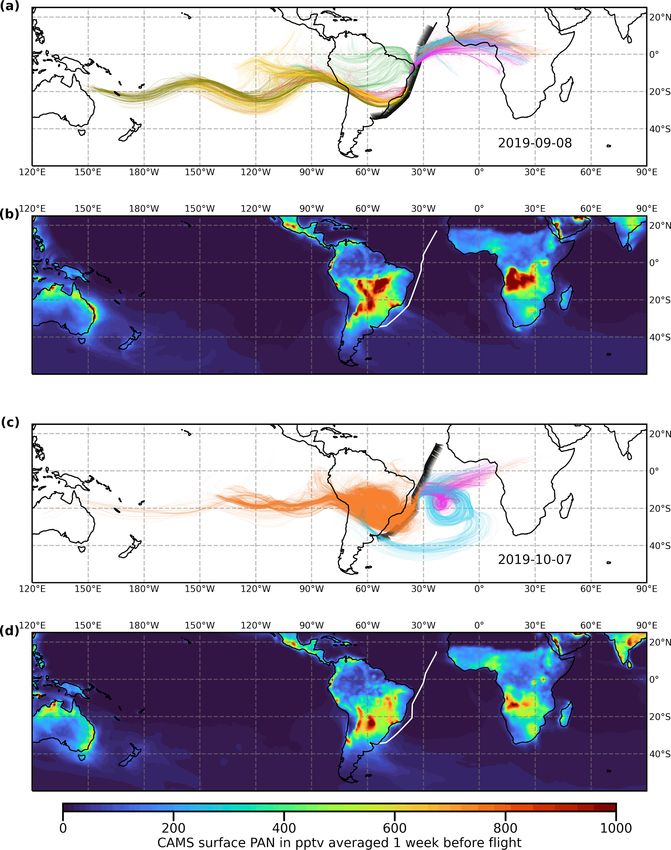
The measured cross sections of the pollution trace gases sults in increased filtering of data and reduced retrieval qual-
reveal filamentary structures along the flight path. At the be- ity (see Supplement).
ginning of the flight around 07:00 UTC, two layers of en- In horizontal–vertical space, the pollution gas distributions
hanced pollution trace gas concentrations are observed at are strongly correlated, pointing to self-consistent measure-
altitudes of 8 and 11 km for all discussed trace gases, ex- ments. However, the highest VMRs for each trace gas are not
cept C2 H4 (marked by orange and cyan boxes). Compared to always observed within the same air masses. For example,
other enhancements during this flight, these local maxima are C2 H6 shows highest VMRs at the maximum at 08:00 UTC
relatively low (up to 500 pptv for PAN, 700 pptv for C2 H6 , and 8 km altitude, but PAN, HCOOH, and CH3 OH have com-
300 pptv for HCOOH, and 1200 pptv for CH3 OH, Fig. 1b– parably low absolute VMRs for this local maximum. For
e). During the later part of the flight, strong enhancements of C2 H4 , the species with the shortest atmospheric lifetime (see
PAN of up to 900 pptv are measured at 08:00 UTC and 13 km Table 1), only two maxima are observed, in contrast to many
https://doi.org/10.5194/acp-22-3675-2022 Atmos. Chem. Phys., 22, 3675–3691, 20223680 S. Johansson et al.: GLORIA biomass burning measurements and CAMS evaluation
Figure 1. (a) Flight path for SouthTRAC research flight on 8 September 2019 from Sal, Cabo Verde, to Buenos Aires, Argentina. Along the
flight track, concentrations of PAN are displayed at the horizontal distributions of the tangent points (color bar in b). The temporal evolution
of the flight is indicated by times in UTC, marked along the flight track. Fire events as noted by FIRMS during 3 d before the GLORIA
measurements are indicated as red dots on the map. ERA5 horizontal winds at 08:00 UTC at a typical measurement altitude of 250 hPa
(approximately 10 km) are shown as arrows with amplitudes given by the left color bar. (b) Vertical distribution of GLORIA measurements
of PAN for SouthTRAC flight on 8 September 2019. The black line marks the aircraft altitude. Colored boxes mark air masses of interest,
which are discussed in more detail by a trajectory analysis in the following section (o: orange, c: cyan, g: green, m: magenta, ol: olive, y:
yellow, r: red). (c) Same as (b), but for C2 H6 . (d) Same as (b), but for HCOOH. (e) Same as (b), but for CH3 OH. (f) Same as (b), but for
C 2 H4 .
distinct maxima in the other species. This indicates that these Cross sections of the pollution trace gases for this flight are
air masses have been recently transported from a biomass presented in Fig. 2b–f. Until 17:30 UTC, no considerable en-
burning source to the measurement location. A further inves- hanced structure is observed for any discussed trace gas. Af-
tigation of the air mass history will be presented in Sect. 4, terwards, a remarkable nose-shaped maximum is measured
based on the analysis of backward trajectories. for PAN, C2 H6 , HCOOH, and CH3 OH between 17:30 and
20:00 UTC, and 8 to 13 km altitude (orange). Within this
3.2 Flight on 7 October 2019 plume, maximum VMRs of PAN up to 1000 pptv, of C2 H6
up to 1400 pptv, of HCOOH up to 500 pptv, and of CH3 OH
The flight on 7 October 2019 was similar to the flight on up to 4500 pptv are observed. For C2 H4 , only a small en-
8 September 2019, but in the opposite direction. The flight hancement at 19:30 UTC and 11 km altitude with VMRs up
was routed from Buenos Aires to Sal, and this time, GLO- to 120 pptv is measured. These are the same air masses, for
RIA tangent points were directed eastwards, away from the which PAN and CH3 OH have their highest VMRs within
South American coast (see Fig. 2a). Again, a large number of the larger plume. A smaller enhancement in all discussed
fires was reported by FIRMS above central South America. trace gases is observed between 19:00 and 21:00 UTC, above
The horizontal winds show a strong westerly component at cloud top altitude, at 6 km (up to 800 pptv for PAN, 1100 pptv
approximately 40◦ W, which may have transported polluted for C2 H6 , 800 pptv for HCOOH, 2500 pptv for CH3 OH, and
air from the fires to the measurement locations. 300 pptv for C2 H4 ; cyan). However, these enhancements are
Atmos. Chem. Phys., 22, 3675–3691, 2022 https://doi.org/10.5194/acp-22-3675-2022S. Johansson et al.: GLORIA biomass burning measurements and CAMS evaluation 3681
Figure 2. Same as Fig. 1, but for SouthTRAC flight on 7 October 2019 from Buenos Aires, Argentina, to Sal, Cabo Verde. In panel (a),
ERA5 winds are displayed at 19:00 UTC. Note that color bars may have changed compared to Fig. 1.
affected by a considerably higher absolute total estimated backward trajectories are not expected to reasonably repro-
error (see Supplement), and therefore these measurements duce vertical motion of the air masses and therefore no verti-
are not as reliable as others. Further, a smaller maximum is cal information is presented in the following figures. For the
measured between 20:00 and 21:00 UTC at 7.5 km altitude interpretation of the trajectories, this means that the exam-
(magenta) for PAN (300 pptv), C2 H6 (900 pptv), HCOOH ined air mass may have reached UTLS altitudes at any point
(300 pptv), and CH3 OH (1500 pptv). along the backward trajectory connected with this particular
The ERA5 horizontal winds suggest that the largest plume air mass.
observed during this flight was transported from fires in cen- Trajectories for the flight on 8 September 2019 are shown
tral South America. The relatively low measured VMRs for in Fig. 3a. Because of the many small scale maximum struc-
C2 H4 indicate that the plume has been transported in the at- tures in the measurements, trajectories from many different
mosphere for clearly more than a few days (the upper tropo- colored regions have been calculated. It can be seen that
spheric lifetime of C2 H4 is 1.2 d (see Table 1). cyan, magenta, and orange marked air masses come from
central Africa, while green, red, yellow, and olive marked
air masses come from South America. These different points
4 Trajectory analysis at which the air masses reached UTLS altitudes are also
in agreement with the measured distributions of C2 H4 , the
For the geolocations (latitude, longitude, altitude, time) of pollution trace gas with the shortest atmospheric lifetime in
the GLORIA measurements marked by colored boxes in the this study. This gas is only enhanced within the yellow and
cross sections shown in Figs. 1–2 (colors are specified in olive marked air masses, which both are indicated to come
Sect. 3), HYSPLIT 7 d backward trajectories were calcu- from South America. However, the red and green marked
lated and their horizontal evolution is presented in Fig. 3. air masses also come from South America (according to the
For a comparison with potential emission sources, addition- HYSPLIT trajectories), but do not show enhanced VMRs of
ally surface PAN VMRs from the CAMS model are shown as C2 H4 . In particular, trajectories for the red marked air masses
7 d averages for the time before each flight. These HYSPLIT look very similar to those marked yellow and olive. Possible
https://doi.org/10.5194/acp-22-3675-2022 Atmos. Chem. Phys., 22, 3675–3691, 20223682 S. Johansson et al.: GLORIA biomass burning measurements and CAMS evaluation
Figure 3. Horizontal evolution of HYSPLIT 7 d backward trajectories, starting at colored regions, as marked in Figs. 4–5 for flights on (a)
8 September 2019, and (c) 7 October 2019. The flight track and all tangent points are marked (see Figs. 4–5 for color bar) to indicate the
beginning of the backward trajectories. Panels (b) and (d) show surface level volume mixing ratios of PAN, averaged over 1 week before the
corresponding research flight, as reported by the CAMS model.
reasons for these different C2 H4 concentrations of air masses backward trajectories indicate the origin of the measured pol-
with similar history may be different emissions of C2 H4 , luted air masses.
higher loss processes for the different air masses, or different For the flight on 7 October 2019, three air masses of inter-
timing of vertical transport, which is not analyzed here. In est have been marked by colored boxes in Fig. 2. The paths
Fig. 3b, CAMS surface PAN VMRs, averaged 1 week before of backward trajectories connected with these air masses are
the flight, can be compared to the trajectory paths. CAMS shown in Fig. 3c. As discussed in the previous section, pol-
surface PAN was shown to agree with measurements else- lution trace gas measurements of this flight are dominated by
where (see Sect. 2.2 and Wang et al., 2020). As expected a major plume, marked with an orange box. HYSPLIT back-
from the FIRMS fire data shown in Fig. 1a, elevated PAN ward trajectories starting from this orange marked plume in-
concentrations are present in central South America and cen- dicate an origin of these air masses from the central South
tral Africa. These are also the regions, where the HYSPLIT American continent. As already estimated from the FIRMS
fire data and ERA5 horizontal winds in Fig. 2a, it is likely
Atmos. Chem. Phys., 22, 3675–3691, 2022 https://doi.org/10.5194/acp-22-3675-2022S. Johansson et al.: GLORIA biomass burning measurements and CAMS evaluation 3683
that these polluted air masses come from biomass burning line (assuming a GLORIA total estimated error of up to
events in central South America. Surface concentrations of 130 pptv).
PAN (Fig. 3d), also illustrate enhancements in this region. In the direct comparison of C2 H6 (Fig. 4e–f), some of the
Air masses from smaller maxima during this flight, marked measured local maxima are reproduced by the model (e.g.,
cyan and magenta, instead have been first transported longer red, magenta or green boxes), but overall C2 H6 maxima and
paths above the South Atlantic. The pollution trace gases background values are underestimated by the CAMS model.
of the cyan marked air masses have been emitted in South This underestimation of C2 H6 by the model is also illustrated
America, and then been transported above the South Atlantic by the correlation plots (Fig. 4g–h). The comparison of mea-
for approximately 1 week, before they reached the measure- sured and simulated HCOOH is presented in Fig. 4i–l. While
ment location. The backward trajectories associated with multiple enhancements up to 700 pptv are observed by GLO-
the magenta marked air masses also have been transported RIA, CAMS simulates less than 100 pptv of HCOOH for the
above the South Atlantic for 1 week before the measure- entire cross section.
ment. Before this 1 week above the ocean, these air masses In contrast to HCOOH, CAMS succeeds in reproducing
appear to come from central Africa, which is also a region the measured distribution of CH3 OH qualitatively, as it does
of slightly enhanced PAN surface VMRs according to the for PAN and C2 H6 . Relative maxima (except the one of the
CAMS model. These relatively lower enhancements of sur- yellow marked air mass) are well represented by the model
face PAN are in agreement with the relatively lower enhance- (Fig. 4m–n), and most of the absolute VMRs are in the same
ments of the GLORIA PAN VMRs. order of magnitude as the ones of the GLORIA measure-
ments. However, background VMRs are typically simulated
too high. The correlation plots (Fig. 4o–p) illustrate that the
5 Comparison to CAMS model simulations model overestimates CH3 OH concentrations overall, particu-
larly for the red marked air masses. For the missing simulated
In this section, GLORIA PAN, C2 H6 , HCOOH, CH3 OH, and local maximum at the yellow marked air masses, CAMS un-
C2 H4 trace gas distributions will be used to evaluate CAMS derestimates measured VMRs.
model results. Figures 4–5 present comparisons of these pol- For C2 H4 (Fig. 4q–r), only distinct local maxima are ob-
lution trace gas measurements to CAMS simulation results, served by GLORIA during the second part of the flight, at the
which have been temporally and spatially interpolated to the olive and yellow marked air masses. CAMS also only simu-
GLORIA tangent point locations and measurement times. In lates enhancements of C2 H4 during the second part of the
order to ensure a meaningful comparison, up to 27 GLORIA flight, in accordance with the measurements. However, ab-
profiles are averaged horizontally to have a comparable hor- solute C2 H4 VMRs are simulated considerably higher than
izontal resolution to the CAMS model (≈ 80 km). In these measured (typically 200 pptv compared to 150 pptv). In par-
figures, first direct comparisons of measured and simulated ticular, the yellow marked air masses do not contain a sim-
pollution trace gas cross sections are shown, followed by cor- ulated maximum, even though it was measured. In contrast,
relation plots. At the end of this section, implications for sug- the red marked air masses have a simulated maximum, which
gested model improvements based on these comparisons are was not measured. This overestimation is also shown in the
discussed. correlation plots (Fig. 4s–t).
5.1 Flight on 8 September 2019 5.2 Flight on 7 October 2019
Figure 4 compares GLORIA measurements and CAMS sim- The flight on 7 October 2019 is characterized by a promi-
ulation results for the research flight on 8 September 2019. nent nose-like plume. In Fig. 5a–b, the direct comparison of
For the direct comparison between distributions of PAN from GLORIA and CAMS PAN is presented. The largest plume
GLORIA and CAMS (Fig. 4a–b), the model is able to repro- (marked with an orange box) is simulated by CAMS in
duce all measured structures that are marked with colored quantitative agreement with the GLORIA measurements.
boxes, except for the air mass marked in yellow. In addi- A smaller measured local maximum structure above the
tion, absolute maximum PAN VMRs are simulated too low, cloud top (marked cyan), is also reproduced by CAMS, but
in particular for the green marked air masses. The correlation with lower absolute VMRs (700 pptv measured compared to
plots reflect this overall agreement between measurement 300 pptv simulated). An even smaller measured local maxi-
and model, within the estimated errors of the GLORIA re- mum (300 pptv) is marked by a magenta box. Although the
trieval (see Table 2). The pointwise correlation plot (Fig. 4c) absolute VMRs in this box are comparable in the simula-
illustrates that points that are far away from the dashed line tion, this maximum is not distinguishable from the back-
are connected with yellow and green marked air masses, ground VMRs, which are generally higher in the simula-
which have been identified as problematic in the cross sec- tion than in the measurement. The overall agreement between
tion comparison before. The histogram plot (Fig. 4d) shows measurement and simulation is confirmed by the correlation
that the majority of correlation points is close to the dashed plots (Fig. 5c–d). As discussed, lower simulated VMRs for
https://doi.org/10.5194/acp-22-3675-2022 Atmos. Chem. Phys., 22, 3675–3691, 20223684 S. Johansson et al.: GLORIA biomass burning measurements and CAMS evaluation Figure 4. Comparison of GLORIA PAN (a–d), C2 H6 (e–h), HCOOH (i–l), CH3 OH (m–p), and C2 H4 (q–t) measurements to interpolated CAMS simulation results during SouthTRAC flight on 8 September 2019. In the left column, measurement and interpolated model results are compared as cross sections. Colored boxes mark regions with measurements of enhanced pollution trace gases and are repeated from Fig. 1. Panels in the second column show single point correlations, color coded by altitude, while panels on the right display the occurrence of these correlation points in fixed bins. the cyan marked air masses stand out, together with overall smaller enhancement is simulated within the orange marked slightly higher simulated PAN background VMRs. air masses, and increasing up to 600 pptv (compared to more For C2 H6 (Fig. 5e–f), the major plume (orange) is also than 1400 pptv measured) until the middle of the flight. Sec- clearly visible in the GLORIA measurement. However, for ondary maxima that have been measured (magenta and cyan) the simulation, the plume’s shape is not easy to recognize. A are not reproduced by the model. This overall underestima- Atmos. Chem. Phys., 22, 3675–3691, 2022 https://doi.org/10.5194/acp-22-3675-2022
S. Johansson et al.: GLORIA biomass burning measurements and CAMS evaluation                                                     3685

Figure 5. Same as Fig. 4, but for SouthTRAC flight on 7 October 2019. Note that colorbars may have changed compared to Fig. 4.

tion of CAMS C2 H6 is also illustrated by the correlation plots      of HCOOH, while the cyan and magenta maxima are not re-
(Fig. 5g–h).                                                         produced at all. This underestimation in simulated HCOOH
   In Fig. 5i–j, comparisons of GLORIA and CAMS                      of the orange marked plume, and for the cyan marked air
HCOOH are shown. The measurements again show the large               masses in particular is also visible in the correlation plots
plume (orange, up to 500 pptv) and a strong enhancement              (Fig. 5k–l).
with a smaller extent above cloud top altitude (cyan, up to             In contrast to C2 H6 and HCOOH, CH3 OH is overesti-
800 pptv) and above (magenta, up to 300 pptv). However,              mated by the CAMS model (Fig. 5m–n). The major plume
CAMS is only able to reproduce the orange marked plume               (orange) is measured with up to 4000 pptv, while CAMS
with considerably smaller absolute VMRs, below 200 pptv,             simulation results show more than 5000 pptv of CH3 OH.

https://doi.org/10.5194/acp-22-3675-2022                                              Atmos. Chem. Phys., 22, 3675–3691, 2022
3686                                   S. Johansson et al.: GLORIA biomass burning measurements and CAMS evaluation

Secondary maxima (cyan and magenta) are measured for              intermediate) causes too much washout of HCOOH and too
CH3 OH, but cannot be distinguished from the generally too        low HCOOH concentrations overall (Franco et al., 2021).
high background of the simulation results. This is also re-
flected by the correlation plots (Fig. 5o–p), where the overall
overestimation of CH3 OH is illustrated, particularly for the     6   Conclusions
orange marked plume. The cyan marked air masses are, how-
ever, slightly underestimated by CAMS.                            This study discusses simultaneous airborne measurements
   For C2 H4 , only a tiny enhancement of less than 120 pptv      of PAN, C2 H6 , HCOOH, CH3 OH, and C2 H4 measured
is measured by GLORIA within the orange marked plume.             by GLORIA during the SouthTRAC campaign in Septem-
In contrast, CAMS shows large enhancements of up to more          ber and October 2019. Both research flights discussed were
than 600 pptv of C2 H4 over the whole orange marked air           performed above the South Atlantic, and revealed different
masses (Fig. 5q–r). This overall overestimation is also re-       two-dimensional vertically resolved distributions of the mul-
flected in the correlation plots (Fig. 5s–t).                     tiple pollution trace gases. While the flight on 8 Septem-
                                                                  ber 2019 revealed a filamentary structure of pollution trace
                                                                  gas enhancements, the flight on 7 October 2019 was char-
5.3    Discussion                                                 acterized by a large plume with high absolute VMRs of
                                                                  all discussed trace gases but C2 H4 . For each flight, two-
The comparisons between measured GLORIA pollution                 dimensional distributions of the discussed trace gases are
trace gas cross sections and CAMS simulation results show         coherent, considering the different atmospheric lifetimes,
that CAMS is able to reproduce observed major plume struc-        showing the good quality of the GLORIA measurements.
tures. For PAN, absolute VMRs reveal a reasonable agree-             The analysis of the horizontal components of HYS-
ment, while C2 H6 and HCOOH are underestimated, and               PLIT backward trajectories starting at GLORIA measure-
CH3 OH and C2 H4 are overestimated by the model. The over-        ment geolocations with enhanced pollution trace gas VMRs
all agreement for PAN in space and time, even for most            illustrates that these upper tropospheric air masses mea-
of the small-scale structures measured during the flight on       sured above the South Atlantic reached UTLS altitudes
8 September 2019, indicates the ability of the CAMS model         above South America and Africa. Although on the flight on
to correctly transport the polluted air masses from reasonably    8 September 2019 polluted air masses showed a filamen-
assumed emission sources within the model. This strength of       tary structure and came from both South America and cen-
the CAMS model in reproducing structures of pollution trace       tral Africa, the second flight discussed was characterized by
gases correctly is also demonstrated in the comparison of the     a major plume, from central South America. Smaller pol-
flight on 7 October 2019.                                         luted air masses measured during that flight traveled above
   The underestimation of C2 H6 and HCOOH, and the over-          the South Atlantic for approximately 1 week after they were
estimation of CH3 OH and C2 H4 may be for several reasons.        released either from South America or Africa. This trajectory
The composition of polluted air masses is difficult to esti-      analysis also helps to explain the enhancements of C2 H4 ,
mate a priori, leading to possibly erroneous trace gas emis-      which were only observed in some of the places where peaks
sions used by the model (Flemming et al., 2015). The GFAS         in other measured pollution trace gases were found. From
emission inventory, which is used by CAMS for biomass             the trajectory analysis, it is confirmed that these air masses
burning emissions, assimilates fire radiative power from the      with the enhanced shorter-lived substance C2 H4 , have been
MODIS satellite observations, and provides emissions for 40       recently released in South America and have not traveled for
gas phase and aerosol species according to emission factors       long distances.
from literature (Kaiser et al., 2012). This approach may re-         The comparison of the GLORIA cross sections with inter-
sult in a good representation of location and time of the emis-   polated CAMS reanalysis data illustrates the strength of the
sions, but may also result in emission strengths that are bet-    CAMS model to reproduce measured PAN VMR distribu-
ter for some species than for others. Such emission factors       tions. For PAN, structures and absolute VMRs are repeated
could be improved by comparing them to other emission data        by the model as expected for the given model resolution.
sets, such as emissions, derived from satellite measurements      This is in line with results from Wang et al. (2020) for the
(Stavrakou et al., 2012; Bauwens et al., 2016).                   Northern Hemisphere. Structures of CAMS C2 H6 are over-
   Further, atmospheric lifetimes may be influenced by un-        all in agreement with GLORIA for both discussed research
certain or incomplete reaction properties of source and loss      flights, but absolute VMRs are underestimated. This under-
processes within the model. Missing or underestimated at-         estimation of C2 H6 has also been observed in the Northern
mospheric loss processes may result in too large simulated        Hemisphere by Wang et al. (2020). HCOOH is also largely
VMRs, overestimated atmospheric loss processes may result         underestimated by CAMS, which has been observed by Wet-
in too low simulated VMRs. For HCOOH, it is known that            zel et al. (2021) in the Northern Hemisphere, too. During
a common model shortcut (transforming formaldehyde into           the flight on 8 September 2019, enhancements of the model
HCOOH inside clouds without considering methanediol as            HCOOH data were so low that it is not possible to distin-

Atmos. Chem. Phys., 22, 3675–3691, 2022                                            https://doi.org/10.5194/acp-22-3675-2022
S. Johansson et al.: GLORIA biomass burning measurements and CAMS evaluation 3687
guish those from typical background VMRs. Simulations copernicus.eu, last access 20 January 2022) (Copernicus Atmo-
for the flight on 7 October 2019 were able to reproduce sphere Data Storage, 2022).
the large plume of HCOOH qualitatively, but with consider-
ably low absolute VMRs. As discussed, this underestimation
of HCOOH by the model is possibly caused by a shortcut Supplement. The supplement related to this article is available
of HCOOH chemistry in clouds (see Franco et al., 2021). online at: https://doi.org/10.5194/acp-22-3675-2022-supplement.
CH3 OH, in contrast, is overestimated by the model, for both,
peak and background VMRs. Structures measured by GLO-
RIA are, however, reproduced by CAMS. This indicates that Author contributions. SJ initiated the study, performed the anal-
yses, and wrote the manuscript. GW, MH, JU, AK, NG, and SJ per-
surface emission locations are simulated correctly, but emis-
formed the GLORIA data processing. FFV, TN and coworkers oper-
sion strength might be overestimated, or a missing or under- ated GLORIA during the SouthTRAC campaign. BMS and cowork-
estimated atmospheric sink may cause this simulated overes- ers coordinated the SouthTRAC campaign. All authors commented
timation in CH3 OH. Such a missing atmospheric sink would on and improved the manuscript.
also influence its estimated atmospheric lifetime. For C2 H4 ,
CAMS is able to simulate the measured filaments of the flight
on 8 September 2019, but overestimates the absolute VMR Competing interests. The contact author has declared that nei-
and shows an enhancement at air masses that do not have ob- ther they nor their co-authors have any competing interests
served elevated VMRs. CAMS correctly shows no enhance-
ment of C2 H4 for parts of the flight, where GLORIA mea-
surements do not indicate enhancements. This is in contrast Disclaimer. Publisher’s note: Copernicus Publications remains
to the flight on 7 October 2019, where CAMS showed strong neutral with regard to jurisdictional claims in published maps and
enhancements within the large plume, which was measured institutional affiliations.
for all trace gases but C2 H4 . Overall, CAMS also overesti-
mates absolute VMRs of C2 H4 .
In summary, we find that PAN is simulated remarkably Acknowledgements. We gratefully thank the SouthTRAC coor-
well by the model, and that for the other discussed trace dination team, in particular DLR-FX for successfully conducting
the field campaign. The results are based on the efforts of all mem-
gases measured structures are reproduced well overall. This
bers of the GLORIA team, including the technology institutes ZEA-
indicates that the location of the emission sources and the at-
1 and ZEA-2 at Forschungszentrum Jülich and the Institute for Data
mospheric dynamics of the CAMS model perform well. For Processing and Electronics at the Karlsruhe Institute of Technol-
PAN, the emission strengths of precursor gases, and atmo- ogy. We thank ECMWF for providing CAMS data. The authors
spheric gain and loss processes of the model enable CAMS to acknowledge the NOAA Air Resources Laboratory (ARL) for the
reproduce observed distributions that quantitatively compare provision of the HYSPLIT transport and dispersion model used in
with the GLORIA measurements. However, for the other dis- this publication. We acknowledge support by the KIT-Publication
cussed pollution trace gases, absolute VMRs are not in agree- Fund of the Karlsruhe Institute of Technology.
ment with the GLORIA observations. It is suggested that
emissions strengths and atmospheric source and loss pro-
cesses for these species could be improved in CAMS. In Financial support. This research has been funded by the German
particular, for HCOOH, known problems should be avoided Research Foundation (Deutsche Forschungsgemeinschaft, DFG
by not using the common model shortcut. Further, emission Priority Program SPP 1294).
fluxes from the GFAS emission inventory, which is used by
The article processing charges for this open-access
CAMS, could be compared to other emission data sets to publication were covered by the Karlsruhe Institute
improve emission factors within GFAS for C2 H6 , HCOOH, of Technology (KIT).
C2 H4 , and CH3 OH. Our comparison with CAMS shows the
strength of high resolution altitude resolved measurements of
multiple species in order to find strengths and deficiencies of Review statement. This paper was edited by Andreas Engel and
atmospheric models. reviewed by two anonymous referees.
Data availability. GLORIA measurements are available in the
database HALO-DB (https://halo-db.pa.op.dlr.de/mission/116, last References
access: 20 January 2022, HALO consortium, 2016) and on the
KITopen repository (https://doi.org/10.5445/IR/1000142148, Jo- Abram, N. J., Henley, B. J., Sen Gupta, A., Lippmann, T. J. R.,
hansson et al., 2022). The CAMS model data is available from Clarke, H., Dowdy, A. J., Sharples, J. J., Nolan, R. H., Zhang,
the Copernicus Atmosphere Data Store (https://ads.atmosphere. T., Wooster, M. J., Wurtzel, J. B., Meissner, K. J., Pitman,
A. J., Ukkola, A. M., Murphy, B. P., Tapper, N. J., and Boer,
M. M.: Connections of climate change and variability to large
https://doi.org/10.5194/acp-22-3675-2022 Atmos. Chem. Phys., 22, 3675–3691, 20223688 S. Johansson et al.: GLORIA biomass burning measurements and CAMS evaluation and extreme forest fires in southeast Australia, Communications Emission Spectrometer: A scoping study, Atmos. Environ., 141, Earth & Environment, 2, 8, https://doi.org/10.1038/s43247-020- 388–393, https://doi.org/10.1016/j.atmosenv.2016.07.009, 2016. 00065-8, 2021. Dufour, G., Szopa, S., Hauglustaine, D. A., Boone, C. D., Rinsland, Akherati, A., He, Y., Coggon, M. M., Koss, A. R., Hodshire, A. L., C. P., and Bernath, P. F.: The influence of biogenic emissions Sekimoto, K., Warneke, C., de Gouw, J., Yee, L., Seinfeld, on upper-tropospheric methanol as revealed from space, Atmos. J. H., Onasch, T. B., Herndon, S. C., Knighton, W. B., Cappa, Chem. Phys., 7, 6119–6129, https://doi.org/10.5194/acp-7-6119- C. D., Kleeman, M. J., Lim, C. Y., Kroll, J. H., Pierce, J. R., 2007, 2007. and Jathar, S. H.: Oxygenated Aromatic Compounds are Im- Fischer, E. V., Jacob, D. J., Yantosca, R. M., Sulprizio, M. P., portant Precursors of Secondary Organic Aerosol in Biomass- Millet, D. B., Mao, J., Paulot, F., Singh, H. B., Roiger, A., Burning Emissions, Environ. Sci. Technol., 54, 8568–8579, Ries, L., Talbot, R. W., Dzepina, K., and Pandey Deolal, https://doi.org/10.1021/acs.est.0c01345, 2020. S.: Atmospheric peroxyacetyl nitrate (PAN): a global budget Andreae, M. O. and Merlet, P.: Emission of trace gases and aerosols and source attribution, Atmos. Chem. Phys., 14, 2679–2698, from biomass burning, Global Biogeochem. Cy., 15, 955–966, https://doi.org/10.5194/acp-14-2679-2014, 2014. https://doi.org/10.1029/2000GB001382, 2001. Flemming, J., Huijnen, V., Arteta, J., Bechtold, P., Beljaars, A., Bates, K. H., Jacob, D. J., Wang, S., Hornbrook, R. S., Blechschmidt, A.-M., Diamantakis, M., Engelen, R. J., Gaudel, Apel, E. C., Kim, M. J., Millet, D. B., Wells, K. C., A., Inness, A., Jones, L., Josse, B., Katragkou, E., Marecal, Chen, X., Brewer, J. F., Ray, E. A., Commane, R., Diskin, V., Peuch, V.-H., Richter, A., Schultz, M. G., Stein, O., and G. S., and Wofsy, S. C.: The Global Budget of Atmospheric Tsikerdekis, A.: Tropospheric chemistry in the Integrated Fore- Methanol: New Constraints on Secondary, Oceanic, and Terres- casting System of ECMWF, Geosci. Model Dev., 8, 975–1003, trial Sources, J. Geophys. Res.-Atmos., 126, e2020JD033439, https://doi.org/10.5194/gmd-8-975-2015, 2015. https://doi.org/10.1029/2020JD033439, 2021. Franco, B., Clarisse, L., Stavrakou, T., Müller, J., van Damme, M., Bauwens, M., Stavrakou, T., Müller, J.-F., De Smedt, I., Van Whitburn, S., Hadji-Lazaro, J., Hurtmans, D., Taraborrelli, D., Roozendael, M., van der Werf, G. R., Wiedinmyer, C., Kaiser, Clerbaux, C., and Coheur, P.: A General Framework for Global J. W., Sindelarova, K., and Guenther, A.: Nine years of global Retrievals of Trace Gases From IASI: Application to Methanol, hydrocarbon emissions based on source inversion of OMI Formic Acid, and PAN, J. Geophys. Res.-Atmos., 123, 13963– formaldehyde observations, Atmos. Chem. Phys., 16, 10133– 13984, https://doi.org/10.1029/2018JD029633, 2018. 10158, https://doi.org/10.5194/acp-16-10133-2016, 2016. Franco, B., Blumenstock, T., Cho, C., Clarisse, L., Clerbaux, C., Bourgeois, I., Peischl, J., Neuman, J. A., Brown, S. S., Thomp- Coheur, P.-F., Mazière, M. D., de Smedt, I., Dorn, H.-P., Em- son, C. R., Aikin, K. C., Allen, H. M., Angot, H., Apel, E. C., merichs, T., Fuchs, H., Gkatzelis, G., Griffith, D. W. T., Gromov, Baublitz, C. B., Brewer, J. F., Campuzano-Jost, P., Commane, R., S., Hannigan, J. W., Hase, F., Hohaus, T., Jones, N., Kerkweg, Crounse, J. D., Daube, B. C., DiGangi, J. P., Diskin, G. S., Em- A., Kiendler-Scharr, A., Lutsch, E., Mahieu, E., Novelli, A., Or- mons, L. K., Fiore, A. M., Gkatzelis, G. I., Hills, A., Hornbrook, tega, I., Paton-Walsh, C., Pommier, M., Pozzer, A., Reimer, D., R. S., Huey, L. G., Jimenez, J. L., Kim, M., Lacey, F., McKain, Rosanka, S., Sander, R., Schneider, M., Strong, K., Tillmann, R., K., Murray, L. T., Nault, B. A., Parrish, D. D., Ray, E., Sweeney, van Roozendael, M., Vereecken, L., Vigouroux, C., Wahner, A., C., Tanner, D., Wofsy, S. C., and Ryerson, T. B.: Large contribu- and Taraborrelli, D.: Ubiquitous atmospheric production of or- tion of biomass burning emissions to ozone throughout the global ganic acids mediated by cloud droplets, Nature, 593, 233–237, remote troposphere, P. Natl. Acad. Sci. USA, 118, e2109628118, https://doi.org/10.1038/s41586-021-03462-x, 2021. https://doi.org/10.1073/pnas.2109628118, 2021. Friedl-Vallon, F., Gulde, T., Hase, F., Kleinert, A., Kulessa, T., Bozem, H., Butler, T. M., Lawrence, M. G., Harder, H., Maucher, G., Neubert, T., Olschewski, F., Piesch, C., Preusse, P., Martinez, M., Kubistin, D., Lelieveld, J., and Fischer, H.: Rongen, H., Sartorius, C., Schneider, H., Schönfeld, A., Tan, V., Chemical processes related to net ozone tendencies in the Bayer, N., Blank, J., Dapp, R., Ebersoldt, A., Fischer, H., Graf, free troposphere, Atmos. Chem. Phys., 17, 10565–10582, F., Guggenmoser, T., Höpfner, M., Kaufmann, M., Kretschmer, https://doi.org/10.5194/acp-17-10565-2017, 2017. E., Latzko, T., Nordmeyer, H., Oelhaf, H., Orphal, J., Riese, M., Coheur, P.-F., Herbin, H., Clerbaux, C., Hurtmans, D., Wespes, Schardt, G., Schillings, J., Sha, M. K., Suminska-Ebersoldt, O., C., Carleer, M., Turquety, S., Rinsland, C. P., Remedios, J., and Ungermann, J.: Instrument concept of the imaging Fourier Hauglustaine, D., Boone, C. D., and Bernath, P. F.: ACE-FTS transform spectrometer GLORIA, Atmos. Meas. Tech., 7, 3565– observation of a young biomass burning plume: first reported 3577, https://doi.org/10.5194/amt-7-3565-2014, 2014. measurements of C2 H4 , C3 H6 O, H2 CO and PAN by infrared Gettelman, A., Hoor, P., Pan, L. L., Randel, W. J., Hegglin, occultation from space, Atmos. Chem. Phys., 7, 5437–5446, M. I., and Birner, T.: The extratropical Upper Troposphere https://doi.org/10.5194/acp-7-5437-2007, 2007. and Lower Stratosphere, Rev. Geophys., 49, 2011RG000355, Coheur, P.-F., Clarisse, L., Turquety, S., Hurtmans, D., and Cler- https://doi.org/10.1029/2011RG000355, 2011. baux, C.: IASI measurements of reactive trace species in Giglio, L.: MODIS/Aqua+Terra Thermal Anomalies/Fire locations biomass burning plumes, Atmos. Chem. Phys., 9, 5655–5667, 1 km FIRMS V006 and V0061 (Vector data), NASA [data set], https://doi.org/10.5194/acp-9-5655-2009, 2009. https://doi.org/10.5067/FIRMS/MODIS/MCD14ML, 2000. Copernicus Atmosphere Data Storage: CAMS global reanal- Glatthor, N., von Clarmann, T., Fischer, H., Funke, B., Grabowski, ysis (EAC4), Copernicus [data set], https://ads.atmosphere. U., Höpfner, M., Kellmann, S., Kiefer, M., Linden, A., Milz, copernicus.eu/, last access: 20 January 2022. M., Steck, T., and Stiller, G. P.: Global peroxyacetyl nitrate Dolan, W., Payne, V. H., Kualwik, S. S., and Bowman, K. W.: Satel- (PAN) retrieval in the upper troposphere from limb emission lite observations of ethylene (C2 H4 ) from the Aura Tropospheric spectra of the Michelson Interferometer for Passive Atmo- Atmos. Chem. Phys., 22, 3675–3691, 2022 https://doi.org/10.5194/acp-22-3675-2022
You can also read