Tsunami hazard in Lombok and Bali, Indonesia, due to the Flores back-arc thrust - NHESS
←
→
Page content transcription
If your browser does not render page correctly, please read the page content below
Nat. Hazards Earth Syst. Sci., 22, 1665–1682, 2022
https://doi.org/10.5194/nhess-22-1665-2022
© Author(s) 2022. This work is distributed under
the Creative Commons Attribution 4.0 License.

Tsunami hazard in Lombok and Bali, Indonesia, due to the
Flores back-arc thrust
Raquel P. Felix1 , Judith A. Hubbard1,2 , Kyle E. Bradley1,2 , Karen H. Lythgoe2 , Linlin Li3,4 , and Adam D. Switzer1,2
1 Asian School of the Environment, Nanyang Technological University, Singapore
2 EarthObservatory of Singapore, Nanyang Technological University, Singapore
3 School of Earth Sciences and Engineering, Sun Yat-sen University, Zhuhai, China
4 Southern Marine Science and Engineering Guangdong Laboratory (Zhuhai), Zhuhai, China

Correspondence: Raquel P. Felix (raquelpi001@e.ntu.edu.sg)

Received: 15 November 2021 – Discussion started: 20 November 2021
Revised: 7 April 2022 – Accepted: 25 April 2022 – Published: 18 May 2022

Abstract. The tsunami hazard posed by the Flores back-arc        3–5 m of coseismic slip, Mataram and Denpasar experience
thrust, which runs along the northern coast of the islands       maximum wave heights of ∼ 1.6–2.7 and ∼ 0.6–1.4 m, re-
of Bali and Lombok, Indonesia, is poorly studied compared        spectively. Furthermore, our earthquake models indicate that
to the Sunda Megathrust, situated ∼ 250 km to the south of       both cities would experience coseismic subsidence of 20–
the islands. However, the 2018 Lombok earthquake sequence        40 cm, exacerbating their exposure to both the tsunami and
demonstrated the seismic potential of the western Flores         other coastal hazards. Overall, Mataram is more exposed
Thrust when a fault ramp beneath the island of Lombok rup-       than Denpasar to high tsunami waves arriving quickly from
tured in two Mw 6.9 earthquakes. Although the uplift in these    the fault source. To understand how a tsunami would affect
events mostly occurred below land, the sequence still gen-       Mataram, we model the associated inundation using the 5 m
erated local tsunamis along the northern coast of Lombok.        slip model and show that Mataram is inundated ∼ 55–140 m
Historical records show that the Flores fault system in the      inland along the northern coast and ∼ 230 m along the south-
Lombok and Bali region has generated at least six ≥ Ms 6.5       ern coast, with maximum flow depths of ∼ 2–3 m. Our study
tsunamigenic earthquakes since 1800 CE. Hence, it is impor-      highlights that the early tsunami arrival in Mataram, Lom-
tant to assess the possible tsunami hazard represented by this   bok, gives little time for residents to evacuate. Raising their
fault system. Here, we focus on the submarine fault segment      awareness about the potential for locally generated tsunamis
located between the islands of Lombok and Bali (below the        and the need for evacuation plans is important to help them
Lombok Strait). We assess modeled tsunami patterns gen-          respond immediately after experiencing strong ground shak-
erated by fault slip in six earthquake scenarios (slip of 1–     ing.
5 m, representing Mw 7.2–7.9+) using deterministic model-
ing, with a focus on impacts on the capital cities of Mataram,
Lombok, and Denpasar, Bali, which lie on the coasts fac-
ing the strait. We use a geologically constrained earthquake     1   Introduction
model informed by the Lombok earthquake sequence, to-
gether with a high-resolution bathymetry dataset developed       Tsunamis sourced from back-arc thrust faulting, although
by combining direct measurements from the General Bathy-         not as common as megathrust tsunamis, could also result in
metric Chart of the Oceans (GEBCO) with sounding mea-            fatalities and severe damage and destruction to structures.
surements from the official nautical charts for Indonesia.       Such was the case for the 1991 Mw 7.7 Limon, Costa Rica
Our results show that fault rupture in this region could trig-   (Suárez et al., 1995); 1992 Mw 7.9 Flores Island, Indonesia;
ger a tsunami reaching Mataram in
1666                 R. P. Felix et al.: Tsunami hazard in Lombok and Bali, Indonesia, due to the Flores back-arc thrust

ies have recognized the contribution of crustal earthquakes,      Yang et al., 2020). As the deformation becomes blind from
which includes the back-arc thrusting, in the development of      central Lombok to the west, the thrust zone has been mapped
tsunami hazard assessments (Selva et al., 2016; Grezio et al.,    based on folds visible in seismic reflection data and also man-
2017; Behrens et al., 2021).                                      ifests as a band of steeper north-facing slope on the seafloor
   Here, we assess the deterministic tsunami hazard associ-       (Silver et al., 1983; McCaffrey and Nabelek, 1987; Yang et
ated with the westernmost segment of the Flores Thrust, a         al., 2020). West of Bali, folds are fewer and have little to no
back-arc thrust that extends for >1500 km, accommodating a        seafloor expression (Silver et al., 1983; Fig. 1d), suggesting
portion of the convergence between the Indo-Australian and        that the Flores Thrust terminates at Bali (Yang et al., 2020).
Sunda plates (Fig. 1a). Unlike its eastern segment, where the     However, GPS measurements show that the north–south con-
1992 Mw 7.9 Flores Island earthquake occurred, the west-          vergence rate in Bali (5 ± 0.4 mm yr−1 ) is similar to that for
ern part of the fault has not hosted devastating tsunamis in      onshore Java (6 ± 1 mm yr−1 ); therefore back-arc shortening
recent years, although historical records and previous stud-      may continue across a segment boundary along the Kendeng
ies show that it has generated at least eight tsunamigenic        Thrust in Java (Koulali et al., 2016).
earthquakes (Fig. 1b; NOAA database; Hamzah et al., 2000;
Rastogi and Jaiswal, 2006; Musson, 2012; Nguyen et al.,           1.2   Seismicity of the Flores Thrust
2015; Tsimopoulou et al., 2020). The recent 2018 Lombok
earthquake-triggered tsunamis were relatively minor because       Focal mechanisms show that from February 1976 to Febru-
the earthquakes mostly occurred beneath the island itself and     ary 2021, the Flores Thrust generated 29 Mw 5.5 to 7.8 earth-
not offshore; nevertheless, the occurrence of the 2018 Lom-       quakes within the upper 40 km of the crust (Global Centroid
bok earthquakes gives new insights into the activity and ge-      Moment Tensor Catalog – GCMT; Fig. 1a). Earthquakes in
ometry of this fault segment and highlights the risk of earth-    this region can be caused by either tectonically driven fault
quakes and associated tsunamis along strike.                      slip or volcanic activity. In this back-arc region, most of
   Our study focuses on the tsunami hazard caused by slip         the focal mechanisms are characterized by east–west-striking
on the Flores Thrust in the Lombok Strait, a 20–60 km wide        nodal planes with a fault plane dipping 26 ± 8◦ S; we infer
body of water between the islands of Lombok and Bali that         that these are associated with the Flores Thrust.
connects the Java Sea to the Indian Ocean. Because of its ge-        The activity of this fault system is also testified to by up-
ometry, slip on the thrust in the Lombok Strait could generate    lift recorded on its hanging wall. From eastern Sumbawa
tsunamis that would efficiently propagate southwards and hit      to central Flores, uplift is recorded by elevated terraces on
the west coast of Lombok and the east coast of Bali, where        the northern sides of the islands (Van Bemmelen, 1949). We
their capital cities (Mataram and Denpasar) are located.          suggest that the Quaternary reef terraces in northwest Bali
                                                                  (Boekschoten et al., 2000) are also related to tectonic uplift
1.1    Regional setting                                           above the Flores Thrust system, suggesting that the fault ex-
                                                                  tends all the way to the western coast of the island (Fig. 2).
The islands of Bali and Lombok, east of Java, are part of the        Although the earthquakes in this region are largely consis-
Lesser Sunda Islands (Fig. 1a). They are located along the        tent with tectonic shortening, the active volcanoes not only
volcanic arc of the Java subduction zone, where the NNE-          generate their own seismicity but also play a role in the
moving Indo-Australian Plate subducts beneath the Sunda           horizontal and vertical distribution of fault-generated earth-
Plate (Dewey and Bird, 1970; Hamilton, 1979; Bowin et al.,        quakes (Lythgoe et al., 2021). A relationship between fault-
1980; Silver et al., 1983, 1986; Hall and Spakman, 2015;          ing and volcanic activity was observed for the 2018 Lombok
Koulali et al., 2016). The Java Trench lies ∼ 250 km to the       earthquake sequence, which generated four >Mw 6 events
south. The Flores back-arc thrust belt, on the other hand, fol-   between 28 July and 19 August. These earthquakes did not
lows the northern edge of the islands. Here, the kinematics of    occur offshore on the northern frontal thrust of the Flores
fault slip and folding are consistent with the sense of move-     Thrust but instead involved slip along the deeper part of
ment of the Indo-Australian Plate and associated shortening,      the fault and associated imbricate thrusts beneath Lombok,
indicating that the Flores back-arc thrust also formed to ac-     to the north of the active Rinjani Volcano (Salman et al.,
commodate stress associated with the plate collision (Silver      2020; Yang et al., 2020; Lythgoe et al., 2021). While these
et al., 1983, 1986).                                              earthquakes were not directly caused by volcanic activity,
   The Flores back-arc thrust is an east–west-trending, south-    the presence of the volcano constrained the earthquake dis-
dipping fault zone that extends for >1500 km along strike. It     tribution by elevating the downdip limit of the seismogenic
is composed of two main segments: the Wetar Thrust zone           zone in the crust (Lythgoe et al., 2021). Based on relocated
to the east and the Flores Thrust to the west (Silver et al.,     earthquakes and seismic reflection data analysis, the earth-
1983, 1986; Fig. 1a). From east to west, the Flores Thrust tra-   quakes occurred on the Flores fault ramp, a blind thrust dip-
verses just north of central Flores, Sumbawa, Lombok, and         ping 25◦ S that flattens updip onto the Flores Thrust décolle-
Bali (Fig. 1a). From central Flores to east of Lombok, the        ment at ∼ 6 km depth (Lythgoe et al., 2021; Fig. 1c).
thrust zone reaches to the seafloor (Silver et al., 1983, 1986;

Nat. Hazards Earth Syst. Sci., 22, 1665–1682, 2022                               https://doi.org/10.5194/nhess-22-1665-2022
R. P. Felix et al.: Tsunami hazard in Lombok and Bali, Indonesia, due to the Flores back-arc thrust                                      1667

Figure 1. Regional setting of the Flores Thrust and its subsurface ramp-flat geometry. (a) Circle – the Flores back-arc thrust system, which
is located along the northern edge of the Lesser Sunda Islands. The thrust is composed of two segments: the Wetar Thrust to the east and
the Flores Thrust to the west (black rectangle). Seismicity (USGS earthquake catalog, 1976–2021) and focal mechanism solutions (GCMT,
1976–2021) show that the Flores Thrust is seismically active. The Mw 7.9 Flores Island tsunamigenic earthquake is the largest earthquake on
record for this system and occurred at the eastern end of the thrust. (b) The western part of the Flores Thrust, which has generated historical
tsunamigenic earthquakes (white rectangles; https://www.ngdc.noaa.gov/, last access: 10 September 2021; Hamzah et al., 2000; Rastogi and
Jaiswal, 2006; Musson, 2012; Nguyen et al., 2015; Griffin et al., 2019). Yellow squares and circles: towns where a tsunami was reported
following the 28 July 2018 Mw 6.4 and 5 August 2018 Mw 6.9 events, respectively. Tg – Tanjung; Kn – Kayangan; Lb – Labuhan Pandan;
Lp – Leper. We interpret that the blind ramp mapped at Lombok (Lythgoe et al., 2021) extends westwards based on the seafloor morphology
and uplifted terraces in the northwestern part of Bali (green rectangle; Fig. 2). Basemaps – World Ocean Base. The map extent of (b) reflects
the coverage of grid layer 1 (L1) used in the tsunami modeling. The basemap of (b) with only contour lines overlain is shown in Fig. S1 in
the Supplement. (c) The geometry of the blind fault ramp is constrained by the seismicity of the 2018 Lombok earthquake sequence (Lythgoe
et al., 2021). (d) Gentle folds interpreted by Silver et al. (1983) based on a seismic profile across the Lombok Strait. Below the profile we
show our inferred location for the fault ramp.

1.3   Tsunamigenic earthquakes of the Flores Thrust                       Data Service (2021), https://doi.org/10.7289/V5PN93H7). In
                                                                          addition, in the Lombok Strait, a 1979 Ms 6.6 tsunamigenic
Historical records (NOAA database, https://www.ngdc.noaa.                 earthquake left 200 injured and killed 27 people, although the
gov/, last access: 10 September 2021) and tsunami studies                 tsunami is poorly documented and may have played a minor
(Hamzah et al., 2000; Rastogi and Jaiswal, 2006; Musson,                  role in the destruction (Hamzah et al., 2000).
2012; Nguyen et al., 2015; Griffin et al., 2019) document                    The best-documented tsunamigenic earthquake on the Flo-
at least four tsunamigenic earthquakes on the Flores Thrust,              res Thrust occurred in its far eastern part (Yeh et al., 1993;
in addition to the two earthquakes in 2018, which produced                Imamura and Kikuchi, 1994; Tsuji et al., 1995; Pranantyo et
local inundation (Fig. 1b). Three of these events occurred                al., 2021). The 1992 Mw 7.9 Flores Island earthquake injured
in the western part of the thrust zone, north of Bali. The                2144 people and killed 2080 (Yeh et al., 1993; Tsuji et al.,
oldest event on record is the 1815 Ms 7 earthquake, which                 1995; Fig. 1a). This earthquake occurred at ∼ 16 km depth
triggered a landslide and tsunami; together, these events                 (Beckers and Lay, 1995) and generated a tsunami that propa-
killed >1200 people. NOAA categorizes this as a probable                  gated to the northern coast of Flores Island within 5 min (Yeh
tsunamigenic event, as it is unclear whether the tsunami was              et al., 1993). Field mapping shows that the tsunami inundated
caused only by the coastal landslide or by the earthquake and             the land as far as 600 m, with an average run-up height of ∼ 2
landslide together. The 1857 Ms 7 and 1917 Ms 6.5 events                  to 5 m (elevation reached above sea level). Anomalously high
are described by NOAA as definite and probable tsunami-                   run-up heights of 20–26 m to the northeast may be associated
genic earthquakes, respectively. The 1857 event generated                 with submarine landslides (Yeh et al., 1993).
four consecutive tsunami waves, at least 3 m high, northwest                 The recent 2018 Lombok earthquake sequence occurred
of Flores Island (National Geophysical Data Center/World                  primarily below land, but nevertheless small-scale tsunamis

https://doi.org/10.5194/nhess-22-1665-2022                                        Nat. Hazards Earth Syst. Sci., 22, 1665–1682, 2022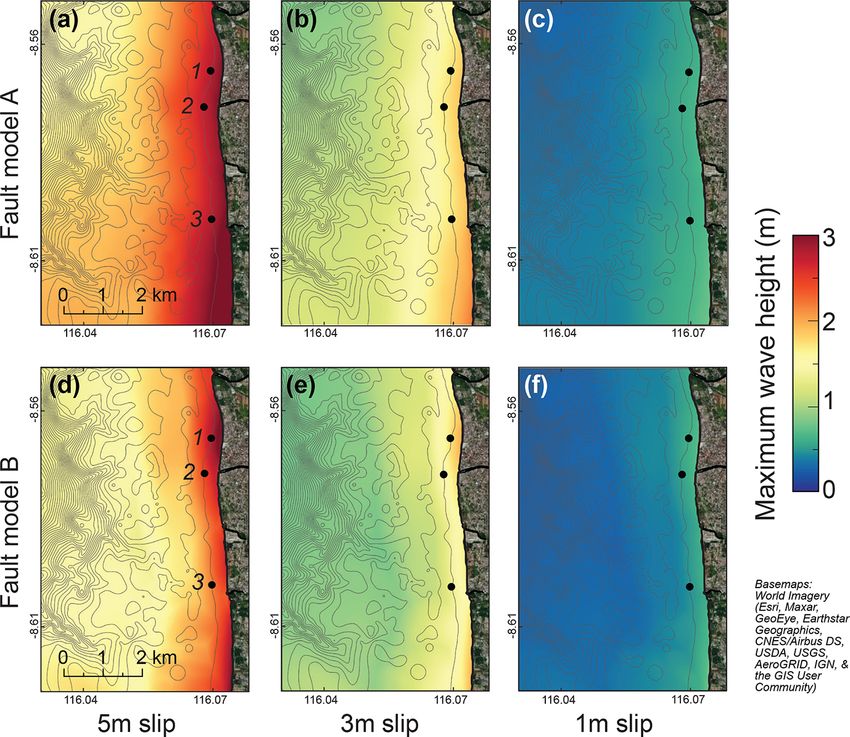
1668                 R. P. Felix et al.: Tsunami hazard in Lombok and Bali, Indonesia, due to the Flores back-arc thrust

were reported by the residents of northern Lombok (Tsi-           the probabilistic tsunami hazard; Pradjoko et al. (2018) con-
mopoulou et al., 2020). When the Mw 6.4 July event oc-            sider a fault that is much too steep and use bathymetry that is
curred, the northern coast of Lombok subsided by ≤ 0.1 m          too coarse to produce reliable results; Wibowo et al. (2021a)
(Wibowo et al., 2021b) and the northeastern coast was hit         do not consider the post-2018 earthquake studies of the fault
by a tsunami at the towns of Labuhan Pandan and Tanjung,          geometry of the Flores Thrust.
which were inundated 10–70 m with run-up heights of ∼ 1–             Rakowsky et al. (2013) studied the sensitivity of inunda-
2.5 m. For the 5 August Mw 6.9 event, although the northern       tion models in the region to the topography and friction pa-
coast was uplifted by ≤ 0.5 m (Wibowo et al., 2021b), the         rameters of the land surface. Their tsunami modeling was
residents of the northwest towns Tanjung and Kayangan re-         done using the ∼ 900 m resolution GEBCO dataset inter-
ported a tsunami that inundated 7–40 m inland with a run-up       polated with measurements from ships and nautical charts;
height of ∼ 1.7–2 m (Fig. 1b).                                    the interpolation method is not described in detail. They
   Together, these records show that the Flores Thrust is ca-     considered a Mw 8.5 earthquake and produced a maximum
pable of generating significant thrust earthquakes with asso-     flow depth (vertical distance between the land and inundat-
ciated land uplift and/or subsidence as well as local tsunamis.   ing water surface) of 10 m, with an inundation extent ranging
The full tsunamigenic potential of this fault system is not       from ∼ 1–1.6 km in Mataram. This earthquake magnitude is
known as the observational window is short compared to            larger than any observed event as the most recent estimates of
typical earthquake recurrence intervals. Here, the observa-       the historical tsunamigenic earthquakes in the Flores Thrust
tional window refers to the historical and seismic records.       range from Mw 6.6 to Mw 8.3 (Griffin et al., 2019), and seis-
To our knowledge, there have been no paleo-tsunami stud-          mic records show that the 1992 Flores Island earthquake is
ies in this area that are associated with the Flores Thrust.      Mw 7.9. They found that inundation distance depended on the
There is a paleo-deposit study in Bali, but it is interpreted     topographic parameters: lower bottom friction or a bare-earth
to be deposited by a tsunami generated by the megathrust          digital terrain model produced higher inundation compared
rupture (Sulaeman, 2018). Hence, we rely only on historical       to higher friction or a digital surface model (with structures,
and seismic records when we refer to a short observational        e.g., houses). Their results highlight the importance of using
window. The tsunami studies related to the Flores Thrust are      an accurate surface model when assessing potential inunda-
limited, and they are about the numerical modeling of the his-    tion.
torical tsunamis. Here, we explore what could happen when            Horspool et al. (2014) focused on probabilistic tsunami
coseismic slip occurs on the Flores Thrust ramp within the        hazard for all of Indonesia. They used a bathymetry dataset
Lombok Strait and how the generated tsunami and coseismic         that combined GEBCO data with measurements from navy
land deformation would together affect the coastal cities of      charts and multibeam surveys. The maximum magnitude cal-
Mataram, Lombok, and Denpasar, Bali.                              culated for the Flores Thrust is Mw 8.1, Mw 8.3, and Mw 8.5
                                                                  for fault dips of 25–27◦ . Their results do not describe the
1.4    Previous tsunami modeling studies                          regional hazard (e.g., wave heights, timing, inundation) but
                                                                  rather assess how much of the local hazard is contributed by
Tsunami modeling studies in this region commonly focus            this fault system rather than the megathrust. They showed
on the segment of the Sunda Megathrust along the Java             that for a 500-year return period, the tsunami hazard in
Trench (Okal and Borrero, 2011; Kurniawan and Laili, 2019;        Mataram is 10 %–30 % most likely due to the shallow part
Suardana et al., 2019; Kardoso and Dewi, 2021) (Fig. 1a),         of the Flores Thrust.
with a few studies evaluating the western segment of the             Pradjoko et al. (2018) used a model of a Mw 6.4 earth-
Flores Thrust (Rusli et al., 2012; Løvholt et al., 2012; Afif     quake to simulate a scenario similar to the 1979 event, which
and Cipta, 2015) and four considering an earthquake sourced       was the largest recorded earthquake in this region prior to the
within the Lombok Strait (Rakowsky et al., 2013; Horspool         2018 Lombok earthquake sequence. They set 2.5 m of fault
et al., 2014; Pradjoko et al., 2018; Wibowo et al., 2021a;        slip on a 72◦ dipping fault (significantly steeper than the 25◦
Fig. 1b). All four studies show tsunami results in Mataram,       dip we interpret for the fault) centered at 25 km depth. Us-
Lombok; however, each study focuses on different aspects          ing GEBCO bathymetry to model tsunami propagation (with
of tsunami modeling and three pre-date the 2018 Lombok            a coarse horizontal resolution of ∼ 900 m), their results in-
earthquake sequence, which illuminated important aspects          dicate that a Mw 6.4 earthquake could generate a 0.13–0.2 m
of the fault geometry. The authors of the only study after        high tsunami wave that arrives at the coast of Mataram ∼ 18–
the 2018 earthquakes (Wibowo et al., 2021a) did not update        20 min after the earthquake.
their fault model to reflect new information about the geom-         The study by Wibowo et al. (2021a) focused on the
etry of the Flores Thrust derived from studies of the 2018        tsunami hazard posed by a Mw 7.4 earthquake on the Flo-
Lombok earthquake sequence. Overall, these prior results do       res Thrust to the northern coasts of Lombok and Bali. The
not address the potential earthquake scenarios that we con-       authors set 2.7 m of slip on a 27◦ dipping fault plane with
sider plausible: Rakowsky et al. (2013) study the sensitivity     dimensions of 75 km × 27 km centered at 27 km depth. The
of inundation to land friction; Horspool et al. (2014) describe   fault parameters they used are based on the mean values of

Nat. Hazards Earth Syst. Sci., 22, 1665–1682, 2022                               https://doi.org/10.5194/nhess-22-1665-2022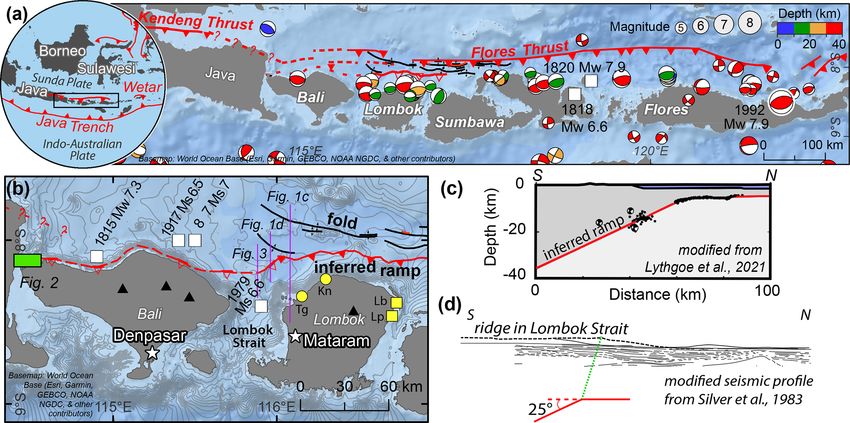
R. P. Felix et al.: Tsunami hazard in Lombok and Bali, Indonesia, due to the Flores back-arc thrust 1669
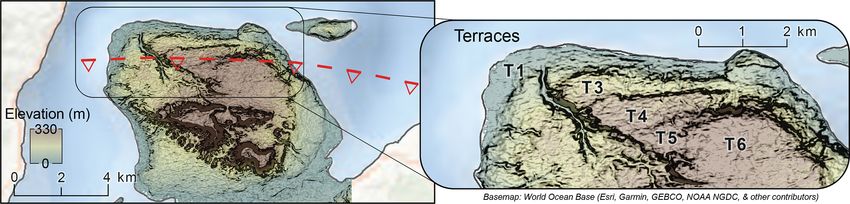
Figure 2. Six coastal terraces (T1–T6) identified using a digital elevation model (DEMNAS) in northwest Bali, likely uplifted due to slip on
the Flores Thrust ramp. The location is shown as a green rectangle on the map in Fig. 1b. Basemap – World Ocean Base.
the earthquake sources in the USGS 1900–2020 earthquake and seismic reflection imaging indicate a blind fault ramp
database. The orientation and depth of the fault are similar to dipping 25◦ S that flattens updip to a décollement at ∼ 6 km
those we use in our modeling, but the updip tip of the fault in depth and continues north below the Bali Sea. The part of
their model is located about 25 km north of the islands rather the thrust ramp that ruptured in the 2018 sequence extends
than along the northern coast of the islands, as we interpret 45 km downdip and 116 km lengthwise (Lythgoe et al., 2021;
from the 2018 Lombok earthquake sequence and bathymetry Figs. 1c and 3).
in the strait. Wibowo et al. (2021a) used the 180 m resolution We use these fault parameters to set up our fault model,
national bathymetry of Indonesia (BATNAS) dataset as input choosing a fault with an east–west strike, similar to the gen-
bathymetry in the numerical simulations. Their focus was on eral trend of the Flores Thrust, positioned across the Lom-
the impact along the northern coasts, but they note that the bok Strait. The complete parameters are listed in Table 1. We
tsunami arrives in Mataram and Denpasar in 9 and 25 min, are not trying to replicate the 2018 earthquakes but rather
respectively. They also find that the maximum wave height is consider an earthquake on the neighboring part of the fault
1.5 m in Mataram and 1 m in Denpasar. that did not rupture in that sequence. The eastern boundary
Following the 2018 Lombok earthquake sequence, we now of the fault model slightly overlaps with the western limit
have a more accurate understanding of the location and sub- of the 2018 earthquake sequence. Such overlapping ruptures
surface geometry of the Flores Thrust in this region. Hence, have been observed in the Kuril Trench (Ammon et al., 2008)
the earthquake models we use in our study are geologically and Peru–Chile Trench (Bilek, 2010). We extend the west-
well-constrained. In addition, since tsunami propagation in ern edge of the model to below the eastern edge of Bali in
shallow water depends strongly on the bathymetry, we de- order to span the width of the Strait; the fault likely contin-
velop and incorporate a new bathymetric model by combin- ues further west (as evidenced by uplifted terraces and seis-
ing the GEBCO dataset with sounding measurements from micity), but rupture to the west would occur below land and
the official nautical chart for Indonesia. This is particularly would not contribute to a tsunami. As there is limited avail-
important along the shallow coast, where seafloor roughness able information on the structural geology and the seismicity
is a strong control on wave propagation. In our study, we of the Flores Thrust in this region and there are limited data
show the tsunami results from six different earthquake sce- within the strait to assess the continuity of the fault, there
narios within the Lombok Strait, highlighting impacts on the is no reason to believe that there are significant structural
populated capital cities of Mataram, Lombok, and Denpasar, variations along strike. The focal mechanisms for the events
Bali, as both cities face the strait. We also calculate the co- near Bali have very similar strike and dip to those at Lombok
seismic uplift and subsidence for varying slip amounts and (Fig. 1a). When varying the fault dips to 18 and 34◦ , repre-
report this together with the tsunami time history and pat- senting the minimum and the maximum limits of the fault dip
tern and the maximum wave height. An inundation scenario uncertainty, they have minimal impact on the tsunami model.
is also included for the city of Mataram. The tsunami energies inherent in these two models are only
5 %–8 % different from the energy of our model with a 25◦
fault dip (Felix et al., 2021). Hence, minor structural varia-
2 Methodology tions would result in minor changes in arrival times and wave
heights but would not be likely to have a strong effect on our
2.1 Fault model setup results.
We trace the upper blind tip of the fault ramp following the
The 2018 Lombok earthquake sequence illuminated the ge- southern edge of a north-facing seafloor slope. This surface
ometry of the Flores Thrust beneath Lombok (Fig. 1c). To- morphology coincides with folding interpreted from seismic
gether, relocated aftershocks, earthquake slip distributions, reflection surveys (Silver et al., 1983; Yang et al., 2020), and
https://doi.org/10.5194/nhess-22-1665-2022 Nat. Hazards Earth Syst. Sci., 22, 1665–1682, 2022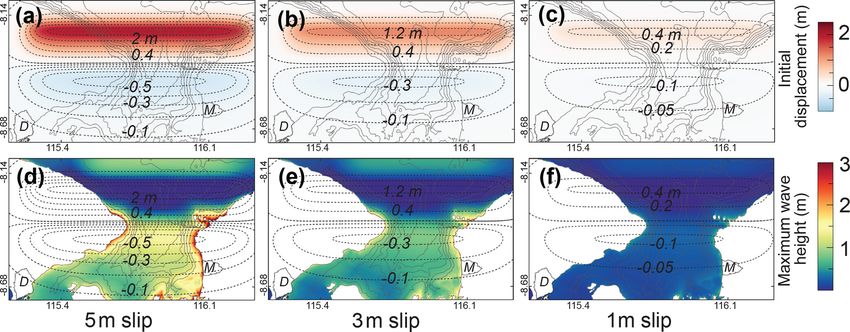
1670                   R. P. Felix et al.: Tsunami hazard in Lombok and Bali, Indonesia, due to the Flores back-arc thrust

Table 1. Parameters of fault models A and B used in the numerical       et al., 2019). Using the scaling relationship for the magni-
modeling.                                                               tude and slip of shallow crustal reverse faulting by Thing-
                                                                        baijam et al. (2017), these earthquake magnitudes have av-
       Parameters            Fault model A      Fault model B           erage slip ranging from 1 to 5 m. In order to represent this
       Epicenter longitude        115.77◦ E      115.77◦ E              range, we use the minimum (1 m), the mid-range (3 m), and
       Epicenter latitude         8.3821◦ S      8.2905◦ S              the maximum (5 m) slip values in our modeling. In the sub-
       Focal depth                  15.5 km        10.8 km              sequent texts, we refer to these slip models as A-1, A-3,
       Width                          45 km        22.5 km              and A-5 for fault model A and B-1, B-3, and B-5 for fault
       Length                             116 km                        model B. We note that although modeling with more com-
       Strike                              90◦ E                        plex rupture scenarios would perhaps be a more detailed op-
       Dip                                 25◦ S                        tion (e.g., Serra et al., 2021), the current information that we
       Rake                                 90◦                         have about the Flores Thrust in the Bali and Lombok region
                                                                        is limited. Hence, we think that it is better to use a planar
                                                                        fault model and uniform slip to lessen the use of random pa-
                                                                        rameters that could increase the uncertainty in the results. We
                                                                        also note that although probabilistic approaches are becom-
                                                                        ing more common, the deterministic method is still included
                                                                        in recent tsunami hazard studies (e.g., Wronna et al., 2015;
                                                                        Roshan et al., 2016; Gonzáles et al., 2017; Escobar et al.,
                                                                        2020; Rashidi et al., 2020, 2022; El-Hussain et al., 2021).
                                                                           In order to focus on the impact of tsunami generation, we
                                                                        include only slip on the fault ramp (no slip transferred onto
                                                                        the northern décollement). This updip termination of slip was
Figure 3. Profile of the fault geometry used in the tsunami modeling    observed in the Lombok sequence (Lythgoe et al., 2021) and
relative to the seafloor ridge. We study two fault slip models: model   is therefore realistic in our region to the west as well. Al-
A (whole-ramp rupture) and model B (slip only on the upper half of      though we consider uniform slip, earthquake slip is known
the ramp). The location of the profile is shown in Fig. 1b.             to be spatially variable and in particular to taper around the
                                                                        edges of the slip patch. We evaluate the impact of this taper
                                                                        on the initial seafloor deformation using Green’s function for
we interpret that the folding formed due to slip across a bend          rectangular dislocations (Okada, 1992) in the code Unicycle
at the upper tip of the blind fault ramp (Fig. 1b). We ex-              (Moore et al., 2019); we find that tapering the slip slightly
tend the fault ramp to a depth of 25 km below the seafloor,             modifies the uplift profile by broadening it and shifting it
which represents the maximum seismogenic depth in this re-              to the south (downdip direction) but does not significantly
gion based on historical seismic records and the maximum                change the model (Fig. 4).
depth of seismicity observed in the 2018 sequence (Lythgoe                 To better translate the models into equivalent earthquakes,
et al., 2021).                                                          we calculate the equivalent moment magnitude (Mw ) for
   We model two fault ruptures on this fault (models A and              each modeled event, using a rigidity of 35 and 30 GPa for
B, Fig. 3). Model A consists of a whole-fault rupture, while            models A and B, respectively. These are the mean rigidi-
model B allows only the upper half of the ramp to slip. This            ties calculated from the values, presented in Sallarès and
second model represents a scenario similar to the 2018 Lom-             Ranero (2019) and Sallarès et al. (2021), every 1 km interval
bok earthquakes, where most of the slip occurred on the shal-           from 6 to 25 km depth for model A and from 6 to 15.5 km
low part of the fault ramp. However, the maximum rupture                depth for model B. Since model A has a wider fault surface,
depth at Lombok was interpreted to be limited by the ele-               for the same amount of slip, it produces larger magnitudes
vated geothermal gradient associated with the volcano. In the           compared to model B (Table 2). In each model, we consider
Lombok Strait, there is no such volcano; thus, it is likely that        only the part of the fault that lies below the Lombok Strait
slip within the Lombok Strait could reach deeper due to the             since this is the part of the fault that is submarine and there-
colder geothermal gradient.                                             fore capable of generating tsunamis. We note that an earth-
                                                                        quake rupturing this fault segment could involve slip further
2.2    Slip model                                                       along strike, either to the west (below Bali) or to the east
                                                                        (below Lombok, although this part of the fault recently rup-
For both model A and model B, we consider three determin-               tured in multiple earthquakes and is less likely to slip again).
istic scenarios with uniform slip of 1, 3, and 5 m (six scenar-         Indeed, reaching 5 m of slip within the Lombok Strait alone
ios total). The modeled historical tsunamigenic earthquakes             would likely require a longer rupture and therefore a larger
in the Flores Thrust are estimated to have magnitudes ranging           magnitude than the values reported in Table 2, given known
from Mw 6.7 to Mw 8.5 (NOAA; Musson et al., 2019; Griffin

Nat. Hazards Earth Syst. Sci., 22, 1665–1682, 2022                                     https://doi.org/10.5194/nhess-22-1665-2022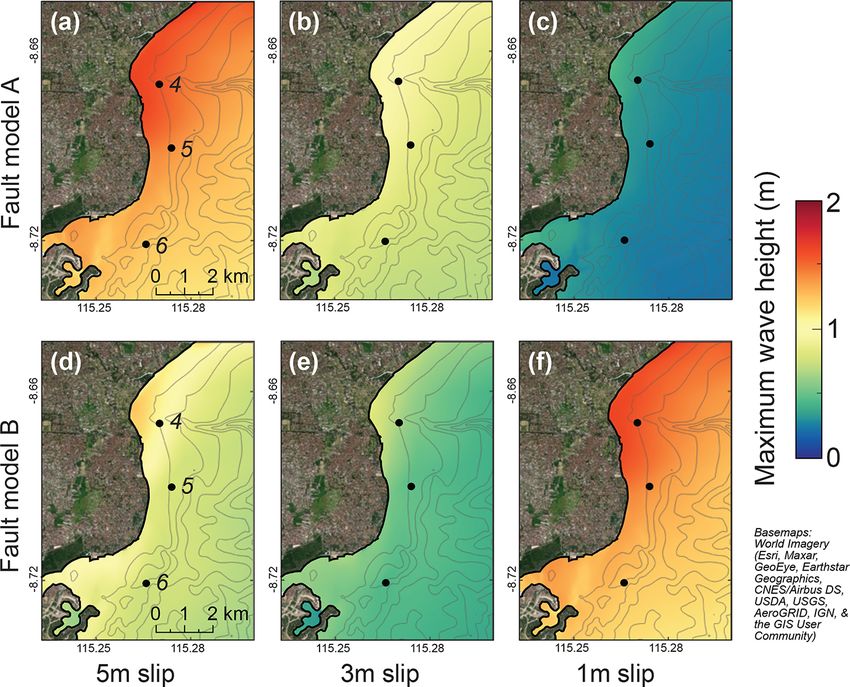
R. P. Felix et al.: Tsunami hazard in Lombok and Bali, Indonesia, due to the Flores back-arc thrust                                   1671

                                                                          ber 2021) because these are publicly available and have
                                                                          wide coverage. However, these datasets have an artificially
                                                                          smooth seafloor (Marks and Smith, 2006), especially at shal-
                                                                          low depths, because of the low density of interpolated points
                                                                          (e.g., Fig. 5). In local tsunami studies, the detailed seafloor
                                                                          morphology in shallow water is critical since seafloor rough-
                                                                          ness in these regions has nonlinear effects on wave propaga-
                                                                          tion (Wang and Power, 2011). Kulikov et al. (2016) demon-
                                                                          strated that tsunami propagation modeled using the GEBCO
                                                                          dataset results in substantial errors in the estimation of wave
                                                                          propagation.
                                                                             We generate a high-resolution bathymetric model of the
                                                                          region of interest by combining water depth measurements
                                                                          from GEBCO with sounding measurements from the offi-
                                                                          cial nautical charts of Indonesia (http://hdc.pushidrosal.id/,
Figure 4. Influence of tapering the updip slip on seafloor deforma-       last access: 20 August 2021). The publicly available GEBCO
tion. The maximum slip varies across the models in order to pre-          dataset not only is provided as an interpolated raster but
serve the mean slip. (a) The seafloor deformation profiles have sim-      also includes the original data points used for interpolation.
ilar amplitudes and shapes with slightly offset peaks, even for very      These data points (water depths) are derived from a variety of
significant tapers. (b) Different slip tapers considered. A more grad-
                                                                          sources, both direct (echo soundings, seismic reflection, iso-
ual taper (red shades) shifts the peak uplift in the downdip direction
of the fault ramp. A more abrupt slip taper (blue shades) shifts the
                                                                          lated soundings, electronic navigation chart soundings) and
peak uplift towards the upper fault bend.                                 indirect (e.g., satellite altimetry, flight-derived gravity data).
                                                                          Using the Type Identifier Grid file from GEBCO, which in-
                                                                          cludes the source of the depth data, we identify and ex-
Table 2. Equivalent moment magnitudes (Mw ) for models A and              tract only the water depths acquired by direct measurement
B for a given slip amount. Model A ruptures the full ramp, while
                                                                          (Fig. 5).
model B ruptures only the upper half of the ramp. Both models have
                                                                             The GEBCO data in this region are concentrated along the
a fault length of 116 km. The magnitudes here are minima as each
of these events could also include slip on the along-strike part of the   heavily traveled ship tracks between the islands of Bali and
fault.                                                                    Lombok and are too low resolution near the coasts to accu-
                                                                          rately model tsunami propagation and wave heights (Fig. 5a).
                           Model A                  Model B               We improve the resolution of our bathymetry by digitizing
                 Fault width: 45 km     Fault width: 22.5 km              sounding data from the official nautical charts of Indone-
                                                                          sia, which are densest in the coastal regions near the cities
      Slip (m)                         Mw
                                                                          of Denpasar (Bali) and Mataram (Lombok) and therefore
      1                          7.5                       7.2            critical for modeling nearshore wave heights in these re-
      3                          7.8                       7.5            gions (Fig. 5b). We also trace the coastline using the na-
      5                          7.9                       7.7            tional digital elevation model (DEMNAS, http://tides.big.
                                                                          go.id/DEMNAS/, last access: 20 August 2021) and cross-
                                                                          check it using satellite images from Esri World Imagery
scaling relationships between the fault area and coseismic                (https://www.arcgis.com/, last access: 20 August 2021).
slip (Thingbaijam et al., 2017).                                             We combine the water depth measurements from both
                                                                          sources and the coastlines into a single dataset and then in-
2.3       Bathymetry                                                      terpolate the data using the “Topo to Raster” tool in ArcGIS.
                                                                          This tool is based on the ANUDEM program developed by
Accurate modeling of tsunami wave propagation requires a                  Hutchinson (1989) and generates a continuous digital eleva-
high-resolution bathymetric map, especially in shallow wa-                tion model based on point data that takes into account the
ter. By using detailed bathymetry together with a fine grid               hydrological correctness of the resulting raster. While this
size, modeled simulations of tsunami wave heights have been               method was developed on the basis of subaerial water flow, it
shown to effectively match real near-coast waveforms (Sa-                 has also been used to effectively generate bathymetries for
take, 1995). However, in many parts of the world, high-                   tsunami studies in other regions (Fraser et al., 2014; Dar-
resolution bathymetric data are unavailable. In general, re-              mawan et al., 2020; Wilson and Power, 2020). We note that
gional tsunami studies use only one bathymetric dataset                   the shallow shelf regions of the Lombok Strait were likely
(e.g., Satake, 1988), commonly either ETOPO (https://www.                 incised subaerially during the Late Holocene sea-level drop
ngdc.noaa.gov/mgg/global/, last access: 5 September 2021)                 (Boekschoten et al., 2000), and their morphologies therefore
or GEBCO (https://www.gebco.net/, last access: 5 Septem-                  likely reflect subaerial water flow processes.

https://doi.org/10.5194/nhess-22-1665-2022                                       Nat. Hazards Earth Syst. Sci., 22, 1665–1682, 2022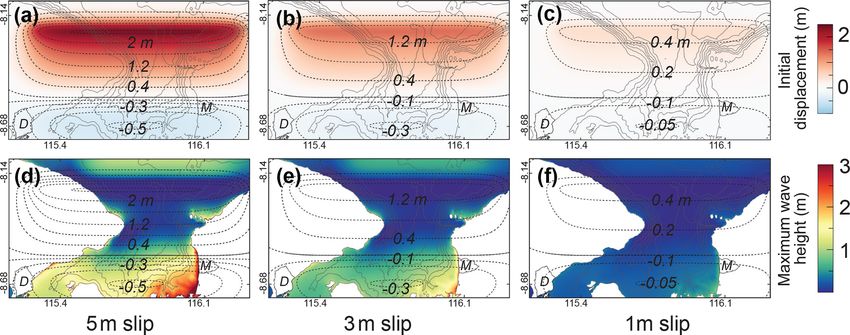
1672                  R. P. Felix et al.: Tsunami hazard in Lombok and Bali, Indonesia, due to the Flores back-arc thrust

Figure 5. Comparison of the point density of water depth measurements from (a) GEBCO (direct measurements) and (b) nautical charts
(soundings). GEBCO data are densest along the center of the Lombok Strait (following ship tracks), while the nautical chart soundings
are concentrated near the coastal cities. Combining these data points enhances the accuracy of the resulting bathymetry (shown in Fig. 6).
Crosses – locations of measurements. Polygons on land – cities of Denpasar, Bali, and Mataram, Lombok. D denotes Denpasar; M denotes
Mataram.

   We set the resolution of our interpolated raster to 30 m as         terface. To match the resolution of the DEMNAS–DSM, we
this is similar to the mean distance between the data points           generate another bathymetry model with 1.5 m resolution in
along the coasts of Mataram (∼ 27 m) and Denpasar (∼                   the Mataram region using the same Topo to Raster interpola-
36 m). Our final bathymetry represents a reasonable balance            tion method as used previously for the bathymetry. We match
between achievable accuracy at shallow depths and computa-             the coastlines of the two datasets to generate the final com-
tional efficiency. We validate the interpolated bathymetry by          bined model.
comparing its values with the source data; the mean differ-
ence in the shallow regions offshore Mataram and Denpasar              2.5   Tsunami modeling using COMCOT
is
R. P. Felix et al.: Tsunami hazard in Lombok and Bali, Indonesia, due to the Flores back-arc thrust                             1673

                                                                         We run the tsunami simulation from the time of the earth-
                                                                      quake for 1 h; this is sufficient to capture both the first wave
                                                                      and a series of smaller later waves since the coastal regions
                                                                      we are interested in are close to the source (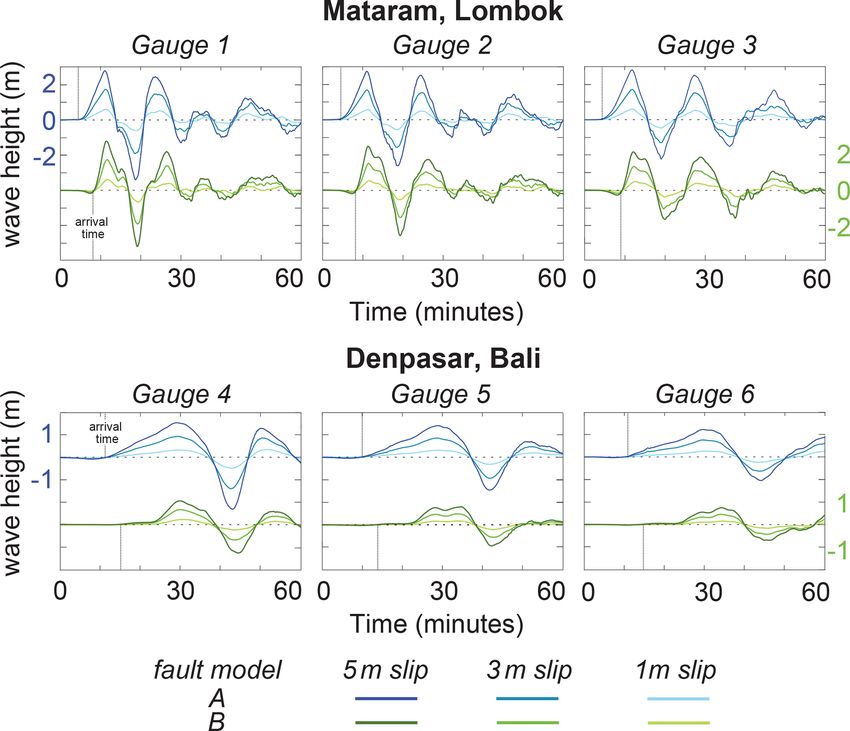
1674                   R. P. Felix et al.: Tsunami hazard in Lombok and Bali, Indonesia, due to the Flores back-arc thrust

Figure 7. Initial surface deformation and maximum wave heights in 1 h generated by different slip amounts on the full 45 km wide fault
ramp (model A). (a–c) The coseismic deformation generated by (a) 5 m, (b) 3 m, and (c) 1 m fault slip events results in uplift in the northern
half of the islands and subsidence in the south. (d–f) Maximum sea surface displacements for (d) 5 m, (e) 3 m, and (f) 1 m fault slip events.
Maps are adjusted to show wave heights relative to the post-earthquake land surface rather than initial sea level by subtracting the coseismic
displacement (dashed contour lines). The west coast of Lombok is hit by higher tsunami waves than the southeastern coast of Bali. Polygons
on land – cities of Denpasar, Bali, and Mataram, Lombok. D denotes Denpasar; M denotes Mataram.

Figure 8. Initial surface deformation and maximum wave heights in 1 h generated by different slip amounts on the upper half of the fault
ramp (model B). (a–c) The coseismic deformation generated by (a) 5 m, (b) 3 m, and (c) 1 m fault slip events results in a narrow uplift
patch in the north and broader subsidence in the south. (d–f) Maximum sea surface displacements for (d) 5 m, (e) 3 m, and (f) 1 m fault slip
events. Maps are adjusted to show wave heights relative to the post-earthquake land surface rather than initial sea level by subtracting the
coseismic displacement (dashed contour lines). The highest waves are concentrated around the headlands of Lombok and Bali at 8.38◦ S
and the mid-west coast of Lombok. Polygons on land – cities of Denpasar, Bali, and Mataram, Lombok. D denotes Denpasar; M denotes
Mataram.

wards the concave coastlines, and the wave heights can reach             ing it more exposed to the propagating waves. The maxi-
∼ 1–1.9 m high for models A-3 and A-5 (Fig. 7d, e).                      mum tsunami height on the west coast of Lombok is ∼ 1.8–
   Along the southern coasts, on the other hand, coseismic               3.7 m for models A-3 and A-5. On the other hand, the more
subsidence acts to increase the relative tsunami heights. The            distant and better-protected southeastern coast of Bali has a
subsidence in southern Lombok and Bali can reach as high                 maximum wave height of ∼ 1.3–2.2 m given the same slip
as ∼ 0.3–0.4 m for model A-5, ∼ 0.1–0.25 m for model A-                  amount, with slightly higher waves within the semi-enclosed
3, and
R. P. Felix et al.: Tsunami hazard in Lombok and Bali, Indonesia, due to the Flores back-arc thrust                               1675

Figure 9. Maximum wave heights in Mataram, based on simulations in grid layer 2 (L2, Fig. 6), generated by slip on fault models A (a–c)
and B (d–f). Models A-5 (a) and B-5 (d) generate wave heights of ∼ 2.5 to 2.7 m; models A-3 (b) and B-3 (e) generate ∼ 1.6 to 1.7 m high
waves; the models A-1 (c) and B-1 (f) generate ≤ 0.6 m high waves. Basemaps – World Imagery. Dots – tide gauges.

bok and Bali. Unlike in model A, the headlands at 8.38◦ S             and 45 min (first row, Fig. 11). The first wave in Mataram
are now within the area of subsidence (Fig. 8). This results          is ∼ 2.5–2.7 m high for 5 m slip (A-5 and B-5), ∼ 1.6–1.7 m
in an increase in the relative maximum wave height at the             high for 3 m slip (A-3 and B-3), and ≤ 0.6 m high for 1 m
headlands, with ∼ 2–4 m high tsunamis for models B-3 and              slip (A-1 and B-1) (Figs. 9 and 11). The height of the second
B-5 (Fig. 8d, e). Similarly, the west coast of Lombok is hit          wave is ∼ 1.9–2.5, ∼ 1.2–1.5, and ∼ 0.4–0.5 m for 5, 3, and
by ∼ 1.7–3.4 m high tsunamis, while southeastern Bali expe-           1 m slip, respectively. The third wave is ∼ 0.6–0.7 m high for
riences ∼ 0.8–2 m high tsunamis for models B-3 and B-5.               5 m slip, ∼ 0.3–0.4 m for 3 m slip, and ∼ 0.2–0.3 m for 1 m
   The two fault models generate similar maximum wave                 slip. The last wave is ∼ 0.1–1.3, ∼ 0.6–1, and ≤ 0.2 m for 5,
heights along the west coast of Lombok (Fig. 9), while the            3, and 1 m slips, respectively.
tsunamis generated by model A are slightly higher than those             In Denpasar, the waves are smaller and take longer to ar-
of model B along the southeastern coast of Bali (Fig. 10).            rive (second row, Fig. 11). For fault model A, the first wave
In both models, however, we consistently observe higher               arrives at ∼ 12–18 min and reaches its peak at ∼ 30 min. It
tsunami waves in Lombok compared to Bali. This difference             is followed by a drawdown at ∼ 38 min and a second wave
is best observed using the virtual tide gauge records situated        at ∼ 48–53 min. Fault model B has a similar wave pattern to
near the cities of Mataram and Denpasar.                              model A; however, its wave arrival times are slightly later.
                                                                      The first wave in model B arrives at ∼ 23–27 min, followed
3.2   Tsunami time series in Mataram, Lombok, and                     by a drawdown at ∼ 40 min and a second wave at ∼ 52–
      Denpasar, Bali                                                  55 min (Fig. 11). As Denpasar is further from the tsunami
                                                                      source and has a complex coastline, its wave records are
The tide gauge records show that the tsunami arrival times            not as uniform as those along the linear coast of Mataram.
in Mataram and Denpasar are insensitive to the fault model            For both fault models A and B, higher tsunami waves are
geometries that we consider. The first and highest wave in            generated within the semi-enclosed bay in the northeast of
Mataram arrives ≤ 9 min after the earthquake, and it reaches          Denpasar, while lower waves reach southwestwards along
its peak at ∼ 11 min, followed by a drawdown at ∼ 15–                 the concave coastline (Fig. 10; Gauge 4 in Fig. 11). Al-
17 min. Three more waves reach the coast at ∼ 20, ∼ 35,

https://doi.org/10.5194/nhess-22-1665-2022                                    Nat. Hazards Earth Syst. Sci., 22, 1665–1682, 2022
1676 R. P. Felix et al.: Tsunami hazard in Lombok and Bali, Indonesia, due to the Flores back-arc thrust
Figure 10. Maximum wave heights in Denpasar generated by slip on fault models A (a–c) and B (d–f). The highest tsunami wave heights are
located within the semi-enclosed bay on the northeast coast. The maximum wave height near Denpasar range is ∼ 1.4 m for model A-5 (a),
∼ 0.9 m for A-3 (b), and ∼ 0.3 m for A-1 (c). The maximum wave heights are slightly lower in fault model B. They are ∼ 0.8 m for model
B-5 (d), ∼ 0.6 m for B-3 (e), and ≤0.2 m for B-1 (f). Basemaps – World Imagery. Dots – tide gauges.
though they have a similar trend, the wave heights generated coast; in the south, it reaches ∼ 230 m. This much wider ex-
by model A are slightly higher than those of model B. For tent in the south correlates with a lower density of structures.
model A, the maximum wave heights generated are ∼ 1.4 (A- We interpret this to mean that the presence of closely packed
5), ∼ 0.9 (A-3), and ∼ 0.3 m (A-1). For model B, the maxi- structures in the north limits the inundation further inland.
mum wave heights generated are ∼ 0.8 (B-5), ∼ 0.6 (B-3), Our results are based on the model assumption that these
and ≤ 0.2 m (B-1) (Fig. 11). structures can withstand the flow; in a real tsunami event,
some structures could be destroyed (e.g., 2011 Tōhoku earth-
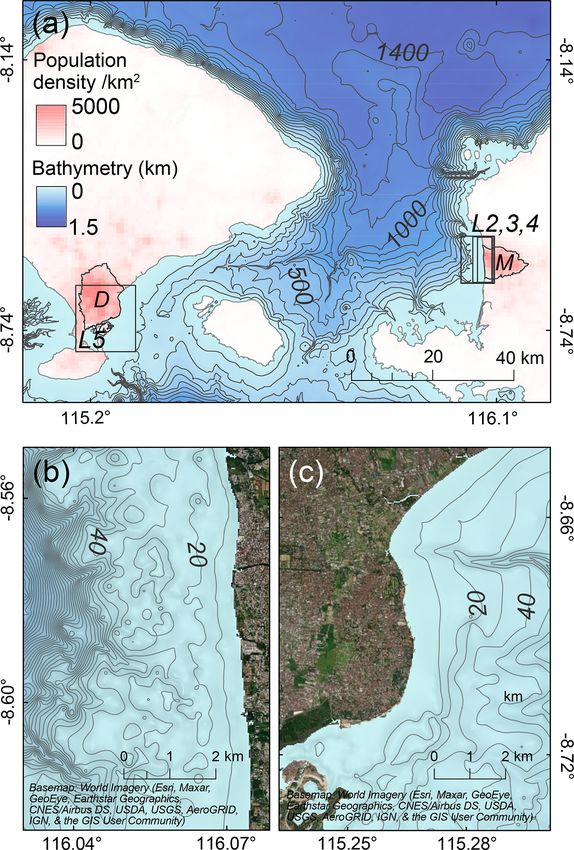
3.3 Inundation in Mataram, Lombok quake and tsunami; Mori et al., 2013), which could reduce
flow resistance and increase the inundation distance.
The inundation has a limited extent where the beach is
Tsunami waves of a given height at the coastline can have
narrow and there are dense structures near the coast. For
variable impact depending on the topography and infrastruc-
instance, along the northern (Fig. 12a, b) and mid-southern
ture on land. Because inundation modeling requires a de-
coasts (Fig. 13a, b), inundation is limited to within the ∼ 15–
tailed digital surface model for accurate results and signifi-
20 m wide beach, and the closely packed residential struc-
cant computational time, we limit the inundation modeling
tures just behind the beach are not inundated. At industrial
to the city of Mataram, Lombok, since this region is densely
sites where there are more open spaces (Figs. 12a and b
populated (Fig. 6) and is exposed to the highest waves in our
and 13a and b), the inundation extent can reach ∼ 95–140 m
tsunami models. We run the modeling for fault model A-5
(Fig. 12a–d). When the beach is wider and the structures are
to represent the inundation of the worst-case earthquake sce-
further from the coast, the inundation extends further inland
nario used in this study.
(Figs. 12c and d and 13c and d). We note that in our model,
Based on our results, 5 m of fault slip generates two >2 m
clustered vegetation on the beach is represented in the DSM
high waves followed by two lower waves that hit the coast at
as a solid barrier and thus is able to entirely block the flow
Mataram (Fig. 11). These waves inundate Mataram with flow
(upper part of Fig. 12c, d). In reality, clustered vegetation
depths of generally ≤ 2 m but can reach as high as 3 m on the
can slow but not completely obstruct the flow; the inunda-
southern coast (Figs. 12 and 13). The extent of inundation
tion extent at this site is therefore likely underestimated. Us-
is ∼ 55–140 m along the northern to the middle parts of the
Nat. Hazards Earth Syst. Sci., 22, 1665–1682, 2022 https://doi.org/10.5194/nhess-22-1665-2022R. P. Felix et al.: Tsunami hazard in Lombok and Bali, Indonesia, due to the Flores back-arc thrust 1677 Figure 11. Sea surface elevation generated by fault models A and B recorded at virtual tide gauges located along the 10 m water depth contours offshore Mataram (gauges 1 to 3) and Denpasar (gauges 4 to 6). The records for fault models A and B in Mataram are sim- ilar in terms of wave heights and arrival times. In Denpasar, the models have similar wave patterns but the arrival times for model A are slightly earlier than in model B. After the earthquake, the first tsunami in Mataram arrives at
1678 R. P. Felix et al.: Tsunami hazard in Lombok and Bali, Indonesia, due to the Flores back-arc thrust
rival would mean little time for evacuation. In the case of the
2018 Lombok earthquake, the residents of northern Lombok
started evacuation only after a government announcement,
and the evacuation took at least 20 min (Tsimopoulou et al.,
2020). For a potential tsunami in Mataram caused by slip on
the Flores Thrust, there is insufficient time to wait for an an-
nouncement after the earthquake. Hence, raising community
awareness about earthquake-generated tsunamis and evacua-
tion plans is important so that residents will know to respond
immediately after experiencing strong ground shaking. Fur-
thermore, the initial polarity of the waves would be positive,
and thus there would be no warning signal from drawdown
prior to inundation. In addition, a second high wave would hit
Mataram coast at ∼ 20 min, emphasizing the need for contin-
ued heightened alert following the first inundation.
We finally note that some of the structures built along the
coast are industrial, with several petroleum tanks and a gas
power plant. The impacts of natural disasters can be multi-
plied when natural events trigger industrial events (“natural
hazards triggering technological disasters”, or Natech) (Cruz
and Suarez-Paba, 2019). Tsunamis in particular have a his-
tory of causing Natech events (e.g., Suppasri et al., 2021); for
instance, the 2011 Mw 9.1 Tōhoku earthquake and tsunami
led to not only meltdown at the Fukushima Daiichi nuclear
power plant but also fires, explosions, and hazardous mate-
rial release at industrial sites (Krausmann and Cruz, 2013). In
Mataram, damage to the petroleum tanks, power plant, and
other industrial equipment by ground shaking or inundation
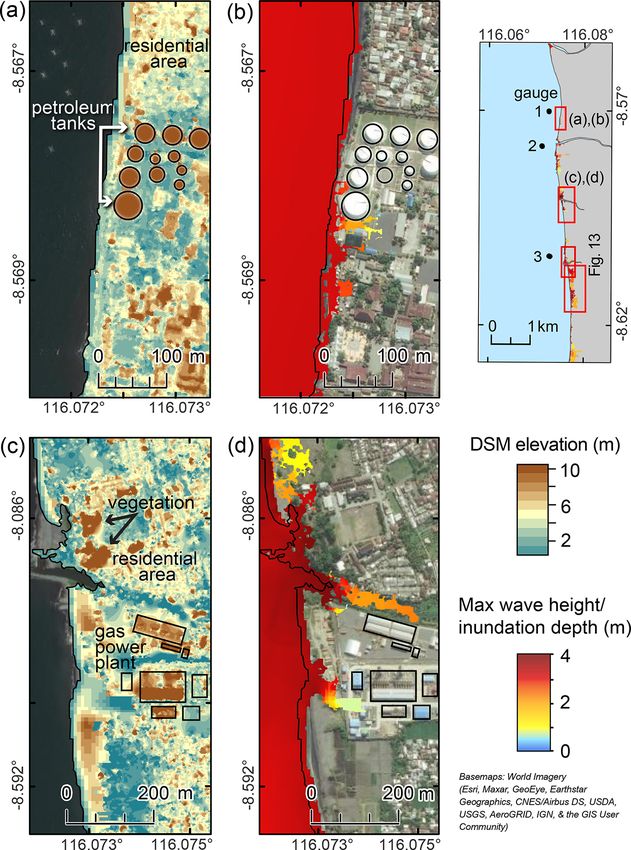
Figure 13. The DSM elevation and inundation on the southern coast could trigger Natech events, including fires, explosions, and
of Mataram associated with 5 m of coseismic slip on the Flores pollution of the coastal water and associated ecological dam-
Thrust ramp (model A-5) overlain on World Imagery. (a, b) To the age. Evaluating these sites to understand and strengthen their
south of the industrial site (with petroleum tanks), the inundation resilience to these hazards should be a priority.
depth is ≤ 1.5 m and the inundation extent is ∼ 175 m. (c, d) In the While most tsunami modeling studies in Indonesia have
south, inundation is more extensive, likely because of the lower den- focused on the hazard associated with large tsunamis trig-
sity of structures and wider open area (beach and farmland). The in- gered by megathrust ruptures, such as the devastating 2004
undation depth is generally 2–3 m, and the extent reaches ∼ 230 m.
Indian Ocean earthquake and tsunami (e.g., Wang and Liu,
Right image – location map of panels (a–d).
2007), we highlight here the hazard associated with smaller
local events caused by slip on a back-arc thrust system.
One of the challenges with local studies is the need for de-
slip, while Denpasar has maximum wave heights of 0.6 to tailed and accurate fault models and bathymetry datasets.
1.4 m. Overall, the coast along Mataram is more prone than We show that geological information such as regional and
Denpasar to high tsunamis arriving quickly. nearby seismicity can be combined with bathymetry, topog-
Because Mataram experiences higher wave heights, we raphy, and seismic reflection data to model fault geometry
also modeled the inundation in this region for our worst-case and that a high-resolution bathymetry dataset can be gener-
scenario (5 m slip) using a high-resolution DSM. We found ated by combining globally available bathymetric data with
that the inundation extends for ∼ 55–140 m inland with a sounding measurements collected for navigation purposes.
maximum flow depth of ∼ 2–3 m, except in the region just Specifically, for earthquake-triggered tsunamis in Indonesia,
south of the city, where the inundation reaches 230 m. This the official nautical charts for Indonesia provide dense mea-
difference in inundation extent appears to be primarily in- surements offshore shallow coastal cities. Integrating these
fluenced by the structures present near the coast, which are datasets can provide more accurate forecasts and hazard es-
denser in the north. However, if structures were destroyed by timations for both tsunami wave height and tsunami arrival
flow, inundation could reach further inland. time, for local and regional studies, and could be replicated
Because of the proximity of the Flores Thrust ramp to for other fault systems and areas.
the coasts of Lombok and Bali, associated tsunamis would
hit withinR. P. Felix et al.: Tsunami hazard in Lombok and Bali, Indonesia, due to the Flores back-arc thrust 1679
Data availability. The animation of the tsunami propagation for Review statement. This paper was edited by Valenti Sallares and
the 5 m coseismic slip on the full fault ramp and the inun- reviewed by three anonymous referees.
dation model for Mataram, Lombok, can be accessed freely
at the Nanyang Technological University Data Repository at
https://doi.org/10.21979/N9/DZLM5D (Felix et al., 2022a) and
https://doi.org/10.21979/N9/QKNSKO (Felix et al., 2022b), respec- References
tively.
Afif, H. and Cipta, A.: Tsunami hazard map in eastern Bali, AIP
Conf. Proc., 1658, 050001, https://doi.org/10.1063/1.4915041,
Supplement. The supplement related to this article is available on- 2015.
line at: https://doi.org/10.5194/nhess-22-1665-2022-supplement. Ammon, C. J., Kanamori, H., and Lay, T.: A great earthquake dou-
blet and seismic stress transfer cycle in the central Kuril islands,
Nature, 451, 561–565, https://doi.org/10.1038/nature06521,
2008.
Author contributions. RPF, JAH, and KEB conceptualized the re-
Beckers, J. and Lay, T.: Very broadband seismic analysis of the 1992
search. RPF conducted the modeling and the formal analysis. JAH
Flores, Indonesia, earthquake (Mw = 7.9), J. Geophys. Res.,
and KEB acquired the funding. JAH supervised the overall work.
100, 18179–18193, https://doi.org/10.1029/95jb01689, 1995.
JAH, KEB, and KHL assisted with the fault model setup. LL and
Behrens, J., Løvholt, F., Jalayer, F., Lorito, S., Salgado-Gálvez, M.
ADS assisted with the tsunami modeling. RPF generated the fig-
A., Sørensen, M., Abadie, S., Aguirre-Ayerbe, I., Aniel-Quiroga,
ures. RPF and JAH wrote the original draft. JAH, KEB, KHL, LL,
I., Babeyko, A., Baiguera, M., Basili, R., Belliazzi, S., Grezio,
and ADS reviewed and edited the manuscript.
A., Johnson, K., Murphy, S., Paris, R., Rafliana, I., De Risi, R.,
Rossetto, T., Selva, J., Taroni, M., Del Zoppo, M., Armigliato, A.,
Bureš, V., Cech, P., Cecioni, C., Christodoulides, P., Davies, G.,
Competing interests. The contact author has declared that neither Dias, F., Bayraktar, H. B., González, M., Gritsevich, M., Guillas,
they nor their co-authors have any competing interests. S., Harbitz, C. B., Kânoglu, U., Macías, J., Papadopoulos, G. A.,
Polet, J., Romano, F., Salamon, A., Scala, A., Stepinac, M., Tap-
pin, D. R., Thio, H. K., Tonini, R., Triantafyllou, I., Ulrich, T.,
Disclaimer. Publisher’s note: Copernicus Publications remains Varini, E., Volpe, M., and Vyhmeister, E.: Probabilistic Tsunami
neutral with regard to jurisdictional claims in published maps and Hazard and Risk Analysis: A Review of Research Gaps, Front.
institutional affiliations. Earth Sci., 9, 1–28, https://doi.org/10.3389/feart.2021.628772,
2021.
Bilek, S. L.: Invited review paper: Seismicity along the South Amer-
Special issue statement. This article is part of the special issue ican subduction zone: Review of large earthquakes, tsunamis,
“Tsunamis: from source processes to coastal hazard and warning”. and subduction zone complexity, Tectonophysics, 495, 2–14,
It is not associated with a conference. https://doi.org/10.1016/j.tecto.2009.02.037, 2010.
Boekschoten, G. J., Best, M. B., and Putra, K. S.: Balinese reefs
in historical context, in: Proceedings of the Ninth International
Acknowledgements. The maps in this paper were made using Coral Reef Symposium, Bali, Indonesia, 23–27 October 2000,
ArcGIS® software by Esri. The World Ocean Base map is attributed 2, edited by: Moosa, M. K., Soemodihardjo, S., Soegiarto, A.,
to Esri, GEBCO, NOAA, Garmin, HERE, and other contributors. Romimohtarto, K., Nontji, A., Soekarno and Suharsono, ISBN
The World Imagery basemap is attributed to Esri, Maxar, Earth- 9798105974, 2000.
star Geographics, USDA FSA, USGS, Aerogrid, IGN, IGP, and the Bondarenko, M., Kerr, D., Sorichetta, A., and Tatem,
GIS User Community. ArcGIS® and ArcMap™ are the intellectual A.: Census/projection-disaggregated gridded population
property of Esri and are used herein under license (copyright © Esri, datasets for 189 countries in 2020 using Built-Settlement
all rights reserved). We would like to thank Rishav Mallick for help- Growth Model (BSGM) outputs, WorldPop [data set],
ing in creating Fig. 4 using the Unicycle code (Moore et al., 2019). https://doi.org/10.5258/SOTON/WP00684, 2020.
Bowin, C., Purdy, G. M., Johnston, C., Shor, G., Lawver,
L. Hartono, H. M. S., and Jezek, P.: Arc-Continent Col-
Financial support. This research has been supported by the Earth lision in Banda Sea Region, Am. Assoc. Pet. Geol. Bull.,
Observatory of Singapore (grant no. 408). This research was sup- 64, 868–915, https://doi.org/10.1306/2F9193CD-16CE-11D7-
ported by the Earth Observatory of Singapore via its funding from 8645000102C1865D, 1980.
the National Research Foundation Singapore and the Singapore Chau, K. T. and Lam, K. T. S.: Field observations and numeri-
Ministry of Education under the Research Centres of Excellence cal simulations of the 2011 Tohoku tsunami using COMCOT,
initiative. This work comprises EOS contribution number 408. The in: Computer Methods and Recent Advances in Geomechan-
project was also supported by the National Natural Science Foun- ics, edited by: Oka, F., Murakami, A., Uzuoka, R., and Kimoto,
dation of China (grant no. 41976197). S., Taylor & Francis Group, London, ISBN 978-1-138-00148-0,
2015.
Cruz, A. M. and Suarez-Paba, M. C.: Advances in Nat-
ech research: An overview, Prog. Disaster Sci., 1, 100013,
https://doi.org/10.1016/j.pdisas.2019.100013, 2019.
https://doi.org/10.5194/nhess-22-1665-2022 Nat. Hazards Earth Syst. Sci., 22, 1665–1682, 2022You can also read