Biodiversity Assessment Method 2020 Operational Manual - Stage 1 - DEPARTMENT OF PLANNING, INDUSTRY & ENVIRONMENT
←
→
Page content transcription
If your browser does not render page correctly, please read the page content below
DEPARTMENT OF PLANNING, INDUSTRY & ENVIRONMENT

Biodiversity Assessment
Method 2020 Operational
Manual – Stage 1

environment.nsw.gov.au
© 2020 State of NSW and Department of Planning, Industry and Environment
With the exception of photographs, the State of NSW and Department of Planning, Industry
and Environment are pleased to allow this material to be reproduced in whole or in part for
educational and non-commercial use, provided the meaning is unchanged and its source,
publisher and authorship are acknowledged. Specific permission is required for the
reproduction of photographs.
The Department of Planning, Industry and Environment (DPIE) has compiled this manual in
good faith, exercising all due care and attention. No representation is made about the
accuracy, completeness or suitability of the information in this publication for any particular
purpose. DPIE shall not be liable for any damage which may occur to any person or
organisation taking action or not on the basis of this publication. Readers should seek
appropriate advice when applying the information to their specific needs.
All content in this publication is owned by DPIE and is protected by Crown Copyright, unless
credited otherwise. It is licensed under the Creative Commons Attribution 4.0 International
(CC BY 4.0), subject to the exemptions contained in the licence. The legal code for the
licence is available at Creative Commons.
DPIE asserts the right to be attributed as author of the original material in the following
manner: © State of New South Wales and Department of Planning, Industry and
Environment 2020.
Cover photo: Cleared Land, South East Forests National Park. John Spencer/DPIE

Published by:
Environment, Energy and Science
Department of Planning, Industry and Environment
Locked Bag 5022, Parramatta NSW 2124
Phone: +61 2 9995 5000 (switchboard)
Phone: 1300 361 967 (Environment, Energy and Science enquiries)
TTY users: phone 133 677, then ask for 1300 361 967
Speak and listen users: phone 1300 555 727, then ask for 1300 361 967
Email: info@environment.nsw.gov.au
Website: www.environment.nsw.gov.au
Report pollution and environmental incidents
Environment Line: 131 555 (NSW only) or info@environment.nsw.gov.au
See also www.environment.nsw.gov.au
ISBN 978-1-922493-89-7
EES 2020/0582
December 2020

Find out more about your environment at:

www.environment.nsw.gov.au
Contents
List of figures                                                         iv
List of tables                                                           v
Shortened forms                                                         vi
Introduction                                                            1
     Biodiversity Assessment Method – Operational Manual                 2
Stage 1: Biodiversity assessment                                         3
     Introduction to Stage 1                                             3
     Resources                                                           3
     Use of more appropriate local data                                  5
     Biodiversity values excluded from Stage 1 assessment                6
1.   Documenting Stage 1 outcomes                                        7
     1.1    Requirements for Biodiversity Assessment Reports             7
     1.2    Requirements for maps                                        7
     1.3    Introduction to the Biodiversity Assessment Report           8
2.   Part 1: Establishing the site context                               9
     2.1    Requirements for the Biodiversity Assessment Report          9
     2.2    Identify landscape features                                 10
     2.3    Percent native vegetation cover                             12
     2.4    Field reconnaissance                                        13
3.   Part 2: Assessing native vegetation, threatened ecological
     communities and vegetation integrity                               16
     3.1    Requirements for the Biodiversity Assessment Report         16
     3.2    Native vegetation extent                                    17
     3.3    Stratify native vegetation                                  18
     3.4    Assess vegetation integrity (vegetation condition)          29
4.   Part 3: Assessing the habitat suitability for threatened species   39
     4.1    Requirements for the Biodiversity Assessment Report         39
     4.2    Threatened Biodiversity Data Collection                     40
     4.3    Class of biodiversity credit                                41
     4.4    Identify habitat suitability for threatened species         42
     4.5    Identify the biodiversity risk weighting for the species    50
5.   Part 4: Identifying prescribed additional biodiversity impacts     51
     5.1    Requirements for the Biodiversity Assessment Report         51
     5.2    Identify prescribed impacts                                 52

                                         iii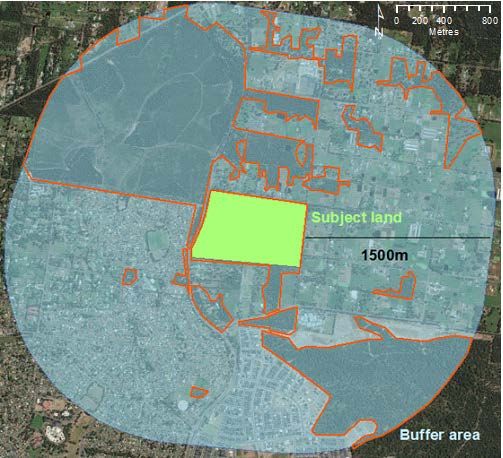
References                                                                      55
Appendix A – Websites and online resources referred to in this
   Manual                                                                       56
Appendix B – Sample field data sheet for vegetation survey                      59
Appendix C – Assessing habitat suitability for threatened species               63

List of figures
Figure 1    Example of subject land with 1500 m buffer (scale 1:25,000)         14
Figure 2    Example of linear subject land with 500 m buffer (scale 1:10,000)   15
Figure 3    NSW vegetation classification hierarchy                             18
Figure 4    Contiguous vegetation zones on a stewardship site                   23
Figure 5    Continuous and discontinuous vegetation zones on a development
            site                                                                24
Figure 6    Discontinuous zones on a stewardship site                           25
Figure 7    Vegetation zones on a major project site                            26
Figure 8    Mapped vegetation zones and patches on a proposed development
            site (scale 1:6,000)                                          28
Figure 9    Plot layout to be used for site assessment                          31
Figure 10   Cumberland Plain land snail Meridolum corneovirens species
            polygon                                                             49

                                        iv
List of tables
Table 1    Requirements for the BAR – Site context                                 9
Table 2    Requirements for the BAR – Native vegetation, TECs and VI              16
Table 3    Vegetation survey data requirements                                    19
Table 3    Minimum number of plots required per zone (copy of Table 3 from
           BAM Subsection 4.3.4)                                                  29
Table 4    Growth form groups and attributes used to assess the composition,
           structure and function components of vegetation integrity         32
Table 5    Worked example of composition condition score calculation              35
Table 6    Worked example of structure condition score calculation                36
Table 7    Tree stem size diversity scores (copy of BAM Table 18)                 36
Table 8    Worked example of function condition score calculation                 37
Table 9    Requirements for the BAR – Habitat suitability                         39
Table 10   Biodiversity credit classes and associated general definitions for
           application in the BAM                                                 41
Table 11   Criteria for identifying ecosystem and species credit species at a site 42
Table 12   Requirements for the BAR – Identifying prescribed impacts              51
Table 13   Example of identification of prescribed impacts on site                53

                                        v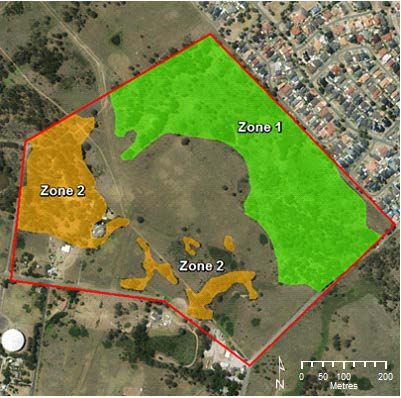
Shortened forms
Abbreviation           Description
AOBV                   Area of Outstanding Biodiversity Value
BAR                    Biodiversity Assessment Report
BAM                    Biodiversity Assessment Method
BC Act                 Biodiversity Conservation Act 2016 (NSW)
BCAR                   Biodiversity Certification Assessment Report
BCT                    Biodiversity Conservation Trust
BDAR                   Biodiversity Development Assessment Report
BC Regulation          Biodiversity Conservation Regulation 2017 (NSW)
BOS                    Biodiversity Offsets Scheme
BSSAR                  Biodiversity Stewardship Site Assessment Report
CEEC                   Critically endangered ecological community
BAM-C                  Biodiversity Assessment Method Calculator
DBH                    Diameter at breast height over bark
DIWA                   Directory of Important Wetlands in Australia
EEC                    Endangered ecological community
EP&A Act               Environmental Planning and Assessment Act 1979 (NSW)
EPBC Act               Environment Protection and Biodiversity Conservation Act 1999 (C’th)
Fisheries NSW Policy   Fisheries NSW Policy and guidelines for fish habitat conservation and
and Guidelines         management
IBRA                   Interim Biogeographic Regionalisation for Australia, Version 7
LLS                    NSW Local Land Services
LLS Act                Local Land Services Act 2013 (NSW)
the Manual             Biodiversity Assessment Method 2020 Operational Manual
NSW                    New South Wales
The Department         NSW Department of Planning, Industry and Environment
PCT                    Plant community type
SEPP                   State Environmental Planning Policy
SEED                   Sharing and Enabling Environmental Data
the Standard           Native Vegetation Interim Type Standard (Sivertsen 2009)
TBDC                   Threatened Biodiversity Data Collection
TEC                    Collective term for threatened ecological communities (VECs, EECs,
                       CEECs)
VEC                    Vulnerable ecological community
VI                     Vegetation integrity

                                              vi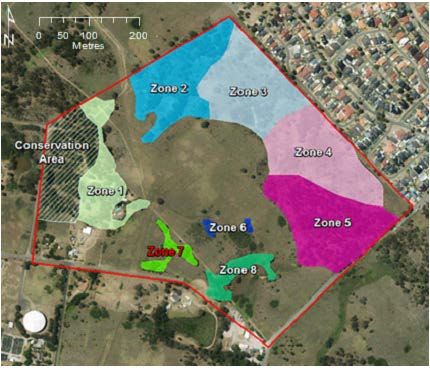
Biodiversity Assessment Method 2020 Operational Manual – Stage 1

Introduction
The NSW Biodiversity Conservation Act 2016 (BC Act), and Biodiversity Conservation
Regulation 2017 (BC Regulation) outline the framework for addressing impacts on
biodiversity from development and clearing. The framework requires a proponent to avoid,
minimise and offset impacts on biodiversity from these actions using the Biodiversity Offsets
Scheme (BOS).
The BOS establishes biodiversity stewardship agreements (BSAs), which are voluntary in-
perpetuity agreements entered into by landholders. BSAs are the mechanism used to secure
offset sites where the improvement in biodiversity values is used to offset the loss incurred
by development and clearing of native vegetation elsewhere in New South Wales.
The BOS includes the Biodiversity Assessment Method 2020 (BAM), which is enabled by
section 6.7 of the BC Act. The BAM provides:
•   a transparent, consistent, and scientifically-based approach for the assessment of
    biodiversity values on a proposed development, clearing or biodiversity stewardship site
•   guidance on how a proponent can avoid and minimise potential biodiversity impacts
•   a method for calculating the number and class of biodiversity credits that need to be
    offset to meet the standard of ‘no net loss’ of biodiversity.
At a proposed biodiversity stewardship site, the BAM is used to assess the biodiversity
values on the site, identify the types of management actions and activities that must be
undertaken as part of the management plan, and determine the number and class of
biodiversity credits that can be created based on those management actions.
The types of development and clearing proposals that are assessed using the BAM include:
•   applications for development consent under Part 4 of the NSW Environmental Planning
    and Assessment Act 1979 (EP&A Act), other than an application for state significant
    development or for a complying development certificate (see section 7.13(1) of the BC
    Act), and the modification of such consents
•   applications for development consent for state significant development or for approval
    for state significant infrastructure under the EP&A Act (see section 7.14(1) of the BC
    Act), and the modification of such consents
•   Part 5 activity under the EP&A Act, where the proponent has elected to obtain a
    biodiversity development assessment report (BDAR), under Division 2 of the BC Act
    (see section 7.15(1) of the BC Act), and the modifications of such approvals
•   biodiversity certification of land (see sections 8.2 and 8.7(1) of the BC Act)
•   applications to clear native vegetation on rural land under Division 6 of Part 5A of the
    NSW Local Land Services Act 2013 (LLS Act) that do not meet the requirements of
    allowable activities or the Land Management (Native Vegetation) Code 2018
•   clearing of native vegetation in urban areas and environmental conservation zones
    under the State Environmental Planning Policy (Vegetation in Non-Rural Areas) 2017
    (the Vegetation SEPP) (i.e. clearing that does not need development consent under the
    EP&A Act), that exceeds the offset thresholds.
Applying the BAM does not preclude the obligation to separately consider the requirements
of other related legislation. Proponents will need to comply with the requirements of the BOS
as well as other legislation or statutory instruments where applicable (e.g. State
Environmental Planning Policies). Whether offset requirements under the BOS will satisfy
the requirements of other legislation will be a matter for the decision-maker to decide, and
will depend on the context, characteristics and impacts of the specific proposal.

                                                 1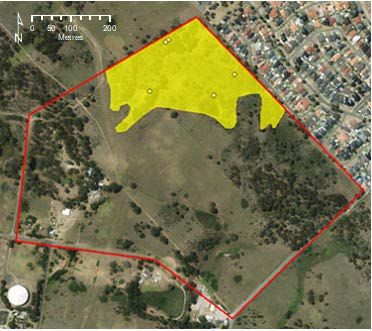
Biodiversity Assessment Method 2020 Operational Manual – Stage 1

Biodiversity Assessment Method – Operational Manual
Purpose of this Manual
The BAM Operational Manual (the Manual) provides operational guidance to assist
applicants and accredited assessors in the application of the BAM. The Manual is a
companion document to the BAM. In general, the Manual does not seek to repeat text in the
BAM and therefore the two documents should be read together. Any updates to
administrative structures, position titles and data sources since the BAM was last gazetted
may also be reflected in the Manual.

Structure of the Manual
The Manual is structured to reflect the three stages of the BAM. Each stage is presented as
a separate document to enable easy access to relevant information when implementing the
BAM.
Stage 1: Biodiversity assessment identifies the types of biodiversity values on land, such
as:
•    land proposed as a development site, including for a Part 5 activity
•    land subject to a vegetation clearing proposal which is required to be assessed by BAM
     under the LLS Act
•    land proposed to be biodiversity certified
•    land proposed as a biodiversity stewardship site under a biodiversity stewardship
     agreement.
In general Stage 1 focuses on the assessment of the landscape context, the vegetation
integrity (VI) of native vegetation 1, and habitat suitability for threatened species.
Stage 1 is the focus of this document.
Stage 2: Impact assessment (biodiversity values and prescribed impacts) applies the
avoid, minimise and offset hierarchy and assesses direct, indirect and prescribed impacts
associated with the development or clearing proposal. It is used to determine the offset
requirements for all residual impacts on biodiversity values at a proposed site. In general,
these are measured as ecosystem credits and species credits. Stage 2 determines the
number, class and offset trading group of biodiversity credits.
Stage 3: Improving biodiversity values is used to assess the anticipated improvement (or
gain) in the VI of native vegetation and habitat suitability for threatened species, the
management actions, and preparation of a management plan at a proposed stewardship
site. The stage is also used to determine the number of biodiversity credits created at the
site from the anticipated improvement in biodiversity values.
Streamlined assessment modules are set out in Appendices B, C and D of the BAM and
may be used where the proposal impacts on scattered trees, a small area or planted native
vegetation. A document is being developed to support the implementation of the streamlined
assessment modules and will be published on the BAM webpage (see Appendix A).

1 Native vegetation is defined under s. 60B of the Local Land Services Act 2013 as plants native to New South

Wales (trees, under-storey plants, ground cover, plants occurring in a wetland), established in New South Wales
before European settlement.

                                                       2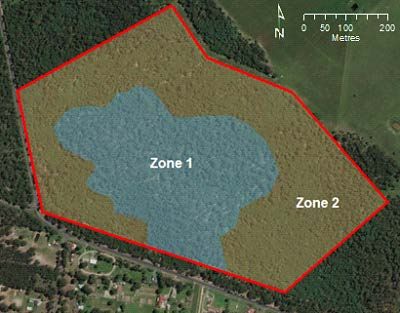
Biodiversity Assessment Method 2020 Operational Manual – Stage 1

Stage 1: Biodiversity assessment
Introduction to Stage 1
The purpose of Stage 1 is to identify biodiversity values present within the land proposed for
development, activity, clearing, biodiversity certification or biodiversity stewardship (in all
cases referred to as the subject land). These assessments must be undertaken by a
specialist ecological consultant who has accreditation to apply the BAM (provided for under
section 6.10 of the BC Act). This accredited person is referred to as an assessor. Stage 1 of
the Manual is divided into the following parts:
•   Part 1 – Establishing the site context (BAM Chapter 3)
•   Part 2 – Assessing native vegetation cover, threatened ecological communities (TECs)
    and VI (BAM Chapter 4)
•   Part 3 – Assessing the habitat suitability for threatened species (BAM Chapter 5)
•   Part 4 – Identifying prescribed additional biodiversity impacts (BAM Chapter 6)
•   Appendix A – Websites and online resources referred to in this Manual
•   Appendix B – Sample field data sheet for vegetation survey
•   Appendix C – Assessing habitat suitability for threatened species.
The Manual differs from the BAM in that the information is presented as a sequence of
steps, which if applied, will identify biodiversity values on the subject land in accordance with
the requirements of the BAM. It does not include comprehensive descriptions of the method
or any processes that are completed automatically by the BAM Calculator (BAM-C). For this
information refer to the relevant sections of the BAM.

Resources
A range of online resources are available to assist assessors. Further information is
available in Appendix A. Key resources include:

Biodiversity Offsets and Agreement Management System (BOAMS)
•   The case management system used to administer the BOS.
•   Assessors must use the BAM-C in BOAMS to apply the BAM. BOAMS is also used to
    submit BAM related applications, generate a credit obligation or apply to sell or retire
    credits.
•   Assessors may also use BOAMS to submit an expression of interest for a biodiversity
    stewardship agreement on behalf of a landholder or submit a credit wanted listing on
    behalf of a development proponent.
•   Important habitat area maps are also available, for those species for which the habitat
    constraint in the Threatened Biodiversity Data Collection (TBDC) refers to a mapped
    important area.
•   For more information about how to use the BOAMS, the user guide can be accessed
    from the Frequently Asked Questions module after logging in to BOAMS.

Biodiversity Assessment Method Calculator (BAM-C)
•   The tool that operationalises the BAM. The BAM-C stores much of the survey
    information recorded by the assessor and it calculates the number and type of credits
    required to offset the impacts of development on, or credits generated from
    improvements in, biodiversity values.

                                                  3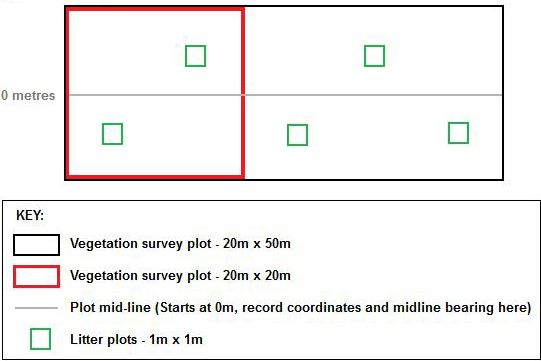
Biodiversity Assessment Method 2020 Operational Manual – Stage 1

•   Two versions of the BAM-C exist:
    ○    a public stand-alone version (open to all but will not save data or print reports), and
    ○    a password protected version accessed through the BOAMS for the use of
         assessors and decision-makers when preparing or reviewing BAM related
         proposals (see above).
•   The case in the BAM-C for the proposed development, activity, clearing, biodiversity
    certification or stewardship site must have a status of finalised before it can be
    submitted to the decision-maker.
•   Updates to the biodiversity data referenced by the BAM-C, including to the underlying
    species and native vegetation data held in BioNet, occurs periodically. All registered
    users of the BAM-C will be notified accordingly.
•   Refer to the BAM-C user guide for information on how to use the application.

Biodiversity Conservation Trust (BCT) guidance
•   The ‘Resources’ page on the BCT website includes a range of resources to support
    private land conservation.

BioNet Atlas
•   A publicly accessible online database that contains biodiversity observation data for
    New South Wales.
•   Ecological consultants need to request a login that gives access to full location data and
    the ability to submit species sightings and survey data.
•   The database includes support from the NSW BioNet quick guides, information sheets,
    manuals and datasheets.

BioNet Threatened Biodiversity Data Collection (TBDC)
•   The database contains information for listed threatened species, populations and
    ecological communities such as survey requirements and habitat constraints that can
    guide identification of species polygons.
•   It houses the information and data used in the BAM-C including the biodiversity credit
    class of a species.

BioNet Systematic Flora Survey
•   Systematic vegetation survey data (VIS data) for New South Wales, including full
    floristic survey sites, rapid sites and site vegetation condition information.

BioNet Vegetation Classification (Veg-C)
•   The database contains information on plant community types (PCTs) described for New
    South Wales including general location, floristic composition and structure, condition
    benchmarks and percent cleared information.
•   Veg-C is the primary source for defining equivalent or part equivalent associations
    between PCTs and TECs.

BioNet Web Services
•   NSW biodiversity data held in BioNet that has been made available via an Open
    Application Programming Interface (API).

                                                 4
Biodiversity Assessment Method 2020 Operational Manual – Stage 1
• It enables organisations and individuals to directly integrate biodiversity data into their
software systems.
Areas of Outstanding Biodiversity Value (AOBV)
• Declared Areas of Outstanding Biodiversity Value (AOBV) can be found in the Register
of Areas of Outstanding Biodiversity Values. Links to declarations of these sites are
recorded within the register.
Sharing and Enabling Environmental Data (SEED)
• SEED is a shared resource for environmental data that includes public access to the
Department of Planning, Industry and Environment (the Department) datasets.
• Available spatial datasets include:
○ NSW (Mitchell) Landscapes – version 3.1
○ Interim Biogeographic Regionalisation for Australia (IBRA regions and sub-regions)
– version 7
○ NSW soil profiles
○ hydrogeological landscapes
○ acid sulfate soils risk maps
○ digital cadastral database
○ BioNet Vegetation Map Collection (previously called the Vegetation Information
System Maps).
PlantNET NSW
• An online database of the flora of New South Wales that contains the currently accepted
taxonomy for plants found in the state, both native and exotic.
• Online keys for plant identification, as per the published Flora of NSW (Harden 1990–
2002) and updates.
• Plant taxonomy and naming in Biodiversity Assessment Reports (BARs) must be
consistent with the Flora of NSW, as per PlantNET.
Use of more appropriate local data
In some circumstances, assessors may use more appropriate local data rather than existing
information from resources and datasets (see BAM Subsections 1.4.2 and 1.4.1); for
example, using the results of recent local surveys and studies to refine the list of ecosystem
or candidate threatened species in a BAM assessment or to modify existing benchmarks to
better reflect local environmental conditions. Other reasons to use local benchmark data for
benchmark values may be because the existing benchmarks have a low confidence level or
the benchmark at the vegetation class to IBRA bioregion scale is unsuitable for the PCT.
5Biodiversity Assessment Method 2020 Operational Manual – Stage 1
The use of more appropriate local data must be approved (in writing) by the decision-
maker 2. It is recommended that the assessor discusses the intent to use local data with the
decision-maker early in the assessment process.
More appropriate local data cannot be used to change values in relation to the sensitivity to
loss; sensitivity to potential gain; or the biodiversity risk weighting of a threatened entity or
PCT (refer to Part 3 of this Manual). If the assessor has data or peer-reviewed/published
information that indicates these values should be reviewed they can provide these to the
Department at bionet@environment.nsw.gov.au.
Biodiversity values excluded from Stage 1 assessment
Biodiversity values that do not form part of an assessment are outlined in BAM Section 1.5.
The BAM does apply to the suite of impacts identified in clause 6.1 of the BC Regulation.
These are referred to as prescribed impacts, which includes impacts other than clearing of
native vegetation. For example, impacts on threatened bats roosting in human-made
structures, artificial drainage lines that provide habitat for threatened frogs, or non-native
trees used as a roost for grey-headed flying-fox. Part 4 of this Manual explains requirements
for identifying prescribed impacts.
2Decision-maker includes: consent authorities for development applications under Part 4 of the EP&A Act; the
Minister for Planning and Public Spaces for activities under Part 5.1 of the EP&A Act; determining authorities for
activities under Part 5 of the EP&A Act; the Native Vegetation Panel for approvals for clearing native vegetation
under s.60ZF of the LLS Act and permits under clause 14 of the Vegetation SEPP; the Minister for Environment
and Energy in relation to biodiversity certification under Part 8 of the BC Act and biodiversity stewardship
agreements under Part 5.5 of the BC Act (BAM 2020, Glossary).
6Biodiversity Assessment Method 2020 Operational Manual – Stage 1
1. Documenting Stage 1 outcomes
1.1 Requirements for Biodiversity Assessment Reports
The outcomes of Stage 1 are documented in all Biodiversity Assessment Reports (BARs).
BARs include Biodiversity Development Assessment Reports (BDARs), Biodiversity
Certification Assessment Reports (BCARs) and Biodiversity Stewardship Site Assessment
Reports (BSSARs).
The minimum information required in a:
• BDAR and a BCAR is provided in BAM Appendix K, Tables 24 and 25
• BDAR and a BCAR using the streamlined assessment modules is provided in BAM
Appendix L, Tables 26, 27 and 28
• BSSAR is provided in BAM Appendix M, Tables 29 and 30.
The requirements for a BAR are reiterated at the beginning of each Part of the Manual.
1.2 Requirements for maps
The BAR must include two maps of the subject land – the Site Map and the Location Map –
based on digital aerial photographs, such as ADS40 or the best available imagery. The
minimum standards for these maps are:
1. Site Map at a capture scale of 1:1,000 or finer showing:
○ property boundary
○ boundary of the subject land
○ cadastre boundaries within the subject land (including labelling of Lot and DP or
section plan if relevant)
○ landscape features identified in BAM Subsection 3.1.3
2. Location Map at a capture scale of 1:1,000 or finer showing:
○ the boundary of the subject land
○ the assessment area, which includes the subject land and a 1500 metre buffer
surrounding the outside edge of the boundary of the subject land or 500 metres
along each side of the centre line of a linear-shaped proposal (e.g. highway or
major road)
○ landscape features identified in BAM Subsection 3.1.3
○ additional relevant details such as local government area boundaries and Local
Land Services boundaries.
Capture scale refers to the scale of the digital dataset. BAM Appendices K, L and M require
all digital datasets to be submitted with the BAR in a geographic information system (GIS)
format agreed to by the decision-maker.
Printed maps can be at a different scale to the requirements above if all relevant features
and text are readable. For example, if edges are defined and delineated, the map may be
presented at a scale that can be displayed on an A4 page, in line with the rest of the report.
Multiple maps (on A4 pages) can be used to present landscape features in detail, providing
each map is the same scale for comparison. Insets should be used to show each map
location relative to the subject land.
Maps in the BAR must have a clear legend for all features, categories and boundaries and
should also include standard components for interpretation, such as a scale and north arrow.
7Biodiversity Assessment Method 2020 Operational Manual – Stage 1
1.3 Introduction to the Biodiversity Assessment Report
For proposals other than an application for a biodiversity stewardship agreement, the
following information must be included in an introduction to the BAR (BAM Section 2(3.)):
• description of the proposal and any additional clearing associated with
temporary/ancillary construction facilities, infrastructure or operational maintenance
activities. Detailed plans will support the description of the proposal and aid the
decision-maker
• map of the final proposal footprint (operational footprint) and construction footprint for
any clearing associated with temporary/ancillary construction facilities and infrastructure
• identification and justification of the threshold that triggered the requirement for the
proposal to be assessed under the BOS:
○ native vegetation clearing or a prescribed biodiversity impact on land mapped on
the Biodiversity Values Map or
○ clearing of native vegetation that exceeds the area threshold or
○ the proposal is likely to significantly affect threatened species or ecological
communities or their habitats according to the threatened species test of
significance or
○ the proposed activity requires environmental assessment under Part 5 of the EP&A
Act and will be carried out in a declared Area of Outstanding Biodiversity Value.
A report from the Biodiversity Values Map and Threshold tool, stating whether the BOS
threshold is triggered, may be attached to the BAR. This report may also be requested by
the decision-maker. This applies to the Biodiversity Values Map and area clearing triggers
only. If neither of these triggers apply to the proposal and it is likely to significantly affect
threatened species or ecological communities or their habitats, a report detailing the
threatened species test of significance results may be attached to the BAR.
8Biodiversity Assessment Method 2020 Operational Manual – Stage 1
2. Part 1: Establishing the site context
This Part outlines the landscape features that must be identified on the maps of the subject
land and assessment area and recorded in the BAR.
The landscape surrounding a site will strongly influence the biodiversity values of that site
(Andren 1994; Fahrig 1997, 2001). The suite of landscape features assessed in the BAM are
used to inform the habitat suitability of the subject land for threatened species, the potential
movement of species across the landscape and the prediction of gain in biodiversity value at
a biodiversity stewardship site.
Consequently, not all information documented in this Part is directly used to calculate
biodiversity credits. However, it will aid the decision-maker in forming their opinion on the
proposal, and the BCT in their review of a biodiversity stewardship application.
2.1 Requirements for the Biodiversity Assessment Report
By the end of this Part of the Manual and BAM Chapter 3 the assessor will be able to
complete the following information in the BAR (see BAM Appendices K and M for minimum
requirements for Stage 1 biodiversity assessments and Appendix L for streamlined
assessment modules).
Table 1 Requirements for the BAR – Site context
Information Maps, tables and data
Identification and description of the Digital GIS files must be provided for all maps and
following landscape features on the spatial data in a format agreed to by the decision-
subject land and within the maker. Polygons are suitable for most spatial data
assessment area: requirements unless points or lines are specified.
All maps must be easy to read with clear headings,
keys, colour ramps and symbols.
Data must be provided in a format that can be
analysed (e.g. MS Excel or other downloadable format).
Subject land area (ha) Map: Boundary of the subject land including the cadastre
Assessment area (ha) including the Map: Boundary of the assessment area including digital
subject land and a 1500 m (or 500 m aerial photography at 1:1,000 scale or finer and boundary
for linear proposals) buffer of the subject land
IBRA bioregions and subregions Table: List of IBRA bioregions and subregions that
intersect the subject land and assessment area
Map: IBRA bioregions and subregions that intersect the
subject land and assessment area
Rivers, streams, estuaries and Map: Location of rivers, streams (using Strahler stream
wetlands ordering), estuaries and wetlands that intersect the
subject land and assessment area
Connectivity of different areas of Map: Mapped areas of habitat connectivity on the subject
habitat that may serve as movement land and assessment area
corridors for threatened species across
their range including flyways for
migratory species (for proposed wind
turbines)
9Biodiversity Assessment Method 2020 Operational Manual – Stage 1
Information Maps, tables and data
Areas containing karst, caves, Map: Location of karst, caves, crevices, cliffs, rocks or
crevices, cliffs, rocks or other other geological features of significance
geological features of significance
Areas of Outstanding Biodiversity Table: List of AOBVs that intersect the subject land and
Value (AOBV) assessment area
Map: AOBVs on the subject land and assessment area
Soil hazard features (for vegetation Map: Location of any soil hazard features that occur on
clearing proposals that require the subject land (for vegetation clearing proposals that
approval under Part 5A of the LLS Act, require approval under Part 5A of the LLS Act, or a permit
or a permit under the Vegetation under the Vegetation SEPP)
SEPP)
NSW (Mitchell) landscapes Table: List of NSW (Mitchell) landscapes that intersect
the subject land and assessment area
Map: Boundary of NSW (Mitchell) landscapes on the
subject land and assessment area
Native vegetation cover including: Map: Total area of native vegetation within the
• total area of native vegetation assessment area (see Figure 1)
within the assessment area
(hectares)
• total percentage of native
vegetation estimated in the
assessment area
• cover class (0–10%, >10–30%,
>30–70% and >70% automatically
assigned by the BAM-C)
2.2 Identify landscape features
Information on the following landscape features must be provided in the BAR and mapped
on the Site and Location maps.
2.2.1 Interim Biogeographic Regionalisation for Australia bioregions
and subregions
The Interim Biogeographic Regionalisation for Australia (IBRA) classifies Australia’s
landscape into geographically distinct regions known as bioregions or IBRA regions. These
IBRA regions are based on a common climate, geology landform, native vegetation and
species information. They are further subdivided into subregions based on localised patterns
of geomorphology within each bioregion. The IBRA mapping is updated as improved spatial
mapping and information on vegetation communities and ecosystems becomes available.
The current version, released in 2015, is IBRA7. Version 7 of the IBRA identifies 17 IBRA
regions and 135 IBRA subregions in New South Wales. The most current version of the
IBRA should be used to identify the IBRA bioregions and IBRA subregions in which the
subject land and assessment area is located.
If the subject land is located within more than one IBRA subregion, the IBRA subregion
selected should be the one within where the largest proportion of impact/area of BSA will
occur, with justifications provided in the BAR.
For linear-shaped developments that cross multiple IBRA subregions, the assessor must
conduct separate habitat suitability assessments (refer to Part 3 of this Manual) for each
IBRA subregion. However, vegetation zones may extend across each IBRA subregion. The
10Biodiversity Assessment Method 2020 Operational Manual – Stage 1
BAM-C user guide provides instructions. This option can only be applied where the whole
project is within a single IBRA region with one or more IBRA subregions. If the proposal
crosses an IBRA boundary, a new case will be required in the BAM-C for each new IBRA
region.
The BAM uses IBRA subregions to:
• filter for threatened species likely to use habitat on the subject land
• filter for PCTs that may occur on the subject land
• filter for TECs that occur on the subject land
• identify where ecosystem credits can be sourced to offset the impacts of development
• apply the variation rules under the BOS and as identified in section 6.4(1) of the BC Act.
Additionally, the BAM uses IBRA regions to identify where alternative species credits can be
sourced in accordance with the variation rules under the BOS (see section 6.4 of the BC
Regulation 2017).
Regional benchmarks used by the BAM-C are also established at the IBRA/vegetation class
scale.
2.2.2 Rivers, streams, estuaries and wetlands
Rivers and streams on, adjacent to, and downstream of the subject land and within the
assessment area must be mapped according to the Strahler stream ordering system (see
BAM Appendix E). Table 14 in BAM Appendix E shows riparian buffer distances that must
be measured on both sides of the stream.
Estuaries that occur on, adjacent to, and downstream of the subject land and within the
assessment area must also be identified and mapped in the BAR. Information on the
location and physical characteristics of NSW estuaries can be found at Estuaries of NSW:
Physical characteristics, tidal surveys and hydrographic surveys, see Appendix A for
weblink.
Wetlands, including important wetlands, on, adjacent to, and downstream of the subject land
and within the assessment area must also be identified and mapped in the BAR. An
important wetland is defined as a wetland that is listed in the Directory of Important Wetlands
in Australia or a coastal wetland identified in State Environmental Planning Policy (Coastal
Management) 2018.
The riparian buffer distances in Table 14 in BAM Appendix E must be mapped. The
assessor must identify the subject land in relation to all rivers, streams, estuaries and
wetlands, including buffer areas, on the Site Map. The assessor must identify all rivers,
streams, estuaries and wetlands that are on, adjacent to, and downstream of the subject
land and within the assessment area on the Location Map.
2.2.3 Habitat connectivity
Habitat connectivity can be identified at different scales depending on the target entities that
are present or likely to be present. Habitat connectivity can include recognised biodiversity
corridors identified by the Department of Planning, Industry and Environment (the
Department) (e.g. priority investment areas), flyways for migratory species, a riparian buffer
of a stream, wetland or estuary, or a local corridor identified by a local council.
Areas of connectivity addressed elsewhere in the BAR, for example, a flyway identified in
accordance with BAM Subsection 6.1.5, should be mapped and described once in Stage 1
and then referenced in subsequent sections of the BAR.
11Biodiversity Assessment Method 2020 Operational Manual – Stage 1
2.2.4 Karst, caves, crevices, cliffs, rocks and other geological features
of significance
A site inspection will be required to accurately identify, describe and map where these
features occur on the subject land. Where these features are addressed elsewhere in the
BAR, for example, when identifying prescribed biodiversity impacts in accordance BAM
Subsection 6.1.1, they should be mapped and described once in Stage 1 and then
referenced in subsequent sections of the BAR.
2.2.5 Areas of Outstanding Biodiversity Value
Areas of Outstanding Biodiversity Value (AOBVs) are declared by the Minister for the
Environment and published on the AOBV public register. Currently, critical habitat for the
little penguin population at Manly, Mitchell’s rainforest snail in Stotts Island Nature Reserve,
Gould’s petrel on Cabbage Tree Island, and the Wollemi pine are AOBVs.
Where an AOBV occurs on the subject land or assessment area, it must be mapped on the
Site and Location Maps. The little penguin AOBV at Manly is included in the Biodiversity
Values Map and is visible using the identify tool in the Biodiversity Values Map and
Threshold tool. Currently, the other three AOBVs are located in protected areas managed by
the NSW National Parks and Wildlife Service. Contact the Department via
bam.support@environment.nsw.gov.au if you require further details about these AOBVs.
2.2.6 NSW (Mitchell) landscapes
NSW (Mitchell) landscapes, formerly known as Mitchell landscapes, are mapped at a broad
scale. As such, the actual NSW (Mitchell) landscape in which the subject land occurs may
not always be the landscape shown on the NSW (Mitchell) landscapes maps. Where the
description of an adjacent NSW (Mitchell) landscape more accurately reflects the landscape
based on field observation, the adjacent NSW (Mitchell) landscape should be chosen with
justification provided in the BAR. Descriptions for NSW (Mitchell) landscapes are available
via SEED (see Appendix A).
If the subject land is located within more than one NSW (Mitchell) landscape, the assessor
should select the NSW (Mitchell) landscape in which the largest proportion of impact or
improvement will occur.
2.2.7 Soil hazard features
Soil hazard features such as dryland salinity, acidification, compaction, structural
breakdown, sodicity and contamination will require onsite assessment to accurately map
location and extent. Assessors can use resources such as hydrogeological mapping and
acid sulfate soil risk mapping to support field observations.
2.3 Percent native vegetation cover
Percent native vegetation cover refers to the amount of native vegetation 3 (woody and non-
woody) that is estimated to remain in the landscape proximal to the assessment area.
It is used:
3Native vegetation includes regrowth and planted native vegetation comprised of plants native to New South
Wales.
12Biodiversity Assessment Method 2020 Operational Manual – Stage 1
• as a filter by the BAM-C to predict threatened species likely to occur or use habitat on
the subject land (see BAM Subsection 5.2)
• to define the intrinsic rate of increase in species richness and plant cover as part of the
assessment of future vegetation condition on a biodiversity stewardship site (see
Equation 10 in the BAM).
The percent native vegetation cover is assessed by applying a 1500 metre buffer around the
edge of the subject land and digitising all native vegetation within, using GIS editing tools
and aerial photography (such as ADS40 imagery or other best available imagery for the site)
(see Figure 1 in Box 1). The total area of native vegetation is calculated across the
assessment area. Information that must be recorded in the BAR includes:
• whole numbers – the total assessment area, the area of native vegetation within the
assessment area in hectares
• percentages – the percentage of native vegetation estimated in the assessment area
(the assessor also enters this figure into the BAM-C)
• cover class – in accordance with BAM Section 3.2(3.) (cover classes range from 0–10%,
>10–30%, >30–70% and >70% and are automatically assigned by the BAM-C once the
percentage of native vegetation cover is entered).
Where the development is a linear shape (e.g. a major road or highway development) the
1500 metre buffer is replaced with a 500 metre buffer following the centre line of the subject
land (see Figure 2 in Box 1).
This requirement in the BAM is primarily a desktop assessment and the assessor is
expected to use professional judgement and their knowledge of the landscape when
determining native vegetation cover. Clear justifications must accompany the outcome
determined by the assessor, particularly in relation to areas of vegetation that have been
excluded from the assessment. For example, verification through field assessment to identify
areas of non-native vegetation is a strong justification for their removal from the assessment
area. These areas must be clearly indicated on the Location Map and documented in the
BAR.
2.4 Field reconnaissance
The extent and condition of landscape features on the subject land are confirmed by site
inspections, particularly geological features of significance (e.g. karst, caves, crevices, cliffs,
rocks) or the presence of non-native vegetation that may be difficult to interpret from remote
imagery. The assessor can use any ground-truthed information to adjust maps and percent
native vegetation cover estimates.
Where access to private property or the size and configuration of the assessment area limits
the ability to conduct a field assessment, the assessor should apply professional judgement,
and record the methods used and assumptions made in the BAR.
13Biodiversity Assessment Method 2020 Operational Manual – Stage 1
Box 1 – Examples of assessing percent native vegetation cover
Figure 1 Example of subject land with a 1500 m buffer
The subject land has a 1500 metre buffer measured from the boundary of the subject
land. The percent of native vegetation cover is calculated within the buffer (blue) and
subject land (green) areas.
In this example, the assessment area is 1162 hectares and the area of native
vegetation within the assessment area (outlined in orange) is 415 hectares. Therefore,
the percent of native vegetation cover for this assessment proposal is estimated to be
approximately 36%. The small areas of woody vegetation that are within the
assessment area and not outlined in orange were assessed as non-native vegetation
and therefore are not included in this map.
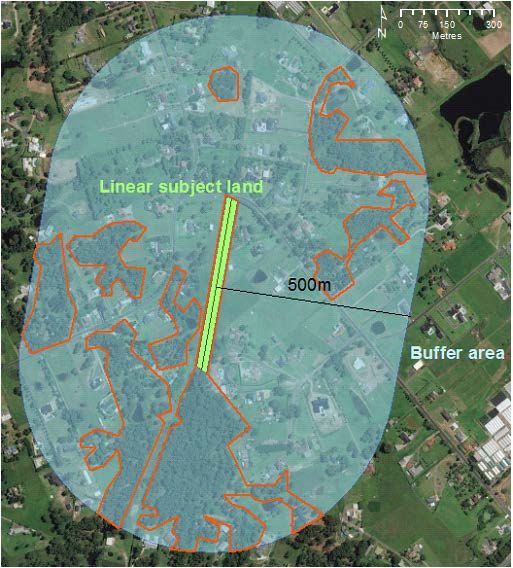
14Biodiversity Assessment Method 2020 Operational Manual – Stage 1
Box 1, continued
Figure 2 Example of linear development with 500 m buffer around the subject land
Linear sites have a 500 metre buffer measured from the centre line of the subject land.
The percentage of native vegetation cover is calculated within the buffer (blue) and
subject land (green) area.
In this example, the assessment area is 130 hectares and the area of native vegetation
cover (outlined in orange) is 31.5 hectares. Therefore, the percentage of native
vegetation cover is 24%. The small areas of woody vegetation that are within the buffer
area and not outlined in orange were assessed as non-native vegetation and therefore
are not included in this map.
15Biodiversity Assessment Method 2020 Operational Manual – Stage 1
3. Part 2: Assessing native vegetation,
threatened ecological communities and
vegetation integrity
This Part outlines the:
• process for mapping and identifying the native vegetation (PCTs and TECs) on the
subject land
• process for stratifying native vegetation into vegetation zones, which are based on the
PCT and broad vegetation condition
• role of benchmarks in the assessment
• field method used to collect data from each vegetation zone
• process to estimate vegetation condition, called the VI score.
3.1 Requirements for the Biodiversity Assessment Report
By the end of this Part of the Manual and BAM Chapter 4 the assessor will be able to
complete the following information in the BAR (see BAM Appendices K and M for minimum
requirements for Stage 1 biodiversity assessments).
Table 2 Requirements for the BAR – Native vegetation, TECs and VI
Information Maps, tables and data
Identification and description of the Digital GIS files must be provided for all maps and
following native vegetation features spatial data in a format agreed to by the decision-
on the subject land: maker. Polygons are suitable for most spatial data
requirements unless points or lines are specified.
All maps must be easy to read with clear headings,
keys, colour ramps and symbols.
Data must be provided in a format that can be
analysed (e.g. MS Excel or other downloadable format).
Native vegetation cover on the subject Map: Boundary of the native vegetation extent within the
land and a description of any subject land
differences between aerial images and
final mapped native vegetation cover
Areas of the subject land that do not Map: Boundary of areas of the subject land that do not
contain native vegetation & justification contain native vegetation
PCTs within the subject land, Map: PCTs and TECs within the subject land
including: Table: PCTs and TECs within the subject land, TEC
• vegetation class listing and status (NSW and Commonwealth), PCT and
• vegetation type (i.e. PCT names TEC area (ha)
and ID numbers) Map: Plot locations relative to PCTs including GPS
• area (ha) coordinates (Point – GDS zone, eastings, northings and
• species relied upon for identification bearings) and labelled according to field datasheets and
of vegetation type and relative consistent with the BAR)
abundance Table: Plot field data and sheets (scan if hardcopies)
• TEC status, where relevant Table: Outcomes of any analysis undertaken to identify
• estimate of percent cleared value of PCTs, could include graphs or other outputs
the PCT (available in the BioNet
Vegetation Classification)
• evidence and justification of the
decision pathway used in
identification of PCTs (e.g.
vegetation structure and landscape
position/geomorphology)
16Biodiversity Assessment Method 2020 Operational Manual – Stage 1
Information Maps, tables and data
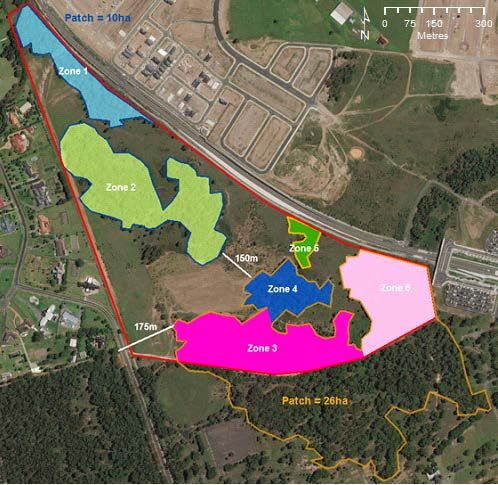
Vegetation integrity assessment, Map: Vegetation zones (labelled according to the BAM-C
including: and consistent with the BAR) and locations of the patches
• description of vegetation zones used to determine patch size for each vegetation zone
within the subject land with Table: Vegetation zones with area (ha), sampling effort
justification for assigning PCTs to (number of plots per vegetation zone) and patch size
vegetation zones (area/s for each vegetation zone)
• area (ha) of each vegetation zone Table: Plot field data and sheets (scan if hardcopies)
• patch size (ha) for each vegetation Table: Vegetation integrity scores for each vegetation
zone zone within the subject land
• survey effort (number of plots per
vegetation zone)
• composition, structure, function and
VI scores
Where the use of more appropriate Table: More appropriate local data used
local data is proposed, identify:
• source of information for local
benchmark data
• justification for use of local data in
preference to database values
• written agreement from the
decision-maker supporting use of
more appropriate local data
3.2 Native vegetation extent
BAM Section 4.1 requires the extent of native vegetation cover (woody and non-woody
vegetation), on the subject land to be delineated on the Site Map. These data are not
entered into the BAM-C but reported in the BAR.
Mapping requirements mirror those for percent native vegetation cover in ‘Part 1 –
Establishing the site context’ but are restricted to the subject land only.
The assessor needs to:
• access digital aerial photography (such as ADS40 imagery) or best available imagery at
a scale no greater than 1:10,000
• digitise and clearly indicate:
○ the boundary of the subject land
○ all areas of native vegetation including areas that are ground cover only (e.g.
grasslands)
○ all areas that do not contain native vegetation (e.g. cleared land) or other site
features to be assessed for habitat suitability (in accordance with BAM Chapter 5)
and/or proposed for restoration at a stewardship site (Stage 3 of the BAM)
• identify changes in native vegetation extent (i.e. due to clearing) since the remote image
capture, confirm vegetation boundaries through site inspection (or fine-scale native
vegetation maps if available) and amend the Site Map accordingly. Differences between
the remote image and the vegetation extent shown on the Site Map must be
documented in the BAR.
17Biodiversity Assessment Method 2020 Operational Manual – Stage 1
3.3 Stratify native vegetation
Vegetation zones are relatively homogenous units defined by a unique NSW PCT and broad
condition state.
Vegetation is used as a surrogate for assessing general ecosystem biodiversity values. The
BAM uses PCTs as the basis for vegetation community classification. PCTs are assigned to
a vegetation class, which is in turn nested within a vegetation formation (Figure 3).
Evidence-based changes to PCT profile information and changes in the total number of
PCTs will occur over time. The standard operational classification hierarchy of native
vegetation in New South Wales illustrates the three nested classifications as shown in
Figure 3.
Figure 3 NSW vegetation classification hierarchy
The PCT classification represents the full geographic distribution of each plant community.
The BAM uses the term PCT when referring to an ecological community (which many
ecologists term ‘vegetation’ in a structural sense) and the assessor should select the most
likely PCT from the Veg-C application to identify vegetation on the subject land. The most
likely PCT must be justified using a quantitative analysis of plot data in which the species are
matched to the potential list of PCTs that could occur in that location (BAM Section 4.2). This
is often prepared as an analysis that considers all PCTs at a subregional or greater scale.
Existing information for the subject land (e.g. past survey data, vegetation maps or previous
reports) may also be useful in assigning a PCT. The State Vegetation Type Map (see
Appendix A) available via SEED, maps the distribution of PCTs across New South Wales
and is available for specific regions at the time of publication. Where an assessor identifies
the likely PCT and this PCT is not provided in the list of potential PCTs shown by the BAM-
C, the assessor can search for and add PCT that are considered to occur outside of the
IBRA.
18Biodiversity Assessment Method 2020 Operational Manual – Stage 1
3.3.1 Identify native plant community types and ecological communities
on the subject land
The assessor must identify and map PCTs located on the subject land in accordance with
BAM Sections 4.2 and 4.3. PCT classifications are described in the BioNet Vegetation
Classification and include the following information, where relevant, to aid field identification:
• dominant canopy species
• main associated species
• landscape position
• characteristic mid-storey species
• characteristic ground cover species
• other diagnostic features and descriptive fields.
PCTs are identified via vegetation strata. The approach differs from that used to determine
VI, which records vegetation condition within growth form groups.
To identify a PCT the assessor must:
1. Review existing information for the subject land (e.g. past survey data, vegetation maps
or previous reports). Mapping products often include vegetation communities based on
statistical analysis (e.g. PATN), and as such include useful fidelity tables that describe
diagnostic and characteristic taxa, which may be useful in assigning a PCT. Any existing
information used to identify PCTs in the subject land should be reported in the BAR.
2. Determine survey design and number of plots required to confidently identify the PCT/s
on the subject land. Use the outcomes of 1 above, the level of environmental variation on
the subject land, gaps in existing mapping and information, and the vegetation extent to
inform this determination.
3. Undertake plot-based floristic vegetation survey in a 20 m x 20 m plot.
4. Collect the vegetation survey data listed in Table 3 below at each plot.
Table 3 Vegetation survey data requirements
Attribute Survey requirement
Growth form Growth form for each recorded native species
Species name Scientific name of each species and whether it is native or exotic
Cover Estimate the foliage cover of each native and exotic species within the
boundaries of the plot including all attached plant material, alive or dead,
rooted in or overhanging the plot. Cover should be recorded:
• in decimals if less than 1% (e.g. 0.1, 0.2)
• in whole numbers up to 5% (e.g. 1, 2, 3)
• to the nearest 5% if >5% cover (e.g. 5, 10, 15, 20, 25)
Abundance rating Count (when ≤10) or estimate (when >10) the number of individuals of each
native and exotic species rooted within the plot. Record abundance as:
• counts of 1, 2, 3…
• estimates of 10, 20, 30…
• 100, 200, 300…
• 1000, 2000, 3000…
5. Combine vegetation survey data with existing information in 1 above to identify PCT/s on
the subject land.
6. Provide evidence in the BAR in accordance with BAM Subsection 4.2.3 to support the
selection of the PCTs.
7. Finalise the mapped distribution of PCTs on the subject land.
19Biodiversity Assessment Method 2020 Operational Manual – Stage 1
Boundaries between PCTs are rarely distinct; and mapping the distribution of a PCT will
usually involve determining a line of best fit.
Vegetation that does not strictly meet the definition of a PCT, as per the BioNet Vegetation
Classification, can be allocated to the PCT to which it most closely aligns. PCT selection
must be documented, with justifications, in the BAR.
The assessment of ground cover should be conducted at a time when indigenous vegetation
is most abundant and is easiest to identify. Species naming and classification must be in
accordance with the NSW Herbarium (refer to PlantNET NSW; see Appendix A for weblink).
Specimens of species that cannot be identified during field work should be collected for
identification. Genus (or Family name) can be used to record species where the appropriate
fertile material for identification is unavailable.
PCTs that are classified in the vegetation class as inland saline lakes, mangrove swamps or
saltmarshes under the saline wetland vegetation formation must be assessed according to
the BAM. For development, clearing, activity or biodiversity certification proposals that
impact on PCTs and any TECs classified under saline wetlands formation, the Department
also recommends assessors consult with NSW Fisheries (refer to the Fisheries NSW policy
and guidelines for fish habitat conservation and management (update 2013); see Appendix
A for weblink). BSA proposals may be developed for these plant community types.
In addition to identifying and mapping the PCTs on the Site Map the assessor is required to:
1. record the estimated percent cleared value of each PCT
2. identify and map the distribution of:
• TECs that are associated with the PCTs
• derived or secondary vegetation or planted native vegetation and the PCT to which it
is allocated in accordance with Box 2.
Box 2 – Supporting information for determination of percent cleared
value, TEC status, and derived, planted or secondary vegetation
communities
Percent cleared value
The percent cleared value for a PCT can be obtained from the BioNet Vegetation
Classification. It is also displayed in the BAM-C. Percent cleared value is the proportion
of remnant PCT relative to the estimated distribution prior to 1750. The value is used to
determine the offset trading group for non-threatened plant community types (see BAM
Subsection 10.2.1).
Threatened ecological communities
The BioNet Vegetation Classification provides an indication of whether a PCT may be a
TEC; the list is not exhaustive. The assessor must determine whether any of the
vegetation meets the definition of a TEC listed under the BC Act. For example, the
assessor should compare the PCT description to that of the NSW Scientific Committee
Determination, which describes the community composition of a likely TEC. Up to date
information on TEC listings for New South Wales can be found on the NSW Threatened
Species webpage (see Appendix A). Case law may also be consulted to determine if
vegetation meets the definition of a TEC.
20You can also read