Rocky Reef Fishery Level 2 Ecological Risk Assessment - Productivity & Susceptibility Analysis (PSA)
←
→
Page content transcription
If your browser does not render page correctly, please read the page content below
Rocky Reef Fishery
Level 2 Ecological Risk Assessment
Productivity & Susceptibility Analysis (PSA)
Level 2 Ecological Risk Assessment
        Rocky Reef Fishery

               Lisa Walton and Ian Jacobsen

 Fisheries Queensland, Department of Agriculture & Fisheries

                 with contributions from the

          Queensland Rocky Reef Working Group.
This publication has been compiled by L. Walton and I. Jacobsen of Fisheries Queensland, Department of Agriculture and
Fisheries
Enquiries and feedback regarding this document can be made as follows:
Email: info@daf.qld.gov.au
Telephone: 13 25 23 (Queensland callers only)
(07) 3404 6999 (outside Queensland)
Monday, Tuesday, Wednesday and Friday: 8 am to 5 pm, Thursday: 9 am to 5 pm
Post: Department of Agriculture and Fisheries GPO Box 46 BRISBANE QLD 4001 AUSTRALIA
Website: daf.qld.gov.au
Interpreter statement
The Queensland Government is committed to providing accessible services to Queenslanders from all culturally and
linguistically diverse backgrounds. If you need an interpreter to help you understand this document, call 13 25 23 or
visit daf.qld.gov.au and search for ‘interpreter’.
© State of Queensland, 2021.
The Queensland Government supports and encourages the dissemination and exchange of its information. The copyright in
this publication is licensed under a Creative Commons Attribution 4.0 International (CC BY 4.0) licence.
Under this licence you are free, without having to seek our permission, to use this publication in accordance with the licence
terms.
You must keep intact the copyright notice and attribute the State of Queensland as the source of the publication.
Note: Some content in this publication may have different licence terms as indicated.
For more information on this licence, visit creativecommons.org/licenses/by/4.0.
The information contained herein is subject to change without notice. The Queensland Government shall not be liable for
technical or other errors or omissions contained herein. The reader/user accepts all risks and responsibility for losses,
damages, costs and other consequences resulting directly or indirectly from using this information.Executive Summary
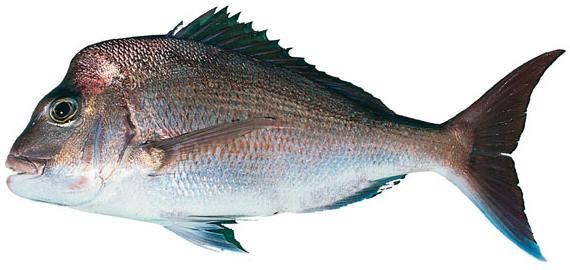
The Rocky Reef Fishery (RRF) is a line-only fishery that targets a small number of demersal and
pelagic fin fish. This includes recreationally important species like snapper (Chrysophrys auratus),
pearl perch (Glaucosoma scapulare), grass emperor (Lethrinus laticaudis) and mahi mahi
(Coryphaena hippurus). In July 2019, a whole-of-fishery or Level 1 ERA was released for the RRF
(Jacobsen et al., 2019a). The Level 1 ERA provided a broad risk profile for the RRF, identified the key
drivers of risk and the ecological components most likely to experience an undesirable event. As part
of this process, the Level 1 ERA considered both the current fishing environment and what can occur
under the current management regime. In doing so, the outputs of the Level 1 ERA helped
differentiate between low and high-risk elements and established a framework that can be built on in
subsequent ERAs.
In the Level 2 ERA, the focus of the assessment shifts to individual species with risk evaluations
based on a Productivity & Susceptibility Analysis (PSA). It considers fishing activities across the
commercial, charter and recreational fishing sectors, and evaluates risk through an assessment of
seven biological attributes (age at maturity, maximum age, fecundity, maximum size, size at maturity,
reproductive strategy, and trophic level) and up to seven fisheries-specific attributes (availability,
encounterability, selectivity, post-capture mortality, management strategy, sustainability assessments
and recreational desirability / other fisheries). As the PSA can over-estimate risk for some species
(Zhou et al., 2016), this Level 2 ERA also included a Residual Risk Analysis (RRA). The RRA gives
further consideration to risk mitigation measures that were not explicitly included in the PSA and/or
any additional information that may influence the risk status of a species (Australian Fisheries
Management Authority, 2017). The primary purpose of the RRA is to minimise the number of false
positives or instances where the risk level has been overestimated.
The scope of the Level 2 ERA was based on the outcomes of a whole-of-fishery (Level 1) assessment
(Jacobsen et al., 2019a) and focused specifically on target & byproduct species. A review of catch
data for the RRF produced a preliminary list of 13 target & byproduct species that were considered for
inclusion in the Level 2 ERA. This list was reduced to 10 species through a subsequent rationalisation
process and included snapper, pearl perch, cobia (Rachycentron canadum), grass emperor,
amberjack (Seriola dumerili), teraglin (Atractoscion aequidens), Australian bonito (Sarda australis),
leaping bonito (Cybiosarda elegans), yellowtail kingfish (Seriola lalandi), and mahi mahi. As the grey
nurse shark (Carcharius tarus) was a key driver of risk in the shark ecological component Level 1
ERA (Jacobsen et al., 2019a), it was also included in the Level 2 ERA as a precautionary measure.
When the outputs of the PSA and RRA were taken into consideration, eight species were assessed
as being at high risk from fishing activities in the RRF. Risk profiles for target & byproduct species
were heavily influenced by the susceptibility component with management limitations (e.g. the
absence of control on catch and effort at the whole-of-fishery level), stock status uncertainty, an
absence of information on biological reference points and increased cumulative fishing pressures
(commercial, recreational plus charter fishing), all identified as key drivers of risk. A number of these
risks are already being addressed through the Rocky Reef Fishery Working Group and harvest
strategy development process (Department of Agriculture and Fisheries, 2017a; b; 2020a).
Of the species assessed, the risk posed to snapper and pearl perch were viewed as more significant.
However, outputs of the Level 2 ERA suggests that the risk posed to cobia, grass emperor and
teraglin require further investigations. The remaining six species (amberjack, Australian bonito,
ivleaping bonito, yellowtail kingfish, mahi mahi, and grey nurse shark), were all assigned precautionary
risk ratings as they are more representative of the potential risk. Management of the risk posed to
species with precautionary risk ratings, beyond what is already being undertaken as part of
the Queensland Sustainable Fisheries Strategy 2017–2027 (Department of Agriculture and
Fisheries, 2017b), is not considered an immediate priority. With improved information, it is
hypothesised that the risk ratings for a number of these species (e.g. bonito, and mahi mahi) could be
reduced and/or they could be excluded from future risk assessments involving the RRF.
Outputs from the Level 2 ERA take into consideration the current dynamics of the commercial fishery
(e.g. catch, effort and participation rates), the charter fishery, and available data on the recreational
fishing sector. In doing so, the assessment provides insight into some of the more immediate risks
posed by line fishing activities in Queensland. These results provide a sound baseline of assessments
that can be reviewed and amended (where appropriate) to accommodate additional data or
management reforms. In this context, the following measures would assist with respect to mitigating,
managing and understanding risk in the RRF.
– Identify avenues/mechanisms that can be used to a) improve catch monitoring in the RRF
(preferably in real or near-real time), b) minimise the risk of non-compliance (e.g. black
marketing), and c) validate information obtained through the logbook program (commercial
and charter fishing).
– Improve the level of information on the biology, stock structure, and status of species other
than snapper and pearl perch to better monitor catch against biological reference points and
manage fishing pressures against target reference points.
– Review the suitability, applicability, and value of data submitted through the logbook program
on the dynamics of the fishery. As part of this process, it is recommended that the logbook
reporting requirements be extended to include information on what fishing symbol is being
used.
– Reassess species with high-risk ratings once a harvest strategy has been fully implemented in
the fishery, prioritising both snapper and pearl perch.
– Evaluate options for the extended use of output controls for secondary target & byproduct
species noting that TACC limits are already applied to snapper and pearl perch.
– Implement measures to improve the level of information on fine-scale effort movements, with
particular emphasis on increasing our understanding of regional fishing pressures / cumulative
fishing risks e.g. the suitability, applicability, or necessity of having additional protections for
key species in high-usage areas.
– Quantify the cumulative fishing pressures exerted on key species from the recreational fishing
sector and, when and where appropriate, review the suitability/applicability of possession
limits for rocky reef species, explore avenues to improve monitoring across sectors, and
collect more information on recreational catch rates, discards, post-capture mortality, and non-
compliance.
– Improve the level of information on discards, survival rates, and the extent of
cryptic/unreported mortalities including shark depredation.
v– Establish a measure to estimate the gear-affected area and, when available, reassess the risk
posed to teleosts species using a more quantitative ERA method such as the base
Sustainability Assessment for Fishing Effects (bSAFE).
Summary of the outputs from the Level 2 ERA for the Rocky Reef Fishery.
Common name Species name Productivity Susceptibility Risk rating
Target & Byproduct
Snapper Chrysophrys auratus 1.71 2.86 High
Pearl perch Glaucosoma scapulare 1.43 2.86 High
Cobia Rachycentron canadum 1.71 2.86 High
Grass emperor Lethrinus laticaudis 1.43 2.86 High
Amberjack Seriola dumerili 1.71 2.71 Precautionary High
Teraglin Atractoscion aequidens 1.86 3.00 High
Australian bonito Sarda australis 1.43 2.57 Precautionary Medium
Leaping bonito Cybiosarda elegans 1.43 2.57 Precautionary Medium
Yellowtail kingfish Seriola lalandi 1.71 2.86 Precautionary High
Mahi mahi Coryphaena hippurus 1.57 2.57 Precautionary Medium
Other
Grey nurse shark Carcharias taurus 2.71 2.25 Precautionary High
viTable of Contents
Table of Tables ................................................................................................................................... viii
Table of Figures ................................................................................................................................... ix
Definitions & Abbreviations ................................................................................................................. x
1 Introduction ................................................................................................................................... 1
2 Methods ......................................................................................................................................... 2
2.1 The Fishery..................................................................................................................................... 2
2.2 Information Sources / Baseline References ................................................................................... 3
2.3 Species Rationalisation Processes ................................................................................................ 3
2.4 Ecological Risk Assessment Methodology ..................................................................................... 4
2.4.1 Productivity & Susceptibility Analysis (PSA) ................................................................. 6
2.4.2 PSA Scoring .................................................................................................................. 9
2.4.3 Uncertainty .................................................................................................................. 10
2.4.4 Residual Risk .............................................................................................................. 10
3 Results ......................................................................................................................................... 12
3.1 Target & Byproduct Species......................................................................................................... 12
3.2 Grey Nurse Shark ......................................................................................................................... 14
3.3 Uncertainty ................................................................................................................................... 14
3.4 Residual Risk Analysis ................................................................................................................. 14
3.4.1 Target & Byproduct Species ....................................................................................... 14
3.4.2 Grey Nurse Shark ....................................................................................................... 16
4 Risk Evaluation ........................................................................................................................... 16
4.1 Target & Byproduct Species......................................................................................................... 16
4.2 Grey Nurse Sharks ....................................................................................................................... 21
5 Summary ..................................................................................................................................... 23
6 References .................................................................................................................................. 25
7 Appendix ..................................................................................................................................... 31
Appendix A—Species rationalisation process. ............................................................................. 32
Appendix B—Species rationalisation process: justifications and considerations. ....................... 33
Appendix C—Availability overlap percentages used as part of the PSA. .................................... 37
Appendix D—Residual Risk Analysis justifications. ..................................................................... 38
Appendix E—Likelihood & Consequence Analysis. ..................................................................... 50
Appendix F—Summary of management arrangements for rocky reef species. .......................... 54
viiTable of Tables
Table 1. Summary of the outputs from the Level 1 (whole-of-fishery) Ecological Risk Assessment for
the RRF. *Does not include Species of Conservation Concern or target & byproduct species returned
for to the water due to regulations like minimum legal size limits or product quality. ............................. 3
Table 2. Scoring criteria and cut-off scores for the productivity component of the PSA undertaken as
part of the Level 2 ERA. Attributes and the corresponding scores/criteria align with national (ERAEF)
approach (Hobday et al., 2011). ............................................................................................................. 6
Table 3. Scoring criteria and cut-off scores for the susceptibility component of the PSA. Attributes and
the corresponding scores/criteria are largely aligned with ERAEF approach (Hobday et al., 2011). ..... 8
Table 4. Guidelines used to assess residual risk including a brief overview of factors taken into
consideration. Summary represents a modified excerpt from the revised Australian Fisheries
Management Authority (AFMA) Ecological Risk Assessment, Residual Risk Assessment Guidelines
(Australian Fisheries Management Authority, 2018). ............................................................................ 11
Table 5. Preliminary risk ratings compiled as part of the Productivity & Susceptibility Analysis (PSA)
including scores assigned to each attribute used in the assessment. Risk ratings are solely based on
criteria outlined in Table 2 and Table 3 and have not been subject to a Residual Risk Analysis.
*Denotes an attribute that was assigned a precautionary score in the preliminary assessment due to
an absence of species-specific data. .................................................................................................... 13
Table 6. Residual Risk Analysis (RRA) of the scores assigned to each attribute as part of the
Productivity & Susceptibility Analysis (PSA). Attribute scores highlighted in blue represent those that
were amended as part of the RRA. ....................................................................................................... 15
Table 7. Overview of the final risk ratings for the rocky reef species including those where the
introduction of species-specific initiatives are viewed as less of a priority (i.e. precautionary risks). ... 17
viiiTable of Figures
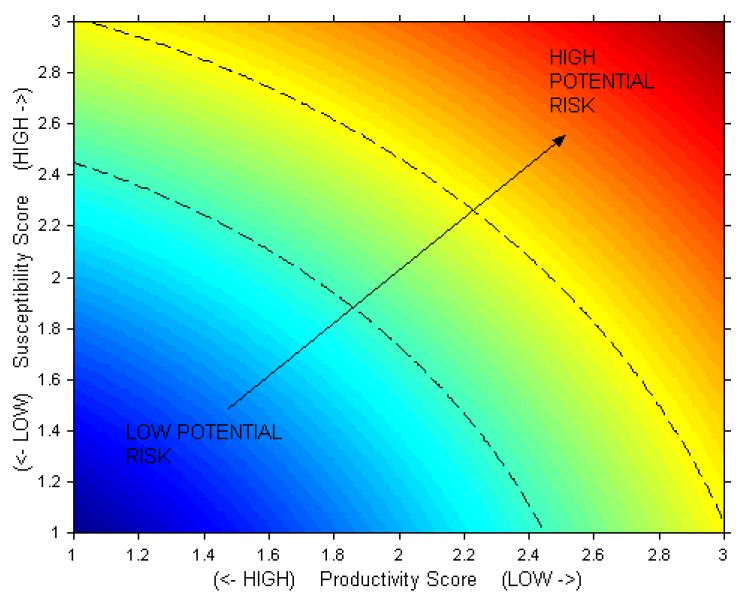
Figure 1. PSA plot demonstrating the two-dimensional space which species units are plotted. PSA
scores for species units represent the Euclidean distance or the distance between the origin and the
productivity (x axis), susceptibility (y axis) intercept (excerpt from Hobday. et al., 2007). ................... 10
ixDefinitions & Abbreviations
AFMA – Australian Fisheries Management Authority.
bSAFE – base Sustainability Assessment for the Fishing Effects. The
Sustainability Assessment for Fishing Effects or SAFE is one of the
two ERA methodologies that can be used as part of the Level 2
assessment. This method can be separated into a base SAFE
(bSAFE) and enhanced SAFE (eSAFE). The data requirements for
eSAFE are higher than for a bSAFE, which aligns more closely to a
PSA.
CAAB – Codes for Australian Aquatic Biota.
CMS – Convention on the Conservation of Migratory Species of Wild Animals.
CITES – Convention on International Trade in Endangered Species of Wild
Fauna and Flora.
CSIRO – Commonwealth Scientific and Industrial Research Organisation.
ECIF – East Coast Inshore Fishery. Previously referred to as the East Coast
Inshore Fin Fish Fishery or ECIFFF.
Ecological Component – Broader assessment categories that include Target & Byproduct
(harvested) species, Bycatch, Species of Conservation Concern,
Marine Habitats and Ecosystem Processes.
Ecological – Species, species groupings, marine habitats and categories included
Subcomponent within each Ecological Component.
EPBC Act – Environment Protection and Biodiversity Conservation Act 1999.
ERA – Ecological Risk Assessment.
ERAEF – Ecological Risk Assessment for the Effects of Fishing. A risk
assessment strategy established by (Hobday et al., 2011) and
employed by the AFMA.
FAD – Fish Aggregation Device.
False positive – The situation where a species at low risk is incorrectly assigned a
higher risk rating due to the method being used, data limitations etc.
In the context of an ERA, false positives are preferred over false
negatives.
False negative – The situation where a species at high risk is assigned a lower risk
rating. When compared, false-negative results are considered to be
of more concern as the impacts/consequences can be more
significant.
xFMP – Fishery Monitoring Program. This replaced Queensland Fisheries’
Long-Term Monitoring Program.
FOP – Fisheries Observer Program. Queensland Fisheries’ ceased this
program in 2009.
ITQ – Individual Transferable Quotas.
MEY – Maximum Economic Yield.
MSY – Maximum Sustainable Yield.
PSA – Productivity & Susceptibility Analysis. One of the two ERA
methodologies that can be used as part of the Level 2 assessments.
RLF – Reef Line Fishery. Previously referred to as the Coral Reef Fin Fish
Fishery or CRFFF. A line-only fishery which primarily operates within
the Great Barrier Reef Marine Park (L2 & L3 fishing symbols)
targeting a range of bottom-dwelling coral reef fin fish.
RRA – Residual Risk Analysis.
RRF – Rocky Reef Fishery. Previously referred to as the Rocky Reef Fin
Fish Fishery or RRFFF. A line-only fishery which operates within the
L1, L2 and L3 fishing symbol areas and targets a small number of
demersal and pelagic fin fish species.
SAFE – Sustainability Assessment for Fishing Effects. One of the two ERA
methodologies that can be used as part of the Level 2 assessments.
This method can be separated into a base SAFE (bSAFE) and
enhanced SAFE (eSAFE). The data requirements for eSAFE is
higher than for a bSAFE, which aligns more closely to a PSA.
SAFS – The National Status of Australian Fish Stocks. Refer to
www.fish.gov.au for more information.
Species of Conservation – Broader risk assessment category used in the Level 1 assessments
Concern (SOCC) that incorporates marine turtles, sea snakes, crocodiles, dugongs,
cetaceans, protected teleosts, batoids, sharks, seabirds, syngnathids
and terrestrial mammals. These species may or may not be subject
to mandatory reporting requirements.
Species of Conservation – A limited number of species subject to mandatory reporting
Interest (SOCI) requirements as part of the Queensland logbook reporting system.
Any reference to SOCI refers specifically to the SOCI logbook or
data compiled from the SOCI logbook.
TACC – Total Allowable Commercial Catch limit.
xi1 Introduction Ecological Risk Assessments (ERA) are important tools for sustainable natural resource management and they are being used increasingly in commercial fisheries to monitor long-term risk trends for target and non-target species. In Queensland, ERAs have previously been developed on an as-needs basis and these assessments have often employed alternate methodologies. This process has now been formalised as part of the Queensland Sustainable Fisheries Strategy 2017–2027 (the Strategy) and risk assessments are being completed for priority fisheries (Department of Agriculture and Fisheries, 2018d). Once completed, ERAs will inform a range of fisheries reforms being undertaken as part of the Strategy including the development of harvest strategies (Department of Agriculture and Fisheries, 2018d; 2020a) and the identification of priority areas for research and monitoring (Department of Agriculture and Fisheries, 2018e). The Rocky Reef Fishery (RRF) is a line-only fishery that targets a small number of demersal and pelagic fin fish. This includes recreationally important species like snapper (Chrysophrys auratus), pearl perch (Glaucosoma scapulare), grass emperor (Lethrinus laticaudis) and mahi mahi (Coryphaena hippurus). In July 2019, a whole-of-fishery or Level 1 ERA was released for the RRF (Jacobsen et al., 2019a).1 The Level 1 ERA provided a broad risk profile for the RRF, identifying key drivers of risk and the ecological components most likely to experience an undesirable event. As part of this process, the Level 1 ERA considered both the current fishing environment and what can occur under the current management regime. In doing so, the outputs of the Level 1 ERA helped differentiate between low and high-risk elements and established a framework that can be built on in subsequent ERAs. For the Level 2 ERA, the focus of the analysis shifts to a species-specific level and the scope of the assessment is refined to the current fishing environment. Applying more detailed assessment tools, Level 2 ERAs establish risk profiles for individual species using one of two methods: the semi- quantitative Productivity & Susceptibility Analysis (PSA) or the quantitative Sustainability Assessment for Fishing Effects (SAFE) (Department of Agriculture and Fisheries, 2018d; Hobday et al., 2007; Zhou & Griffiths, 2008). While both methods have been developed for use in data-limited fisheries, the use of the PSA or SAFE will be dependent on the species being assessed, the level of information on gear effectiveness, and the distribution of the species in relation to fishing effort (Hobday et al., 2011). The completion of the Level 2 assessment for the RRF provides further depth to this fishery’s ERA profile. With the focus shifting to individual species, the Level 2 ERA provides management with further avenues to explore the existence of both real and potential risks (Department of Agriculture and Fisheries, 2018d). Outputs from the Level 2 assessment will inform working group discussions and help identify fishery-specific risk management priorities. The Level 2 ERA builds on results contained in the whole-of-fishery (Level 1) assessment and strengthens linkages between the ERA process and the remaining areas of reform (Department of Agriculture and Fisheries, 2017b). 1Fishery formally identified as the Rock Reef Fin Fish Fishery (RRFFF). Additional information on the management and configuration of the RRF is provided in the scoping study (Department of Agriculture and Fisheries, 2019a). Rocky Reef Fishery Level 2 Ecological Risk Assessment 1
2 Methods
2.1 The Fishery
As the PSA and SAFE are primarily used to assess risk in commercial fisheries, a large proportion of
the Level 2 ERA will concentrate on commercial fishing activities conducted under the L1, L2 and L3
fishery symbols (Department of Agriculture and Fisheries, 2019a). In the RRF, the majority of the
catch is reported from waters south of Baffle Creek (24.5°S) by commercial operators fishing under
the L1 fishery symbol. However, fishers are permitted to harvest rocky reef species in the Great
Barrier Reef Marine Park (GBRMP) providing they have the appropriate L2 or L3 endorsement
(Department of Agriculture and Fisheries, 2018a; 2019a).

The management regime for the RRF consists of a mix of input and output controls. A number of
these controls have either been reviewed, amended or introduced as part of a broader fisheries reform
process (Department of Agriculture and Fisheries, 2017b). These include the introduction of a
seasonal (spawning) closure and Total Allowable Commercial Catch (TACC) limits for snapper
(Chrysophrys auratus) and pearl perch (Glaucosoma scapulare), boat limits (snapper), reduced
possession limits (pearl perch), and increased minimum legal size limits (pearl perch) (Department of
Agriculture and Fisheries, 2019h). These measures will continue to be built upon as part of the
Strategy with the eventual objective being to establish and implement a comprehensive RRF-specific
harvest strategy (Department of Agriculture and Fisheries, 2020a). As this harvest strategy is still in
development, the Level 2 ERA only considered management arrangements that were in effect at the
time of the assessment.

In addition to commercial fishing, the charter fishing sector will be a risk factor for a number of the
rocky reef species. Similar to the commercial sector, charter operators must adhere to licencing and
reporting requirements, but catch/effort is not restricted by quota. As with all fishing sectors, the
charter sector must abide by spatial and seasonal closures, minimum and maximum size limits, and
gear restrictions. In addition to the commercial fishery, the Level 2 ERA will take the charter sector into
consideration when assessing fishing impacts to assessed rocky reef species.

Outside of the commercial and charter fisheries, several rocky reef species including snapper and
pearl perch attract a significant level of attention from the recreational fishing sector. Recreational
fishers harvest an estimated 85t of snapper each year (Fowler et al., 2018) and this sector makes a
notable contribution to the annual rate of fishing mortality. As both commercial and recreational fishers
use similar apparatus, this sector will also interact with a similar range of species. Given these factors,
the Level 2 ERA also considered the impact of the recreational sector on a number of the species
assessed. As the recreational fishery does not have a designated area (excluding spatial closures),
the Level 2 ERA will consider recreational data obtained from the entire Queensland east coast
(Department of Agriculture and Fisheries, 2020b; Webley et al., 2015).

Additional information on the boundaries of the RRF, the broader management regime, and catch,
effort, and licence trends can be found in the Scoping Study and Level 1 ERA (available:
https://www.daf.qld.gov.au/business-priorities/fisheries/monitoring-compliance/data/sustainability-
reporting/ecological-risk-assessment).

Rocky Reef Fishery Level 2 Ecological Risk Assessment                                                     2
2.2 Information Sources / Baseline References
Where possible, baseline information on the life history constraints and habitat preferences for each
species was obtained from peer-reviewed articles. In the absence of peer-reviewed data, additional
information was sourced from grey literature and publicly accessible databases such as FishBase
(www.fishbase.org), Fishes of Australia (www.fishesofaustralia.net.au), Seamap Australia
(www.seamapaustralia.org) and the IUCN Red List of Threatened Species (www.iucnredlist.org).
Additional information including on the distribution of key species was obtained through the Atlas of
Living Australia (www.ala.org.au), Species Profile and Threats Database (Department of Environment
and Energy, www.environment.gov.au/cgi-bin/sprat/public/sprat.pl) and resources associated with the
management and regulation of marine national parks e.g. the Great Barrier Reef Marine Park,
Moreton Bay Marine Park and Great Sandy Marine Park. Where possible, regional species distribution
maps were sourced for direct comparison with effort distribution data (Whiteway, 2009).

Fisheries data used in the Level 2 ERA were obtained through the fisheries logbook program, a
previous Fisheries Observer Program (FOP), the Fishery Monitoring Program (FMP)2 and the
Statewide Recreational Fishing Survey (Department of Agriculture and Fisheries, 2020b; 2021;
Webley et al., 2015).

2.3 Species Rationalisation Processes
The scope of the Level 2 (species-specific) ERA was determined by the outcomes of the whole-of-
fishery (Level 1) assessment (Jacobsen et al., 2019a). For the RRF, the Level 1 ERA recommended
that the Target & Byproduct Species ecological component be progressed to a finer scale assessment
(Table 1). Fishing related risks for a further two ecological components were progressed through the
Queensland Monitoring & Research Plan (Table 1).

Table 1. Summary of the outputs from the Level 1 (whole-of-fishery) Ecological Risk Assessment for
the RRF. *Does not include Species of Conservation Concern or target & byproduct species returned
for to the water due to regulations like minimum legal size limits or product quality.

    Ecological Component         Level 1 Risk Rating                       Progression
    Target & Byproduct                  High                          Level 2 ERA (this report)
    Bycatch*                             Low                           Not progressed further.
    Species of Conservation Concern (SOCC)
       Marine turtles             Low/Intermediate                     Not progressed further.
       Dugongs                        Negligible                       Not progressed further.
       Cetaceans                         Low                           Not progressed further.
       Sea snakes                     Negligible                       Not progressed further.
       Crocodiles                     Negligible                       Not progressed further.
       Protected teleosts            Intermediate        Progressed through the Monitoring & Research Plan.
       Batoids                           Low                           Not progressed further.
       Sharks                     Low/Intermediate         Grey nurse shark progressed to a Level 2 ERA.
       Syngnathids                    Negligible                       Not progressed further.
       Seabirds                          Low                           Not progressed further.
       Terrestrial mammals            Negligible                       Not progressed further.
    Marine Habitats                  Intermediate        Progressed through the Monitoring & Research Plan.
    Ecosystem Processes           Low/Intermediate                     Not progressed further.

2   The Fishery Monitoring Program was previously known as the Long-Term Monitoring Program (LTMP).

Rocky Reef Fishery Level 2 Ecological Risk Assessment                                                         3
A preliminary list of target & byproduct species was compiled using catch data submitted through commercial logbooks from 2016–2018 (inclusive). Catch reported against each species or species complex was summed across years and ranked from highest to lowest. Cumulative catch comparisons were then used to identify the species and species complexes that made up 95% of the total catch. Codes for Australian Aquatic Biota (CAAB; http://www.cmar.csiro.au/caab/) were used to expand multi-species catch categories. A secondary review was then undertaken to remove duplicates, species with low or negligible catches, species that have limited potential to interact with the fishery and species where risk is being effectively managed through harvest strategies or output controls (e.g. TACC limits linked to detailed stock assessments and biomass reference points). While the Level 1 ERA assessed the shark ecological subcomponent as a low to intermediate risk (Table 1), the grey nurse shark (Carcharias taurus) was singled out as a higher risk species (Jacobsen et al., 2019a). Grey nurse sharks have experienced historical population declines and the species has a distribution that overlaps with the RRF (Bansemer & Bennett, 2011; Department of the Environment, 2019). Evidence also suggests that the species will interact with line fishers on the Australian east coast (Bansemer & Bennett, 2010; Robbins et al., 2013). As grey nurse sharks have conservative life history traits and small population sizes, risks to this species will be present at even low levels of fishing mortality. Grey nurse sharks are classified as Critically Endangered under the EPBC Act 1999 and their incidental capture in commercial and recreational fisheries has been identified as a long-term threat for this species (Department of the Environment, 2019). For these reasons, grey nurse sharks were included in the RRF Level 2 ERA as a precautionary measure. Where possible, the species rationalisation process was done in consultation with key stakeholders including Fisheries Working Groups3 established under the Queensland Sustainable Fisheries Strategy 2017–2027. A full account of the species rationalisation process has been provided in Appendix A and Appendix B. 2.4 Ecological Risk Assessment Methodology Methodology used to construct the Level 2 ERA aligns closely with the Ecological Risk Assessment for the Effects of Fishing (ERAEF) and includes two assessment options: the Productivity & Susceptibility Analysis (PSA) and the Sustainability Assessment for Fishing Effects (SAFE) (Australian Fisheries Management Authority, 2017; Hobday et al., 2011; Zhou & Griffiths, 2008). Data inputs for the two methods are similar and both were designed to assess fishing-related risks for data-poor species (Zhou et al., 2016). Similarly, both methods include precautionary elements that limit the potential for false negatives i.e. high-risk species being incorrectly assigned a lower risk rating. However, research has shown that the PSA tends to be more conservative and has a higher potential to produce false positives i.e. low-risk species that are assigned a higher risk rating due to the conservative nature of the method, data deficiencies etc. (Hobday et al., 2011; Hobday et al., 2007; Zhou et al., 2016). In the PSA, the level of risk (low, medium or high) is defined through a finer scale assessment of the life-history constraints of the species (Productivity), the potential for the species to interact with the fishery and the associated consequences (Susceptibility). In comparison, the SAFE method quantifies risk by comparing the rate of fishing mortality against key reference points including the level of fishing mortality associated with Maximum Sustainable Fishing Mortality (Fmsm), the point where biomass is assumed to be half that required to support a maximum sustainable fishing mortality (Flim) and fishing 3The scope of the Level 2 ERA was discussed with the Rocky Reef Working Group at the 12–13 August 2019 meeting. Rocky Reef Fishery Level 2 Ecological Risk Assessment 4
mortality rates that, in theory, will lead to population extinction in the long term (Fcrash) (Zhou &
Griffiths, 2008; Zhou et al., 2016; Zhou et al., 2011). As SAFE is a quantitative assessment, the
method provides an absolute measure of risk or a continuum of values that can be compared directly
to the above reference points (Hobday et al., 2011). This contrasts with the PSA which provides an
indicative measure (low, medium, high) of the potential risk (Hobday et al., 2007).

While research has shown that SAFE produces fewer false positives, it requires a sound
understanding of both the fishing intensity and the degree of overlap between a species’ distribution
and fishing effort (Hobday et al., 2011; Zhou et al., 2009). These parameters are used to determine
the gear-affected area and the estimate of risk is sensitive to this quantity (Hobday et al., 2011). The
gear-affected area being the proportion of the fished area that a species resides in that is impacted on
by the apparatus (Zhou et al., 2019; Zhou et al., 2014). This can be difficult to calculate for species
with poorly defined geographical distributions or with insufficient datasets. In the context of this ERA,
this will be a factor for a number of the species included in this analysis.

In a line fishery, determining the gear-affected area can be difficult as it will depend on a range of
factors including the number of lines/hooks, the way in which the hooks are used (i.e. number of hooks
per line), the fishing method employed (trolling versus demersal), the distance between lines, the
frequency with which the lines are retrieved, variations in fishing power and the use (if applicable) of
ancillary equipment. In the RRF, commercial fishers are required to submit information on the number
of tenders, crew numbers, line numbers, and fishing method (handline/reel or trolling). While operators
are also required to identify a fishing location, this information only reflects the position of the greatest
daily catch. As a consequence, locational data collected on line-fishing activities may not reflect the
spatial extent of the fishery or the total area fished by the primary boat and any associated tenders.

From an ERA perspective, the above deficiencies are important as they introduce a degree of
uncertainty surrounding the fine-scale distribution of fishing effort and the level of fishing intensity. This
by extension has a bearing on the accuracy of estimates of the gear-affected area. Of significance,
these deficiencies are being actively addressed as part of the Strategy and the mandated use of
Vessel Tracking (Department of Agriculture and Fisheries, 2018f). However, other factors including the
distance over which a species may be attracted to the bait may also impact the gear-affected area
(Zhou et al., 2019). This in itself may be difficult to determine without a clear estimate of the hook soak
time and line retrieval frequency (pers. comm. Z. Zhou).

In addition to the gear-affected area, rocky reef species are targeted by recreational fishers and this
sector will contribute to the overall level of risk. The SAFE method was principally developed for use in
commercial fisheries and the method has yet to evolve to a point where it can accurately account for
recreational fishing pressures. In Queensland, the majority of information from this sector is obtained
through the voluntary localised collection of data (the boat ramp survey program, keen angler program
and other initiative undertaken through the Fishery Monitoring Program) and a more expansive
voluntary recreational fisher survey (Department of Agriculture and Fisheries, 2020b; Webley et al.,
2015). However, the level of data required to inform the SAFE method goes beyond what is collected
by these programs, and inclusion of the recreational sector in the analysis will be difficult.

Given the importance of the gear-affected area and the methodology limitations with respect to
assessing recreational fishing mortality, the PSA was adopted for the RRF Level 2 ERA. While the use
of a PSA increases the potential for false positives, previous ERAs have successfully modified this
method to account for recreational fishing (Furlong-Estrada et al., 2017; Patrick et al., 2010). To this

Rocky Reef Fishery Level 2 Ecological Risk Assessment                                                           5
extent, it was considered to be the best method to assess the collective risk in this fishery. It is
recommended that subsequent ERAs review the suitability and applicability of the SAFE method with
the continued role out of initiatives being undertaken as part of the Strategy (Department of Agriculture
and Fisheries, 2017b).

2.4.1 Productivity & Susceptibility Analysis (PSA)
The PSA was largely aligned with the ERAEF approach employed for Commonwealth fisheries
(Australian Fisheries Management Authority, 2017; Hobday et al., 2011). As a detailed overview of the
methodology and the key assumptions are provided in Hobday et al. (2007), only an abridged version
will be provided here.

The Productivity component of the PSA examines the life-history constraints of a species and the
potential for an attribute to contribute to the overall level of risk. These attributes are based on the
biology of the species and include the size and age at maturity, maximum size and age, fecundity,
reproductive strategy and trophic level (Table 2). Productivity attributes used in the Level 2
assessment were consistent with the ERAEF (Hobday et al., 2011) and were applied across all
ecological components subject to a PSA. Criteria used to assign each attribute a score of low (1),
medium (2) or high (3) risk are outlined in Table 2.

Table 2. Scoring criteria and cut-off scores for the productivity component of the PSA undertaken as part of the
Level 2 ERA. Attributes and the corresponding scores/criteria align with national (ERAEF) approach (Hobday et
al., 2011).

                                       High productivity             Medium productivity               Low productivity
    Attribute
                                     (low risk, score = 1)         (medium risk, score = 2)          (high risk, score = 3)

    Age at maturity*                        15 years

    Maximum age*                           25 years

                                                                     100–20,000 eggs per
    Fecundity**                     >20,000 eggs per year                                             20,000
eggs per year (Miller & Kendall, 2009).

For the Susceptibility component of the PSA, ERAEF attributes were used as the baseline of the
assessment and included availability, encounterability, selectivity and post-capture mortality (Hobday
et al., 2011; Hobday et al., 2007). The following provides an overview of the susceptibility attributes
used in the PSA with Table 3 detailing the criteria used to assign scores for this part of the analysis.

•      Availability—Where possible, availability scores were based on the overlap between fishing effort
       and the portion of the species range that occurs within the broader geographical spread of the
       fishery. To account for inter-annual variability, percentage overlaps were calculated for three years
       (2016, 2017 and 2018) and the highest value used as the basis of the availability assessment.
       Regional distribution maps were sourced from the Atlas of Living Australia, the Species Profile and

Rocky Reef Fishery Level 2 Ecological Risk Assessment                                                                          6
Threats Database (Department of Environment and Energy, www.environment.gov.au/cgi-
bin/sprat/public/sprat.pl), the CSIRO and, where possible, refined using bathymetry and
topographical data (Whiteway, 2009).
In instances where a species did not have a distribution map, availability scores were based on a
broader geographic distribution assessment (global, southern hemisphere, Australian endemic)
described in Hobday et al. (2007) (Table 3). A full summary of the overlap percentages used to
assess availability has been provided in Appendix C.
• Encounterability—Encounterability considers the likelihood that a species will encounter the
fishing gear when it is deployed within the known geographical range (Hobday et al., 2007). The
encounterability assessment is based on the behaviour of the species as an adult and takes into
consideration information on the preferred habitats and bathymetric ranges. For the PSA, both
parameters (i.e. adult habitat overlap and bathymetric range overlap) are assigned an individual
risk score with the highest value used as the basis of the encounterability assessment.
• Selectivity—Selectivity is effectively a measure of the likelihood that a species will get caught in
the apparatus. Factors that will influence selectivity include the fishing method, the apparatus used
and the body size/morphology of the species in relation to the gear size (e.g. mesh size, trap
opening). For the purpose of the RRF, selectivity scores were based on the likelihood that the
animal will actively interact with the line (e.g. attraction to the bait) and become hooked.
• Post-capture mortality—Post-capture mortality is one of the more difficult attributes to assess;
particularly for non-target species. For the majority of target & byproduct species that fall within the
prescribed regulations, survival rates are considered to be zero as they will (most likely) be
retained for sale. Survival rates for the remainder of the species will vary, may be subject to data
limitations and may require further qualitative input or expert opinion.
In addition to the four baseline attributes, the Level 2 ERA included three additional susceptibility
attributes for target & byproduct species: management strategy, sustainability assessments and
recreational desirability / other fisheries. These attributes were included in the assessment to address
risks associated with other fishing sectors (e.g. recreational and charter fisheries) and management
limitations for key species (e.g. an absence of effective controls on catch or effort). While the
additional attributes are not included in the ERAEF, variations of all three have been used in risk
assessments involving species experiencing similar fishing pressures (Furlong-Estrada et al., 2017;
Patrick et al., 2010).
In the Level 2 ERA, they will be used to further reduce the influence of false positives or risk
overestimations for key species. As grey nurse sharks are protected in Queensland waters, the three
additional attributes were not applied to this species. Summaries for the three additional attributes are
as follows:
• Management strategy—Considers the suitability of the current management arrangements
including the ability to manage risk through time e.g. the presence of an effective control on total
catch or effort (if appropriate), regional management, biomass estimates that are directly linked to
species-specific TACCs etc. This attribute was considered to be of particular relevance to multi-
species fisheries where the management regime often lacks species-specific control measures
and for species where the risk has been reduced through the use of quotas based on biological
reference points like Maximum Sustainable Yield (MSY) and Maximum Economic Yield (MEY).
Rocky Reef Fishery Level 2 Ecological Risk Assessment 7Table 3. Scoring criteria and cut-off scores for the susceptibility component of the PSA. Attributes and the corresponding scores/criteria are largely aligned
with ERAEF approach (Hobday et al., 2011).
Low susceptibility Medium susceptibility High susceptibility
Attribute
(low risk, score = 1) (medium risk, score = 2) (high risk, score = 3)
Availability
Option 1. Overlap of species
30% overlap.
range with fishing effort.
Option 2. Global distribution
Restricted to same hemisphere / ocean
& stock proxy Globally distributed. Restricted to same country as fishery.
basin as fishery.
considerations.
Encounterability
Option 1. Habitat type Low overlap with fishery area. Medium overlap with fishery area. High overlap with fishery area.
Option 2. Depth check Low overlap with fishery area. Medium overlap with fishery area. High overlap with fishery area.
Selectivity Low susceptibility to gear selectivity. Moderate susceptibility to gear selectivity. High susceptibility to gear selectivity.
Retained species, majority dead when
Evidence of post-capture release and
Post-capture mortality Released alive with uncertain survivability. released, interaction likely to result in
survival.
death or life-threatening injuries.
Catch or effort restricted in some capacity
Species-specific management of catch or (e.g. species-specific TACC limits or
Harvested species do not have species-
effort (e.g. TACC limits) based on biomass analogous arrangements), restrictions based
specific catch limits or robust input &
Management strategy estimates / reference points. Management on arbitrary or outdated biomass estimates /
output controls. Management regime
regime able to actively address emerging reference points. Limited capacity to
based at the whole-of-fishery level.
issues within the current framework. address emerging catch and effort trends
without legislative amendments or reforms.
Sustainability confirmed through indicative Not assessed, biomass depleted, declining
Sustainability confirmed through stock
Sustainability assessments sustainability assessments & weight of or not conducive to meeting QLD
assessments / biomass estimates.
evidence approach e.g. national SAFS. Sustainable Fisheries targets.
Recreational desirability /
66% retention.
other fisheries
Rocky Reef Fishery Level 2 Ecological Risk Assessment 8• Sustainability assessments—The sustainability assessment attribute is directly linked to the
level of information that is available on the stock structure and status of harvested species.
Species where sustainability has been confirmed through stock assessments or the national
Status of Australian Fish Stocks (SAFS) will be assigned a lower risk scores. Conversely, species
that are being fished above key biomass reference points (e.g. MSY), have been assigned a
negative SAFS assessment and/or have no assessment will be assigned more precautionary risk
scores.
• Recreational desirability / other fisheries—Specifically included in the PSA to account for the
risk posed by other sectors of the fishery (e.g. recreational and charter fisheries) or other
commercial fisheries that can retain the species for sale. In the PSA, preliminary risk ratings are
based on retention rate estimates obtained through recreational fishing surveys (Webley et al.,
2015). Under the criteria used (Table 3), species with higher retention rates will be assigned more
conservative risk scores.
For the purpose of this ERA, recreational retention rates were used as an indicative assessment
of a species popularity across sectors (i.e. recreational and charter fisheries). It is however
acknowledged that the charter fishery is monitored and managed as a separate entity. When and
where appropriate the impacts of this sector will be given further consideration as part of the
Residual Risk Assessment (RRA).
2.4.2 PSA Scoring
Each attribute was assigned a score of 1 (low risk), 2 (medium risk) or 3 (high risk) based on the
criteria outlined in Table 2 and Table 3 (Brown et al., 2013; Hobday et al., 2011; Patrick et al., 2010).
In instances where an attribute has no available data and in the absence of credible information to the
contrary, a default rating of high risk (3) was used (Hobday et al., 2011). This approach introduces a
precautionary element into the PSA and helps minimise the potential occurrence of false-negative
assessments. The inherent trade-off with this approach is that the outputs of the Level 2 ERA can be
conservative and may include a number of false positives (Zhou et al., 2016). Issues associated with
false positives and the overestimation of risk will be examined further as part of the RRA.
Risk ratings (R) were based on a two-dimensional graphical representation of the productivity (x-axis)
and susceptibility (y-axis) scores (Fig. 1). Cross-referencing of the productivity and susceptibility
scores provides each species with a graphical location that can be used to calculate the Euclidean
distance or the distance between the species reference point and the origin (i.e. 0, 0 on Fig. 1). This
distance is calculated using the formula R = ((P – X0)2 + (S – Y0)2)1/2 where P represents the
productivity score, S represents the susceptibility score and X0 and Y0 are the respective x and y
origin coordinates (Brown et al., 2013). The theory being that the further a species is away from the
origin the more at risk it is considered to be. For the purpose of this ERA, cut offs for each risk
category were aligned with previous assessments with scores below 2.64 classified as low risk,
scores between 2.64 and 3.18 as medium risk, and scores >3.18 classified as high risk (Brown et al.,
2013; Hobday et al., 2007; Zhou et al., 2016).
As the PSA includes an uncertainty assessment and RRA (refer to section 2.4.3 Uncertainty and 2.4.4
Residual Risk), the initial risk ratings may be subject to change. To this extent, scores assigned as
part of the PSA analysis can be viewed as a measure of the potential for risk each species may
experience (Hobday et al., 2007) with the final risk scores determined on completion of the RRA.
Rocky Reef Fishery Level 2 Ecological Risk Assessment 9Figure 1. PSA plot demonstrating the two-dimensional space which species units are plotted. PSA scores for species units represent the Euclidean distance or the distance between the origin and the productivity (x axis), susceptibility (y axis) intercept (excerpt from Hobday. et al., 2007). 2.4.3 Uncertainty A number of factors including imprecise or missing data and the use of averages or proxies can contribute to the level of uncertainty surrounding the PSA. Examples of which include the use of a default high score for attributes missing data and the use of values based at a higher taxon i.e. genera or family level (Hobday et al., 2011). In the Level 2 ERA uncertainty is examined through a baseline assessment of each risk profile to determine the proportion of attributes assigned a precautionary high-risk rating due to data deficiencies. As species with greater data deficiencies are more likely to attract the default high-risk rating, their profiles are more likely to fall on the conservative side of the spectrum. In these instances, it may be more appropriate to address these risks and data deficiencies through measures like the Monitoring and Research Plan (Department of Agriculture and Fisheries, 2018e). 2.4.4 Residual Risk Precautionary elements in the PSA combined with an undervaluation of some management arrangements can result in more conservative risk assessments and a higher number of false positives. Similarly, the effectiveness of some attributes may be exaggerated, and subsequent risks could be underestimated (false negatives). To address these issues, PSA results were subject to a residual risk analysis (RRA). The RRA gives further consideration to risk mitigation measures that were not explicitly included in the attributes and any additional information that may influence the risk status of a species (Australian Fisheries Management Authority, 2017). In doing so, the RRA provides Rocky Reef Fishery Level 2 Ecological Risk Assessment 10
management with greater capacity to differentiate between potential and actual risks (Department of
Agriculture and Fisheries, 2018d) and helps refine risk management strategies.

The RRA framework was based on guidelines established by CSIRO and the Australian Fisheries
Management Authority (AFMA) (Australian Fisheries Management Authority, 2018). These guidelines
identify six avenues where additional information may be given further consideration as part of a Level
2 assessment. Given regional nuances and data variability, a degree of flexibility was required with
respect to how the RRA guidelines were applied to commercial fisheries in Queensland and the
justifications used. The RRA was also expanded to include a seventh guideline titled Additional
Scientific Assessment & Consultation. While a version of this guideline has been used in previous risk
assessments involving Commonwealth Fisheries, it has since been removed as part of a broader
RRA procedural review (Australian Fisheries Management Authority, 2018). In Queensland, this
guideline was retained as the broader ERA framework includes a series of consultation steps that aid
in the development and finalisation of both the whole-of-fishery (Level 1) and species-specific ERAs
(Department of Agriculture and Fisheries, 2018d).

In instances where the RRA resulted in an amendment to the preliminary score, full justifications were
provided (Appendix D) including the guidelines in which the amendments were considered. A brief
summary of each guideline and the RRA considerations is provided in Table 4.

Table 4. Guidelines used to assess residual risk including a brief overview of factors taken into
consideration. Summary represents a modified excerpt from the revised Australian Fisheries
Management Authority (AFMA) Ecological Risk Assessment, Residual Risk Assessment Guidelines
(Australian Fisheries Management Authority, 2018).

 Guidelines                            Summary

 Guideline 1: Risk rating due to       Considers if susceptibility and/or productivity attribute data for a
 missing, incorrect or out of date     species is missing or incorrect for the fishery assessment, and is
 information.                          corrected using data from a trusted source or another fishery.

 Guideline 2: Additional scientific    Considers any additional scientific assessments on the biology or
 assessment & consultation.            distribution of the species and the impact of the fishery. This may
                                       include verifiable accounts and data raised through key consultative
                                       processes including but not limited to targeted consultation with key
                                       experts and oversite committees established as part of the
                                       Queensland Sustainable Fisheries Strategy 2017–2027 e.g. Fisheries
                                       Working Groups and the Sustainable Fisheries Expert Panel.

 Guideline 3: At risk with spatial     Provides further consideration to the spatial distribution data, habitat
 assumptions.                          data and any assumptions underpinning the assessment.

 Guideline 4: At risk in regards to    Considers observer or expert information to better calculate
 level of interaction/capture with a   susceptibility for those species known to have a low likelihood or no
 zero or negligible level of           record of interaction nor capture with the fishery.
 susceptibility.

 Guideline 5: Effort and catch         Considers current management arrangements based on effort and
 management arrangements for           catch limits set using a scientific assessment for key species.
 target & byproduct species.

Rocky Reef Fishery Level 2 Ecological Risk Assessment                                                             11
You can also read