Biochar in green roofs to increase water uptake and retention
←
→
Page content transcription
If your browser does not render page correctly, please read the page content below
University of South-Eastern Norway
                                     Faculty of Technology, Natural Sciences and Maritime Sciences
                                                                                                 –
                                                                                   Master’s Thesis
                                                 Study programme: Master of Environmental Science
                                                                                      Spring 2021

Author: Henning Lykseth
Biochar in green roofs to increase water uptake and
retention
A way to manage stormwater runoff in urban areas
University of South-Eastern Norway
Faculty of Technology, Natural Sciences and Maritime Sciences
Institute of Natural Sciences and Environmental Health
PO Box 235
NO-3603 Kongsberg, Norway

http://www.usn.no

© 2021 Henning Lykseth

This thesis is worth 60 study points

 ___
  2
Abstract

Global warming has increased the precipitation in Northern Europe. For cities, this has
led to increased stormwater runoff and flooding, due to undersized sewage systems and
lack of natural water sinks. Green roofs have shown to reduce storm water runoff and
thus reduce overall flood intensity in cities. To increase this potential, adding soil
amendments of high water-holding capacity relative to own weight has proven to be
beneficial. Biochar produced by pyrolysis have shown promising results for this
purpose, but there is a lack of data comparing different char types to conventional
products.

We tested two types of biochar: active char from Standard Bio and biochar from Carbon
Cycle GmbH, in addition to crushed Leca as reference. These products were tested as
pure products and as soil amendment (30%), for their relative saturated bulk density,
relative field capacity, porosity, drainage delay and permanent wilting point. Empty
samples (Control1) and non-treated growth media samples (Control2) were used as
control groups.

Both types of biochar yielded significantly higher water-holding capacity than the Leca
as pure products. Additionally, they both also increased water-holding capacity of the
growth media, but only the active char from Standard Bio was significantly different to
that of the crushed Leca. The active char was also the only product which yielded
significant effect on porosity in growth media relative to Control2 and crushed Leca.
Treated growth media did not increase delay of drainage or days before wilting relative
to non-treated growth media.

Results in this study showed that biochar significantly increased water-holding capacity
of growth media compared to non-treated growth media. Although further testing is
required, our findings indicates that both types of biochar (active char and biochar)
could be useful in green roofs to improve water uptake and thus decrease stormwater
runoff.

                                                                                         ___
                                                                                          3
Contents
Abstract ................................................................................................................... 3
Preface .................................................................................................................... 5
1           Introduction .................................................................................................. 7
2           Material and Methods ................................................................................ 13
        2.1       Product details .............................................................................................. 13
        2.2       Experiment 1 and 2 – Physical parameters .................................................. 14
        2.3       Experiment 3 – Drainage delay and plant survivability............................... 18
        2.4       Experiment 4 - Testing prototype of mid-sized green roof.......................... 20
        2.5       Statistical analyses ....................................................................................... 21
3           Results ........................................................................................................ 22
        3.1       Main findings ............................................................................................... 22
        3.1.1 Relative saturated bulk density .................................................................... 22
        3.1.2 Relative field capacity.................................................................................. 24
        3.1.3 Porosity ........................................................................................................ 26
        3.2       Drainage speed and soil water retention capacity ........................................ 28
        3.3       Drainage delay ............................................................................................. 30
        3.4       Wilting point ................................................................................................ 30
4           Discussion ................................................................................................... 31
5           Conclusion .................................................................................................. 34
References ............................................................................................................. 35
Annexes ................................................................................................................. 41

 ___
    4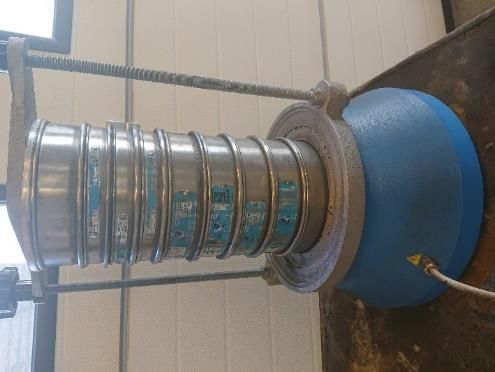
Preface
This thesis marks the final evaluation for my five-year master’s degree in Natural
Science and Environmental Health, at the University of South-Eastern Norway (USN).
The experience has been highly educational and meaningful, providing me with lots of
new insights on the topic. I conducted this thesis in the period from August 2020 to
May 2021 in collaboration with Standard Bio AS.

I would like to send a big thank you to Standard Bio and the people working there for
providing me the opportunity and resources needed to conduct this research. I would
also like to thank my great supervisors Mona Sæbø, Lærke S. Stewart and Johanna
Anjar for their excellent assistance and guidance during my research. Finally, I must
thank Anja D. Jonassen and Sondre C. Wiersdalen for assisting with proofreading, in
addition to friends and family who have provided motivation and support throughout
the whole process. Thank you.

Midt-Telemark, May 16th, 2021
Henning Lykseth

                                                                                       ___
                                                                                        5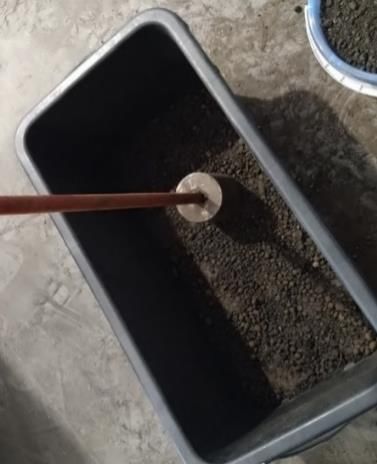
___
 6
1 Introduction
Floods are increasing in both frequency and intensity and have been reported to be the
world’s most frequent type of natural disaster (WHO, 2020). More than 2 billion people
worldwide were affected by floods between 1998-2017 (House & Wallemacq, 2018).
The increase in flood events has been linked to climate change, which affects the global
circulation system and forces the polar front’s low pressures towards the poles. This
influences the weather patterns, increasing annual precipitation in Northern Europe
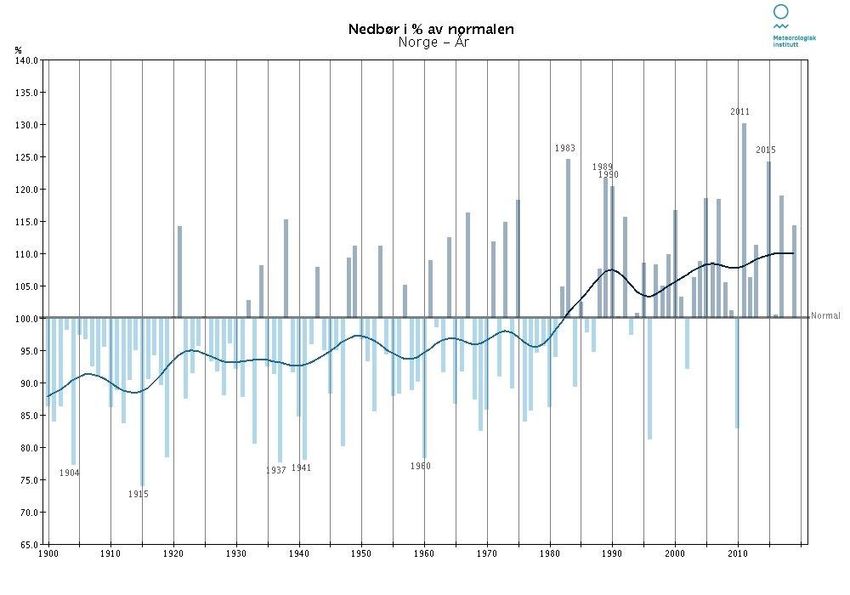
(Myhre, 2015). Scandinavia has seen increased annual precipitation (fig. 1) with more
than 17 mm (up to 70 mm in western Norway) per decade from 1960-2015, (EEA,
2017).
Figure 1: Change in precipitation in Norway, from 1900-2020. (Meteorologisk institutt, 2021).
Urbanized areas are especially vulnerable to heavy rainfall due to the urban hydrology
(NVE, 2020). Concrete and asphalt, which is heavily present in most of today’s cities,
do not allow for much ground infiltration and most of the water is therefore led to
underground sewage pipes. Since the sewage pipes are not capable of managing all the
stormwater, it often gets overloaded. This leads to stormwater runoff, causing flooding
of streets, structures, and parking lots. Heavy deforestation due to agricultural and urban
area development are severely limiting the natural stormwater uptake, which further
increases stormwater runoff (Ligtenberg, 2017). This is a huge threat to cities, not only
due to the enormous environmental and structural damages and costs, but also because
it hinders traffic. This can further lead to hold-back for the emergency services
___
7(Braskerud, 2016; Fleig, 2018) and thus result in life threatening consequences.
Urbanization is not a new phenomenon, but the rate of which people move into cities is
accelerating. According to FN-Sambandet (2019) more than half of the world’s
population are now living in cities, and in 30 years this number is expected to increase
with at least 3 billion more (FN-Sambandet, 2019). To avoid dire consequences,
managing the stormwater runoff in cities is crucial, and calls for more sophisticated
solutions (Hettiarachchi et al., 2018).
One solution to the increase of urban flooding, could be to bring more of nature back
into the urban areas. This can be achieved in many ways, for instance by covering
structures with plant communities, also called green roofing (Standard Norge, 2015).
Studies have shown promising results related to green roofs ability to manage
stormwater runoff (Berghage et al., 2009; Rai et al., 2017; Speak et al., 2013). Zhang et
al. (2015) found that 35.5 % to 100 % of stormwater runoff were retained by green
roofs in Chongqing, China (Zhang et al., 2015). Additionally, another study on an aged
green roof in Manchester showed average water retention of 67.5%, compared to 33.6%
for the bare roof (Speak et al., 2013).
A report conducted by Noreng et al. (2012) states that there are two main groups
of green roofs: extensive and intensive. The extensive roofs usually consist of sedum,
herb, and grass species, growing on shallow growth media depths, thus making the
roofs relatively light (usually from 40 to 130 kg/m2). The chosen species should
therefore be capable of withstanding longer drought periods and low nutrient
availability, thereby making the extensive roofs cheaper and easier to maintain than
intensive green roofs (Noreng et al., 2012). Because extensive roofs lack regular
watering, they are more exposed to drought and fires. The maximum amount of organic
matter allowed in extensive roofs in Norway is therefore set to 20% of total substrate
volume (Standard Norge, 2015).
The intensive green roofs can, according to Noreng et al. (2012), support a wide
variety of plant species. Therefore, they also need intensive maintenance. They are
usually constructed on near flat to flat roofs and can be used for roof top parks or urban
agricultural purposes. The growth media depth in intensive green roofs are usually
between 0.2 – 1.0 m, depending on vegetation being used (Standard Norge, 2015). The
relatively thick growth media and variable vegetation on intensive roofs results in a
higher saturated bulk density of 200-1000 kg/m2. There are therefore strict guidelines on
___
8the design of supporting structures for intensive green roofs, which means that intensive
roofs can often not be established on already built structures if this is not included in the
design. Due to intensive and regular watering, they are estimated to be relatively fire
resistant and have no set limitations on the amounts of organic matter that can be used
(Noreng et al., 2012). The Norwegian standard writing body – Standards Norway–
communicated that there is no work on any standards regarding intensive green roofs as
of this date (H. G. Wells, personal communication, 5 October 2020). The GRO Green
Roof Code – a British national green roof standard - refers to the German DIN
Standards, stating that intensive green roofs have about the same fire risk as
conventional hard roofs (GRO, 2011). To the best of the author’s knowledge, there are
no relevant studies or reports stating otherwise than that of the study by Noreng et al.
(2012).
When a growth medium has been fully saturated with water, it is defined as saturated
bulk density (Brouwer et al., 1985). A high saturated bulk density would generally
mean that the growth medium can absorb a lot of water, but it would also mean that it
could become very heavy. Putting heavy structures on roof tops are challenging, for
obvious reasons, thus having a high saturated bulk density is not ideal. However, having
a growth medium with high saturated bulk density relative to its dry weight (dry bulk
density) is important to avoid runoff. Relative saturated bulk density is determined by
dividing saturated weight by dry weight and describes how much water the growth
medium can absorb relative to its own weight.
The amount of water which can be hold (or retained) against gravity in a growth
medium is referred to as water-holding capacity. When maximum water-holding
capacity in a field’s (or pot’s) medium has been reached, it is defined as field/pot
capacity (Curell, 2011). This means that all unbound water in the field or pot has either
drained or evaporated, and all the water left is retained by the medium, against the
gravitational forces (Aarnes, 2018). A higher water-holding capacity in green roofs’
growth media would generally mean a higher potential to hold onto stormwater, thereby
relieving the sewage system and reducing urban stormwater runoff (NVE, 2020).
Several environmental factors and conditions determine the degree of a growth
medium’s water-holding capacity. Some of these are local climates and seasons
(Mentens et al., 2006), and intensity and duration of rainfall events (Villarreal &
Bengtsson, 2005). Structural and physical properties, such as roof slope, vegetation use,
___
9depth and composition of growth media also affects water-holding capacity (Berndtsson, 2010; Mentens et al., 2006; VanWoert et al., 2005). A study also found that although varying plant species gave some increased stormwater retention, it was not close to the effect of the growth media (VanWoert et al., 2005). The survivability and performance of vegetation on green roofs are also highly dependent on the growth media’s properties. Roofs are highly exposed to sunlight and heat radiation, while at the same time the availability of water and nutrients are limited (Rowe et al., 2006). Permanent wilting point is defined as the point (in days or water amount) where plants cannot absorb any more water from the soil, and irreversible wilting occurs (Rai et al., 2017). This is dependent on the medium’s water-holding capacity and provides an indication of how frequent and intense the green roof should be irrigated (Abel et al., 2013). While available water in the growth media is important for plants, high porosity is also crucial to provide adequate amounts of oxygen for the root system (Rowe et al., 2006; Thuring et al., 2010). Porosity represents the pore and void volume of the substrate/growth medium and is usually expressed as a percentage of total sample/pot volume (Fitts, 2013). To further improve the physical properties in green roofs’ growth media, soil amendments have shown to be useful (Huang et al., 2020). Soil amendments, or soil additives, are often light-weight materials which can be added to growth media to improve their water-holding capacity, porosity, and plant survivability (Davis & Whiting, 2013). The most common soil amendments used in green roofs’ growth media today are magmatic rocks, crushed bricks and crushed Leca (Standard Norge, 2015). Leca is made by heating clay in an oven, causing it to expand and harden (Leca, 2021). It has a relatively light weight, and an ability to retain water within its pores, due to capillary action (Eriksson, 2012; Thodesen, 2011). A study done by Busklein, Thodesen & Balmand (2014) compared crushed (2-4 mm and 4-10 mm) and round (10-20 mm) Leca, with respect to water runoff management. They found that the 2-4 and 4-10 mm crushed Leca had significantly higher runoff reduction, than the round 10-20 mm Leca. However, the substrate depth was a key factor, where the reduction in runoff increased from 4 % at 100 mm depth, to 20 % at 200 mm depth for the 4-10 mm crushed Leca ___ 10
(Busklein et al., 2014). Biochar have also shown promising results as soil amendment in
green roofs to make them lighter, while at the same time increasing water-holding
capacity and plant survivability (Bikbulatova et al., 2018; Cao et al., 2014; Rawat et al.,
2019). Some biochar types have shown to be hydrophobic when water first was added,
but after a while they have allegedly absorbed up to six times their own weight with
water (Meissner, 2018).

The International Biochar Initiative (IBI) has defined biochar as “a solid material
obtained from the thermochemical conversion of biomass in an oxygen-limited
environment” (IBI, 2015). The thermic process referred to by IBI is called pyrolysis
(Basu, 2013), and creates a stable form of carbon, enabling biochar to potentially last
for hundreds of years in the soil without breaking down (Rawat et al., 2019). The
European Biochar Certificate (EBC) has a more strict definition for biochar which
includes the degree of sustainable production, type of biomass used as feedstock, the
biochar’s overall quality and end usage (EBC, 2012). In addition, EBC and IBI have
made a minimum criterion for categorizing biochar, in terms of specific surface area per
unit mass (SSA), which must be at least 150 m2/g (EBC & IBI, 2014).

There are many different methods for determining SSA in biochar, by which gas
adsorption techniques are most common. This often result in varying scores, which
makes it difficult to characterize and compare different biochars with respect to surface
area (Leng et al., 2021). However, Rawat et al. (2019) found that the biochar’s SSA was
strongly linked to its porosity, and that the porosity can be greatly affected by the raw
materials used and the pyrolyzing conditions it undergoes (Rawat et al., 2019).

Porosity of biochar is categorized into three groups based on pore size: micropores (50 nm), by which the micro and meso
pores are often the major contributor to the total pore volume (Leng et al. (2021).
Bikbulatova et al. (2018) found that higher porosity was also correlated with higher
water-holding capacity, and that most of the water was held in the micropores. They
therefore suggested that due to the confined space in the micropores (
carbon-rich woody biomass, with high production temperatures (400-700°C) and long
hold time (30-120 min) had the highest porosity and water-holding capacity (Gray et al.,
2014). However, the most optimal particle size for water uptake in biochar seem to
differ. In a study by Wang et al. (2019), they tested two types of biochar: softwood
(with low surface area, pyrolyzed at 600-700°C) and walnut shell (with high surface
area, pyrolyzed at 900°C). Both char types were divided into particle diameter groups of
0-0.25, 0.25-0.5, 0.5-1 and 1-2 mm, but only the walnut shells yielded any effect in
growth media, and the greatest effect was found from the particles of 1 mm diameter
and up (Wang et al., 2019). Based on the studies presented, there is lots of variations
within the pool of biochar, with respect to porosity and water-holding capacity. And
data concerning different types of chars compared with other conventional products,
seems to be lacking.

The aim of this study is to test and compare the potential of two types of biochars with
different physical characteristics, on relative saturated bulk density, relative field
capacity, drainage delay and permanent wilting point. To increase the accuracy and
relevance of this study, the char types will be compared with crushed Leca and two
controls: empty samples (Control1) and samples of non-treated growth media
(Control2). The three products (two biochar types and crushed Leca) will be compared
by performance as pure products, and as soil amendment in growth media.

 ___
 12
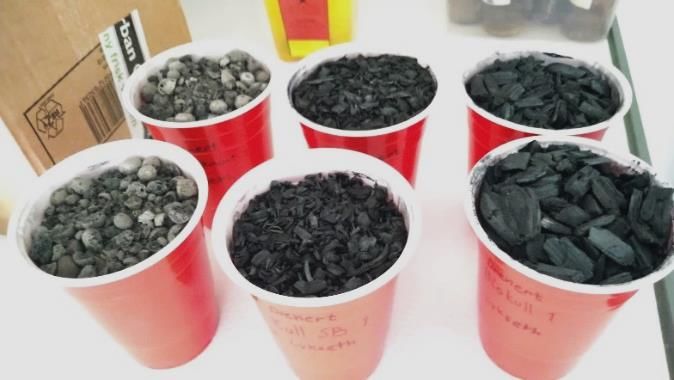
2 Material and Methods
2.1 Product details
Two types of pyrolyzed biochar, provided by Standard Bio, were used in the
experiments (Fig. 2A). One of the biochars was produced by a partnership company of
Standard Bio, named Carbon Cycle GmbH. This was made of dried spruce (Picea) and
animal waste, and pyrolyzed at temperatures from 600-700°C (no further production
parameters was provided). The other biochar was made of dried pine (Pinus sylvestris),
pyrolyzed at 700°C for 6 minutes, using a rotary KILN oven at Standard Bio. Due to its
very high surface area (above 600 m2/g) straight from the KILN, Standard Bio has
defined it as “active char”. The biochar from Standard Bio will therefore be referred to
as active char in this study as well.
The Leca used in this study was 12-20 mm round Leca, made by Liv Green Viking
Lecakuler. It was crushed manually, using a rod with a heavy weight attached (Fig. 2B).
In addition, there was two control groups: empty samples (Control1) and non-treated
growth media of organic soil and gravel (Control2).

The products were measured by size and put in a particle size distribution (table 1).

Table 1: Particle size distribution (weight %) of the three products crushed Leca, biochar and active char.
 Products      >10 mm        4-10 mm      3.15–4 mm    2–3.15        500 µm –2
A. Crushed Leca (left), active char (middle) and biochar        B. Crushing Leca manually using a weight
 (right).                                                        attached to a metal rod.

 C. Sieving machine.
Figure 2: Crushed Leca, active char, and biochar (A). Leca was crushed manually with a metal rod and a
weight (B). A sieving machine was used to determine particle size distribution of the products (C).

2.2 Experiment 1 and 2 – Physical parameters

Experiment composition and preparation
In experiment 1 and 2, plastic cups of 0.5 L were used (Fig. 2). The tests were
conducted in three batches for both experiments, with eight cups per batch in
experiment 1 and 10 per batch in experiment 2. All the products had one drained and
one undrained sample in each batch (fig. 3). The drainage holes were made by using a
small metal tube/pole, which was heated using a torch. This allowed the tube to melt
through the bottom of the plastic cups, clean without making unwanted damages or

 ___
  14
cracks, as this could potentially affect the data. A thin fabric was then measured and cut
to fit in the bottom of the drained cups to prevent the substrates from leaking through
the drainage holes. This was also done for the drained controls, to measure the fiber
cloths’ effects on dry, saturated, and drained weight, which could later be subtracted.

Figure 3: Illustration of batch setup in experiment 1 and 2. White boxes represents the 500 mL cups. Pure
products were used in experiment 1. Growth media of organic soil and gravel was included in experiment
2.

Experiment 1 was based on pure products and only included empty samples as control
(Control1). In experiment 2, each product was added to growth media (consisting of soil
and gravel) as soil amendment. This experiment included a second control group of
untreated growth media (Control2). The composition of experiment 2 is described in
greater detail in table 2.

Experiment 2 included growth media of gravel and soil, treated with products (Table 2).

Table 2: Product composition of experiment 2 (plastic cups with substrate mix) and 3 (5 L buckets with
substrate mix and winter wheat) in percent of total volume.
 Sample          Organic soil    Gravel (4-8    Leca           Biochar        Active char     Total
                                 mm)
 Control 1       0%              0%             0%             0%             0%              0%
 Control 2       20 %            80 %           0%             0%             0%              100 %
 Crushed         20 %            50 %           30 %           0%             0%              100 %
 Leca
 Biochar         20 %            50 %           0%             30 %           0%              100 %
 Active char     20 %            50 %           0%             0%             30 %            100 %

                                                                                                      ___
                                                                                                      15
Dry bulk density To measure the dry bulk density, each sample were put in separate beakers in an oven at 105 °C. Each sample of the first batch was weighed prior to the drying process. The weight of the empty cups was measured and subtracted from the samples’ total weight, leaving only the substrates’ weight. The first batch worked as a test pilot. This batch was set to dry for almost 23 hours (from 24.08.20, 16.00, to 25.08.20, 14.50). Each sample was then poured back into their respective plastic cups and weighed. The percentage of evaporated water was measured based on the pre- and post-drying weights. These measures indicated that 23 hours was probably an unnecessary long time, and it was concluded that the two subsequently batches were to be shortened into 8 hours of drying time instead. This gave similar weight ratio of pre- and post-drying compared to the pilot batch, and therefore used as new standard for the pure product experiment. For experiment 2 (or substrate mix experiment), the drying time was set to 24 hours to assure fully dried samples. Saturated bulk density After each batch was dried and weighed, they were put in a water bath for 48 hours, to ensure fully saturated samples. To avoid leaking of substrate from the cups, mosquito nets were placed on top and attached with rubber bands (fig. 4A). A small metal grid and rocks were used to hold the light cups down during the soaking process. This allowed for free water flow in and around the cups (fig. 4B). After 48 hours the samples were taken out one at the time, starting with the undrained cups. Saturated bulk density was measured by the weight of these cups, which then was divided by the sample’s dry weight, to find relative saturated bulk density. ___ 16
A. Samples from experiment 2 with       B. A metal grid with rocks was placed on top of the product
 mosquito net cover.                     samples to avoid them from floating and rolling over.

Figure 4: The samples were covered with mosquito nets before the water batch (A). In the water bath,
weight was used to avoid samples from floating and rolling over (B).

Draining speed
The drained sample cups were put on a drainage tray after the soaking process and
covered with plastic wrap to avoid evaporation. Each sample was measured by weight
at expanding time intervals until field capacity was reached, starting at 15 minutes - 30
minutes - 1 hour - 2 hours - 4 hours - 24 hours - 48 hours and 72 hours. Due to the small
sample sizes (500 mL), the draining process went relatively fast and there was little
change from 24-72 hours. Field capacity was therefore set at the 24-hour mark in
experiment 2 instead.
        In batch 1 and 2 in experiment 1, the samples were measured at time intervals
set relative to its previous weighing time, not relative to draining start. This made the
draining process unnecessary long and unprecise (the last intervals had days between
each other). The third batch and the whole experiment 2 was therefore measured at
intervals relative to drainage start (0 min), which shortened the intervals significantly
and thereby increased the accuracy of the data.

                                                                                                   ___
                                                                                                   17
Field capacity and soil water retention capacity The field capacity was measured at the final weighing (i.e., 24 h in experiment 2). The relative field capacity was then calculated by dividing the sample weight at field capacity, by the sample’s dry bulk density. To find soil water retention capacity, the water volume at field capacity (X cm3) was divided by the water volume at saturated weight (Y cm3). This number was then multiplied by 100 %, to get the percentage of water retained in each sample. Porosity The porosity of the different products and growth medias was calculated by dividing the water volume at saturated bulk density (X cm3), with total volume of the sample (500 cm3), multiplied with 100 %. 2.3 Experiment 3 – Drainage delay and plant survivability Experiment composition and preparation To monitor the effect of soil amendment on water delay and wilting of plants, 5-liter buckets were used. Ozon winter wheat (Triticum aestivum) was chosen as it is a good indicator of plant available water and thus optimal for the experiment (Akhter et al., 2004). There was a total of five main sample groups: Control 1 (empty), control 2 (pure growth media), and growth media treated with Crushed Leca, Biochar, and active char. All samples had three replicates, adding up to a total of 15 samples in total. The sample composition in experiment 3 was equal to experiment 2 (table 3). ___ 18
Table 3: Sample composition of experiment 3 in litres.
 Sample of 5    Organic        Gravel (4-     Leca       Biochar   Active       Total
 litres         soil           8 mm)                               char
 Control 1      0              0              0          0         0            0
 Control 2      1.0            4.0            0          0         0            5.0
 Crushed        1.0            2.5            1.5        0         0            5.0
 Leca
 Biochar        1.0            2.5            0          1.5       0            5.0
 Active char    1.0            2.5            0          0         1.5          5.0

Five seeds of Ozon Winter Wheat (Triticum aestivum) were sown at around 5 cm depth
in all samples. All the buckets were then placed in the bottom shelf of a climate-
controlled growth cabinet (Urban Cultivator) for the wheat to develop. There was 23
degrees Celsius in the bottom shelf during the whole testing period, with growing lights
going on at 7 in the morning and off 7 in the evening (12 hours/12 hours off) for
adequate growth conditions. This was done to represent natural light cycles during fall.
1000 mL of water was added to all samples after sowing, as well as 3 days after to fully
moisturize the growth media. The samples were then watered equally (250-500 mL)
two-three days per week to ensure adequate and available water for the plants to grow.
After three weeks, all samples were thinned down to three plants per bucket to equalize
the samples.

Delay
Delay was measured 39 days after the Winter Wheat was sown. All samples were taken
out of the growth cabinet and each sample was hung up in random order and added 0.5
L of water. A stopwatch was used to measure time from water was added to it started to
drain out of the buckets’ draining holes at the bottom. The substrates depth of each
sample was measured to be approximately 18.5 cm and measured time yields delay.

Permanent wilting point
The buckets were placed back into the growth cabinet November the 9th, after testing for
delay. Each sample then had the water from the delay test (500 mL) as last watering.
     Date for first sign of wilting in each of the three plants, per sample were set as 1st,
2nd, and 3rd wilting. Change of the color in the plant’s leaves were used for defining first

                                                                                         ___
                                                                                          19
sign of wilting (from deep green to yellow/brown). This was only a visual examination to arrive at a qualitative guess. 2.4 Experiment 4 - Testing prototype of mid-sized green roof Experiment composition and preparation To measure the different growth media’s properties in a more representative scale towards real green roofs, a green roof prototype was built. The mid-sized prototype (fig. 5) was built mainly with EURO Pallets and detachable pallet collars, enabling for changeable depth of growth medium. The water outlet was 9.5 cm x 4 cm and centered in the bottom-middle part of the first pallet collar. Following national guidelines in TEK17 (§ 13-12. Nedbør), a tilt of 1: 40 was used for roof slope. This was accomplished by having the back end of the roof elevated 3 cm higher (50 cm) than the front end (47 cm). The growth media in the roof model consisted of gravel (230 L) crushed Leca (12 L), biochar (35 L) and organic plant soil (70 L). Including a two cm drainage layer with round Leca at the bottom, the whole growth media made out a total of about 345 L. A cement mixer was used to properly blend everything together. After the mixing process, the growth media was poured into the roof model, and Spire Hestebeite (1 L) was sown, by gently drizzling the seeds evenly on top. When the seeds were sown, fertilizer (0.25 L Kullhøna) was added, and the growth media was watered thoroughly. It was then set outdoors to develop under natural conditions by rain and sun. Unfortunately, the prototype started leaking at several places under tests when water was added. The work and time needed to build several good quality models was too time consuming and demanded a higher level of technical construction skills. This experiment was therefore stopped, and no further testing was done. ___ 20
Figure 5: Prototype of the intensive green roof test model fully developed. Made of EURO pallets and
pallet collars as main construction material. Planted vegetation (Spire Hestebeite), drainage hole (white
square in the bottom middle) and a water collector tub underneath (black tub).

2.5 Statistical analyses
The statistical analyses were conducted in R Studio 1.2.5019 (R Development Core
Team, 2019) using 1-way analysis of variance (ANOVA), and Tukey pair-wise
comparisons for the difference in means between groups. The level of significance used
was p = 0.05. To avoid any violations of the ANOVA assumptions, all data were
controlled and properly transformed before the analysis.

                                                                                                      ___
                                                                                                       21
3 Results
3.1 Main findings
Results showed that the pine-based biochar from Standard Bio had the highest porosity
and water-holding capacity of the three products tested. It absorbed on average 8 times
its own weight with water by pure product, which was significantly higher than that of
the spruce-based biochar (p= 5.554 x 10⁻⁴) and crushed Leca (p= 3.18 x 10⁻⁵) on average
(fig. 6). The relative field capacity was also highest in Standard Bio’s biochar, which
retained significantly more water than both the spruce-based biochar and crushed Leca
(p= 5.4 x 10⁻⁵ and 3.0 x 10⁻⁷ respectively) in the pure product experiment (fig. 8). It was
also the only treatment which significantly increased porosity relative to no treatment
(p= 0.0056), and the crushed Leca (p= 0.0354) in the growth media experiment (fig.
11).
3.1.1 Relative saturated bulk density
There was a significant difference between all products on relative saturated bulk
density in the pure product experiment (fig. 6), and both active char (mean= 8.167) and
biochar (mean= 4.680) was significantly higher than the crushed Leca (mean= 2.403) on
average (p= 3.18 x10⁻⁵ and p= 5.203 x10⁻³ respectively). Active char was also
significantly higher than biochar (p= 5.554 x 10⁻⁴). R-squared analysis shows that 95 %
of the variations were described within the model.
The growth media was significantly affected by products on relative saturated
bulk density in experiment 2 (fig. 7) [F(3,8) = 26.79, pActive char, biochar and crushed Leca was compared for their relative saturated bulk
density as pure products (fig. 6).
Figure 6: Boxplot distribution of relative saturated bulk density of pure active char (AC), biochar (BC) and crushed
Leca (CL). Results showed significant difference in means between all groups, where the active char (8.167) was
significantly higher than both biochar (4.680) and Leca (2.403) (p= 5.52 x 10⁻⁴ and 3.18 x 10⁻⁵ respectively). Biochar
was also significantly higher than crushed Leca on average (p=5.20 x 10⁻³).
Growth media was tested for relative saturated bulk density when treated with active
char, biochar, and crushed Leca, using non-treated growth media (control2) as
reference (fig. 7).
___
23Figure 7: Boxplot distribution showing the effect on relative saturated bulk density in growth media treated with
active char (AC), biochar (BC), crushed leca (CL), and non-treated samples (Control2) were used as reference. The
active char (1.743) yielded significantly higher relative saturated bulk density than the biochar (1.577), crushed Leca
(1.557), and Control2 (1.353) on average (p=0.021, 0.011, and 9.07x10⁻⁶ respectively). There was no significant
difference between the BC and CL treatments (p=0.966), however, both were significantly higher than the Control2
group (p=0.004 and 0.007 respectively).
3.1.2 Relative field capacity
Both the active char (mean= 4.17) and biochar (mean= 2.867) had significantly higher
relative field capacity than the crushed Leca (mean= 1.423) on average by pure product
(p= 3.0 x 10⁻⁷ and 8.4 x 10⁻⁶ respectively). The active char was also significantly higher
than biochar (p= 5.4 x 10⁻⁵) (fig. 8). R-squared analysis shows that 99 % of the
variations were described within the model.
In the growth media experiment (fig. 9), both the active char (mean= 1.350) and
biochar (mean= 1.283) had significantly higher relative field capacity than the non-
treated control2 (mean= 1.127) on average (p= 6.942 x 10⁻⁴ and 0.0067 respectively).
Additionally, the active char also increased the relative field capacity significantly
higher than the crushed Leca (mean= 1.230) on average (p= 0.0287). No significant
difference was found between active char and biochar (p= 0.264), Leca and biochar
(p=0.430) or Leca and Control2 (p= 0.058). R-squared analysis shows that 80.3 % of
the observed variations of relative field capacity could be explained within the model.
___
24Active char, biochar and crushed Leca was compared for their relative field capacity as pure products (fig. 8). Figure 8: Boxplot distribution showing relative field capacity of the pure products active char (AC) biochar (BC) and crushed Leca (CL). Results showed significant difference between groups (p
Growth media was tested for relative field capacity when treated with active char,
biochar, and crushed Leca, using non-treated growth media (control2) as reference
(fig. 9).

Figure 9: Boxplot distribution of the effect on growth media (soil and gravel) treated with active char
(AC), biochar (BC) and crushed Leca (CL), and no treatment (Control2) on relative field capacity. The
average relative field capacity of active char (1.350) and biochar (1.283) was significantly higher than the
Control2 (1.127) group (p= 6.942x10 -4 and 0.0067 respectively). Active char was also significantly higher
than the crushed Leca (1.230) on average (p= 0.0287). There was no significant difference in means
between biochar and active char (p= 0.264), crushed Leca and biochar (p= 0.43), or crushed Leca and
Control2 (p= 0.0578).

3.1.3 Porosity

In the pure product experiment (fig. 10), both the active char (mean= 82.47 %) and
biochar (mean= 73.9 %) had higher average porosity than the Leca (mean= 49.57 %),
but only the active char was significantly different (p= 0.016). R-squared analysis
shows that 66 % of the observed variations in porosity were described within the model.
            Active char (mean= 56.67 %) provided significantly higher porosity to the
growth media than the crushed Leca (mean 48.0 %), and the non-treated control (mean
44.5 %) on average (p=0.0354 and 0.0056 respectively) (fig. 11). There was also no
significant difference between the biochar (mean= 50.27%) and Control2 (p= 0.178),
biochar and crushed Leca (p= 0.804) or crushed Leca and control2 (p= 0.537). Results

 ___
  26
from an R-squared analysis shows that 66.6% of the observed variations of porosity
could be described within the model.
Active char, biochar and crushed Leca was compared for porosity as pure products
(fig. 10).
Figure 10: Boxplot distribution of percentage porosity between active char (AC), biochar (BC) and crushed Leca
(CL). All products had relatively high porosity (~ 50%< pore volume). There was however only significant difference
between the Leca and active char samples (diff=-32.9, p=0.016). The biochar was on average 24.33 percentage points
higher than that of the Leca, but the difference was not significant (p=0.055). There was also no significant difference
between the biochar and active char (p=0.575), but the median of active char (~80 %) was a lot higher relative to that
of biochar (~69 %).
___
27Active char, biochar, and crushed Leca was measured and compared by their effect on
porosity in growth media, using non-treated growth media (control2) as reference (fig.
11).
Figure 11: Boxplot distribution of porosity in growth media treated with active char (AC), biochar (BC),
crushed Leca (CL) and non-treated (Control2). Active char (mean= 56.67%) was significantly higher than
both the crushed Leca (mean= 48.0%) and the control (mean= 44.5%), but not the biochar (mean=
50.27%) on average (p=0.035, 0.0056 and 0.126 respectively). The average porosity of biochar and Leca
was not significantly different from each other (p= 0.804), or the Control2 (p= 0.178 and 0.537
respectively).
3.2 Drainage speed and soil water retention capacity
In the pure product experiment, the active char and biochar samples seemed to yield
higher amounts of retained water (from ~160-190 cm3), than that of the crushed Leca
samples (from ~60-100 cm3) when fully drained. Most of the water loss happened
within the first 15 minutes for all samples and draining speed was therefore not
compared. Due to different time intervals throughout the experiment, average values
could not be measured, and thus no statistical analysis was conducted.
In the growth media experiment, the active char treated growth media lost the
most amount of water during draining (146.5 cm3), but the average percentage of water
retained water from saturation to field capacity (48.0 %) was still higher than both
biochar (45.3 %) and crushed Leca (41.3 %) (table 4). The biochar lost the least amount
of water from saturation to field capacity (137.2 cm3) and retained second highest by
percentage of all the products. Leca and Control2 lost on average 141.9 cm3 and 144.0
___
28cm3 of water respectively, but the control only retained 35.3 %. Most of the water loss
happened within the first 5 minutes for all samples, so differences in drainage speed
were not obtained (fig. 12). Although results indicate effect of treatment on water
retention percentage relative to saturation, an ANOVA test revealed that these findings
were not significant (p= 0.0612). An R-squared analysis shows that 42.5% of the
observed variations of soil water retention could be described within the model.
The capacity of treated and untreated growth medium to retain water during drainage
was measured as a percentage of the saturated water content (table 4).
Table 4: Percentage of water retained on average by active char, biochar and crushed Leca in growth
media (experiment 2). The water retention capacity was not significantly increased by products.
Products Water content at saturation Water lost (saturated cm3 – Percentage retained after
3 3
(cm ) drained cm ) draining (%)
Active char 283.2 146.5 48.0
Biochar 249.7 137.2 45.3
Crushed Leca 239.9 141.9 41.3
No treatment 222.5 144.0 35.3
The average drainage speed and soil water retention capacity of growth media treated
with active char, biochar, and crushed Leca, was tested for and compared. Non-treated
growth media (control2) was used as reference (fig. 12).
___
29Average water retention capacity (in ccm) of treated and
300
285
untreated growth media during draining (experiment 2)
270 Control2 CL
255
Water volume (ccm)
240
225 BC AC
210
195
180
165
150
135
120
105
90
75
60
0 min 5 min 10 min 15 min 30 min 60 min 120 min 240 min 1440 min
Draining time
Figure 12: Line chart showing average water content in growth media (cm3) from saturated (0 min) to
fully drained samples (1440 min). The growth media was treated with active char (AC), crushed Leca
(CL) and biochar (BC). Control2 represents non-treated growth media. The active char retained the most
amount of water on average (48.0%), followed by biochar (45.3%) and crushed Leca (41.3%). No
significant effect was found by products relative to non-treated growth media (p> 0.05).
3.3 Drainage delay
There was no significant difference between treated and untreated growth media (p>
0.05), although every sample containing growth media was significantly higher than the
empty Control1 samples (p< 0.05). Crushed Leca (mean= ~15 sec) did however show
much higher average delay than all the other samples (mean= ~9-10 sec), although
variations in the data made it insignificant. R-squared analysis shows that 78 % of all
variations were described in the model.
3.4 Wilting point
There was no significant difference between treated and non-treated growth media on
permanent wilting point [FWilting3(3,8)= 1, p >0.05], and the first plant (1/3) in all
buckets showed sign of wilting before the experiment started. The last plant (3/3) in the
biochar, crushed Leca and Control2 groups showed sign of wilting 3 days after drought
start on average, whereas for the active char group, the average sign of wilting was 4.33
days.
___
304 Discussion
Norway is one of many Northern countries which experiences increased precipitation
(Meteorologisk institutt, 2021) and flooding (NVE, 2020), due to climate change. Green
roofs have shown to decrease stormwater runoff in urban areas (Berghage et al., 2009;
Rai et al., 2017; Speak et al., 2013), and could be one solution to the problem. Weight is
a limiting factor on roof tops, thus using soil amendments with high water-holding
capacity relative to its dry weight is important. Different char types have shown
promising results (Bikbulatova et al., 2018; Cao et al., 2014; Rawat et al., 2019), but
their properties may vary greatly based on feedstock and production parameters.
In this study, we found that both types of biochar increased the water-holding capacity
of growth media significantly (p=0.0067 and 6.942x10⁻⁴ respectively). Additionally, we
found that the biochar with the highest pore volume promoted significantly higher
water-holding capacity to the growth media than the crushed Leca (p= 0.0287).
Several other studies have found similar effect of biochar in growth media (Beck
et al., 2011; Cao et al., 2014; Kuoppamäki et al., 2016). For instance, Bikbulatova et al.
(2018) and Zhang & You et al. (2013) found a strong correlation between higher
porosity and higher water-holding capacity (Bikbulatova et al., 2018; Zhang & You,
2013). Studies have shown that using small-particle sized, carbon-rich, and wood-based
feedstock, pyrolyzed at 400-700°C with long residence time (30-120 min) yielded the
highest porosity (Gray et al., 2014; Leng et al., 2021). The pine-based active char from
Standard Bio was pyrolyzed under short residence time, but it had the smallest average
particle size (10 mm), which further decrease pore development according to
the findings of Leng et al. (2021). Despite this, the biochar still had significantly higher
___
31saturation and field capacity by own weight, than the crushed Leca as pure product (p= 5.203 x 10⁻³ and 8.4 x 10⁻⁶ respectively), and the non-treated growth media in experiment 2 (p= 0.004 and 0.0067 respectively). In other words, the biochar significantly increased water-holding capacity, even though it did not significantly increase the porosity of the growth media. In the drainage delay test, there was no significant results between treated and non- treated growth media. In a study by Huang et al. (2020) that used similar methods to this study, they found that biochar significantly delayed stormwater runoff (Huang et al., 2020). The biochar used by Huang et al. (2020) was based of cedar (a genus from the pine family), pyrolyzed at 750 °C, which was later grounded and sieved through 2 mm sieves. They also used cylindrical containers (same principle as the 5 L buckets), added water on top and measured time from water was added to it started to drain underneath. However, their samples (~17 L) were over three times bigger than those used in our experiment (5 L) and pre planted with perennial grass (Zoysia matrella). Sample size surely makes a difference in residence time for the water and the perennial grass likely also affected the drainage delay to a larger degree than the small amount of winter wheat used in our samples. Huang et al. (2020) did not provide details of what oven they used to make the biochar, which makes it difficult to compare to the KILN made active char in our study. All these factors could play an important role when measuring drainage delay, and some adjustments might be useful to optimize results in future testing. For instance, using mid-sized roof models for more specific and representative testing. This would significantly increase sample volume and thus residence time for the water, making it easier to measure the time differences. Additionally, using an automatic irrigation system with integrated timer and water runoff measuring sensor, would provide a lot more precise data. Unfortunately, using green roof models in this study was not feasible as the experiment became too time consuming, but this should be included in future testing. There was no effect by any treatment on permanent wilting point in our study, and signs of wilting were observed already before the experiment started. This might indicate flaws in the experiment setup. First sign of wilting, here based on leaf color change, could be influenced by several factors such as lighting, temperature, pH-levels, pathogens and more, so these findings does not necessarily represent drought ___ 32
conditions. For instance, none of the samples received any fertilizer during the
experiment and was purely dependent on nutrients in the sample’s soil. Additionally,
biochar’s micropores can absorb nutrients from the soil if it is not pre-loaded (Gong et
al., 2019), prohibiting plants from getting enough nutrients. This might have happened
in our experiment, due to the lack of available nutrients.
           The watering during development of the wheat might have been inadequate as
well, since it was not done in a strict systematically matter (i.e., by an irrigation
system). However, plant available water was not tested for in our research and the
wilting experiment was only based on first sign of wilting as a qualitative guess. In their
study, Cao et al. (2014) did not find significant effect of biochar on permanent wilting
point either, but the plant available water was significantly increased. This might
indicate that wilting of plants is not solely based on water available, but also other
factors as discussed before. Additionally, they used controlled release fertilizer during
the wheat development phase, which is not comparable to our study.
           That considered, using the wheat leaves’ color as an indicator, the wilting
experiment could provide a rough estimate as to which the different treatment yielded
effect. Using three plants per sample allowed for more noise in the data, and the volume
(5 L) might have been excessive at such small testing scale. Therefore, using more
samples of smaller sizes, and having one plant per sample, could provide more precise
results.

The amount of product added to the growth media in our research was 30 % by volume.
Although this provided significant results, Cao et al. (2014) found that adding 40 %
biochar by volume to the growth media yielded the highest water-holding capacity. In
terms of plant survivability, finding the right amount of water-holding capacity should
also be in focus. Although drought is a big threat to plants, too much water can drown
them. Additionally, biochar can be expensive. It is therefore also important to find the
most effective biochar type, which could potentially decrease the amount needed in
green roofs and thus significantly lower the cost. Future testing should therefore include
different percentages of amendment in the growth media, to find the most optimal dose
in terms of cost, water-holding capacity, and plant survivability.

Considering that our study design was based on 0.5 L cups and 5 L buckets, it might not
be representative for a real green roof. It does however provide a baseline of knowledge

                                                                                         ___
                                                                                         33
for further testing in bigger roof-like models. Green roof models used for testing, varies in size and design from study to study, based on available resources, testing protocols and time horizon (Busklein, 2009; Busklein et al., 2014; Trommald et al., 2018). For instance, Busklein et al. (2014) built simple and smaller models, made for indoor testing under controlled circumstances (using irrigation system and digital monitoring), while Trommald et al. (2018) built bigger models for testing outdoors over several years. These are some of the important factors to include when designing and constructing the green roof. The Leca used in our experiments was crushed by hand, which undoubtedly influences the size distribution compared to a standardized machine-crushed Leca product. For instance, Leca Norge offers two kinds of crushed Leca:
References
Aarnes, T. A. (2018, February 27). Infiltrasjon grunnvannstand og grunnvannbalanse.

        Hydrologi og grunnvann, Bø.

Abel, S., Peters, A., Trinks, S., Schonsky, H., Facklam, M., & Wessolek, G. (2013).

        Impact of biochar and hydrochar addition on water retention and water repellency of

        sandy soil. Geoderma, 202–203, 183–191.

        https://doi.org/10.1016/j.geoderma.2013.03.003

Basu, P. (2013). Biomass Gasification, Pyrolysis and Torrefaction: Practical Design and

        Theory. Elsevier Science & Technology. http://ebookcentral.proquest.com/lib/ucsn-

        ebooks/detail.action?docID=1319046

Beck, D. A., Johnson, G. R., & Spolek, G. A. (2011). Amending greenroof soil with biochar to

        affect runoff water quantity and quality. Environmental Pollution, 159(8), 2111–2118.

        https://doi.org/10.1016/j.envpol.2011.01.022

Berghage, R. D., Beattie, D., Jarrett, A. R., Thuring, C., Razaei, F., & O’Connor, T. P. (2009).

        Green Roofs for Stormwater Runoff Control. Office of Research and Development,

        EPA, 83124401, 81.

Berndtsson, J. C. (2010). Green roof performance towards management of runoff water quantity

        and quality: A review. Ecological Engineering, 36(4), 351–360.

        https://doi.org/10.1016/j.ecoleng.2009.12.014

Bikbulatova, S., Tahmasebi, A., Zhang, Z., Rish, S. K., & Yu, J. (2018). Understanding water

        retention behavior and mechanism in bio-char. Fuel Processing Technology, 169, 101–

        111. https://doi.org/10.1016/j.fuproc.2017.09.025

Braskerud, B. C. (2016). Grønne tak for flomdemping.

        https://www.nve.no/Media/5036/overvann-gr%C3%B8nne-tak-for-flomdemping.pdf

Brouwer, C., Goffeau, A., & Heibloem, M. (1985). CHAPTER 2—SOIL AND WATER. FAO -

        FOOD AND AGRICULTURE ORGANIZATION OF THE UNITED NATIONS.

        http://www.fao.org/3/r4082e/r4082e03.htm

                                                                                             ___
                                                                                              35
Busklein, J. O. (2009). Urbanisering – Grønne tak i urbane strøk. Feltforsøk avrenning. (SBF
IN F09416). SINTEF Byggforsk.
https://static1.squarespace.com/static/593fc2c8cd0f6896d263b925/t/59451b9fccf210b8
2f129bdd/1497701295635/SINTEF++RAPPORT+Gr%C3%B8nne+tak+i+urbane+str%
C3%B8k.+Feltfors%C3%B8k+avrenning+%281%29.pdf
Busklein, J. O., Thodesen, B., & Balmand, E. (2014). Testing of Leca’s® Attributes and Use in
Green Roofs Solutions (SBF 2012 F0254). SINTEF Building and Infrastructure.
Cao, C. T. N., Farrell, C., Kristiansen, P. E., & Rayner, J. P. (2014). Biochar makes green roof
substrates lighter and improves water supply to plants. Ecological Engineering, 71,
368–374. https://doi.org/10.1016/j.ecoleng.2014.06.017
Creamer, A. E., Gao, B., & Zhang, M. (2014). Carbon dioxide capture using biochar produced
from sugarcane bagasse and hickory wood. Chemical Engineering Journal, 249, 174–
179. https://doi.org/10.1016/j.cej.2014.03.105
Curell, C. (2011, November 11). Why is soil water holding capacity important? MSU
Extension.
https://www.canr.msu.edu/news/why_is_soil_water_holding_capacity_important
Davis, J. G., & Whiting, D. (2013). Choosing a Soil Amendment. 7.235, 3.
EBC. (2012). European Biochar Certificate—Guidelines for a Sustainable Production of
Biochar (Version 9.2E of 2nd December 2020). European Biochar Foundation (EBC).
http:European-biochar.org
EBC, & IBI. (2014). Comparison of European Biochar Certificate Version 4. 8 and IBI Biochar
Standards Version 2.0. International Biochar Initiative. https://www.biochar-
international.org/wp-content/uploads/2018/04/IBI-EBC_comparison_Oct2014.pdf
EEA. (2017, February 15). Mean precipitation—European Environment Agency [Indicator
Assessment]. European Environment Agency. https://www.eea.europa.eu/data-and-
maps/indicators/european-precipitation-2/assessment
Eriksson, A. (2012). Physical and hydraulic properties of crushed 4-10 mm Leca®. Norges
teknisk-naturvitenskapelige universitet - NTNU.
___
36Fitts, C. R. (2013). 2—Physical Properties. In C. R. Fitts (Ed.), Groundwater Science (Second
Edition) (pp. 23–45). Academic Press. https://doi.org/10.1016/B978-0-12-384705-
8.00002-9
Fleig, A. (2018). URBAN HYDROLOGY AND FLOOD MODELLING.
https://www.nve.no/Media/7492/urban_floods_studentdag2018.pdf
FN-Sambandet. (2019, December 3). Befolkning. https://www.fn.no/tema/fattigdom/befolkning
Gong, H., Tan, Z., Zhang, L., & Huang, Q. (2019). Preparation of biochar with high
absorbability and its nutrient adsorption–desorption behaviour. Science of The Total
Environment, 694, 133728. https://doi.org/10.1016/j.scitotenv.2019.133728
Gray, M., Johnson, M. G., Dragila, M. I., & Kleber, M. (2014). Water uptake in biochars: The
roles of porosity and hydrophobicity. Biomass and Bioenergy, 61, 196–205.
https://doi.org/10.1016/j.biombioe.2013.12.010
GRO. (2011). The GRO Green Roof Code: Green Roof Code of Best Practice for the UK 2011.
Groundwork Sheffield.
https://ec.europa.eu/environment/life/project/Projects/index.cfm?fuseaction=home.show
File&rep=file&fil=GRO_Green_Roof_Code.pdf
Hettiarachchi, S., Wasko, C., & Sharma, A. (2018). Increase in flood risk resulting from climate
change in a developed urban watershed – the role of storm temporal patterns.
Hydrology and Earth System Sciences, 22(3), 2041–2056. https://doi.org/10.5194/hess-
22-2041-2018
Hopmans, J. W. (2011). 2.05—Infiltration and Unsaturated Zone. In P. Wilderer (Ed.), Treatise
on Water Science (pp. 103–114). Elsevier. https://doi.org/10.1016/B978-0-444-53199-
5.00031-2
House, R., & Wallemacq, P. (2018). Economic Losses, Poverty & Disasters 1998-2017.
https://www.preventionweb.net/files/61119_credeconomiclosses.pdf
Huang, S., Garg, A., Mei, G., Huang, D., Chandra, R. B., & Sadasiv, S. G. (2020). Experimental
study on the hydrological performance of green roofs in the application of novel
___
37You can also read