BAYESIAN (FOOT)BALLERS - 2022 SOA Student Research Case Study Challenge Arizona State University
←
→
Page content transcription
If your browser does not render page correctly, please read the page content below
BAYESIAN
(FOOT)BALLERS
2022 SOA Student Research
Case Study Challenge

Arizona State University
Lydia Gabric
Gina Gilkey
Hayley Osterkorn
Joe Simpson
Faculty Advisor Dr. Hongjuan Zhou, ASA, Ph.D.

 1
2

 Table of Contents
 Executive Summary ................................................................................................................... 3
 Team Selection ......................................................................................................................... 4
 Player Selection Process .................................................................................................................... 4
 Probability of Success ........................................................................................................................ 6
 Economic Impact....................................................................................................................... 7
 Expenses .............................................................................................................................................. 7
 Revenue and Profit ............................................................................................................................. 8
 Financial Projections .......................................................................................................................... 8
 GDP Impact .......................................................................................................................................... 9
 Sensitivity Analysis ............................................................................................................................ 10
 Data, Data Limitations, and Assumptions................................................................................ 12
 Data and Data Limitations ............................................................................................................... 12
 Assumptions ...................................................................................................................................... 13
 Implementation Plan ............................................................................................................... 14
 Data to Monitor ................................................................................................................................. 15
 Risk and Risk Mitigation Considerations ................................................................................. 16
 Conclusion .............................................................................................................................. 17
 Appendix A – PCA .................................................................................................................... 18
 Appendix B – Decision Trees ................................................................................................... 21
 Appendix C – Player Score Weights ......................................................................................... 22
 Principal Component Approach....................................................................................................... 22
 Principal Component Verification: Decision Trees and Literature Review Approach............... 24
 Appendix D – Team Score and 2021 Tournament Result ........................................................ 27
 Appendix E – Success Probabilities ......................................................................................... 29
 Appendix F – Expenses, Revenues, and Profit ......................................................................... 31
 Appendix G– Financial Projections .......................................................................................... 33
 Appendix H– GDP .................................................................................................................... 34
 Appendix I– R code: PCA ......................................................................................................... 36
 Appendix J – R code: Decision Trees ....................................................................................... 42
 References.............................................................................................................................. 47

3

 Executive Summary
 The Actuarial Consulting Firm (ACF) has enjoyed the opportunity to work with the Executive
 Committee of Hammessi Bayes on this project beginning January 2022. ACF has successfully
 applied machine learning techniques to build a player selection model and construct the first ever
 competitive national football team for Rarita, the Bayesian (Foot)Ballers. From its pre-existing
 organized leagues using 995 million Doubloons (∂) of government funding, this newly branded team
 has an initial roster of 25 Rarita football players.

 ACF is confident that by following the ten-year implementation plan and annual review process in
 this report in conjunction with the player selection model, the Bayesian (Foot)Ballers will be a
 “competitive” team and qualify for the international Football and Sporting Association (FSA) League,
 place in the FSA top ten within the next five years, and have high probability of winning the FSA
 championship within ten years. As a result of this football brand, Rarita will undergo economic
 growth and development, detailed by GDP and profit increases after considering fixed and variable
 expenses throughout the next ten years. ACF has also provided in this report risk assessment and
 mitigation to assure the team’s victory.
4

 Team Selection
 Player Selection Process
 ACF utilized several resources to determine which player statistics are most indicative of success
 for each position. These resources included data-driven techniques such as decision trees and
 principal component analysis (PCA), along with literary sources. Notable important statistics
 included goals, shots, expected goals, pass completions, key passes, tackles that led to possession,
 successful pressures, interceptions, and save percentages.

 Additionally, ACF used literary sources to determine which formation would best suit Rarita’s initial
 team. The most optimal choices were 4-4-2, 4-5-1, or 4-3-3, with the two former options being more
 defensive and the latter more offensive. 4-5-1 was selected as the best fit for Rarita’s scheme since
 it allows for the most flexibility with midfielders and has a more defensive nature, useful for newer
 teams.

 After developing assumptions based on PCA (Appendix C Tables 16-19), ACF created a selection
 model to assign scores to players based on their position and statistical performance relative to
 other players of the same position; these scores serve as a measure of player skill for player
 selection. By applying the PCA’s weight assumptions, scores (Equations 1-4) for player skills were
 generated based on 2020 and 2021 league data.

 Equation 1: Score Calculation for Forwards
 = 0.60 ∗ ℎ + 0.40 ∗

 Equation 2: Score Calculation for Midfielders
 = 0.25 ∗ ℎ + 0.50 ∗ + 0.25 ∗

 Equation 3: Score Calculation for Defenders
 = 0.25 ∗ + 0.75 ∗

 Equation 4: Score Calculation for Goalkeepers
 =

 Final player scores for their primary position were then computed using a playing time weighted
 average (Equation 5).

 Equation 5: Final Player Score Calculation
 (2020 90 ∗ 2020 + 2021 90 ∗ 2021 )
 =
 (2020 90 + 2021 90 )

 When selecting players, ACF adopted a holistic approach using player scores as a component of the
 process rather than the sole factor considered. The process involved selecting a mixture of younger
 players to start as backups, along with experienced players to serve as starters and mentor younger
 players. This ideology allows younger players time to develop before taking on starting roles and
 provides the baseline for a sustainable cycle of players over the next several years. Additionally, ACF
5

 only considered Rarita players to increase national pride in the team amongst Rarita’s citizens. The
 above analysis contributed to the Rarita players selected (Table 1).

 Table 1: Team Selection

 To verify the above player selection, ACF employed another similar methodology based on selected
 statistics determined by decision trees (Appendix B) and literature review. The weight assumptions
 and player selection results are in Appendix C. Through comparison with the PCA’s selected players
 in Table 21, 76% of players selected were consistent across both methodologies, leading to
 confidence in PCA player selections (Table 1).

 As another way to verify the above selection result, ACF applied the PCA player selection model to
 2021 tournament data and then computed team scores for comparison to tournament results.
 Position grouping scores were computed for each team using a playing time weighted average for
 players in that position, and final team scores were created using Equation 6.

 Equation 6: Final Team Score Calculation
 = 0.15 ∗ +
 0.30 ∗ +
 0.30 ∗ +
 0.25 ∗
6

 The results for final team scores (Appendix D Table 27) were directionally consistent with
 tournament results, confirming PCA as a promising method to select players.

 Probability of Success
 Bayes stated two goals for success: finishing in the FSA top ten within five years and having a high
 likelihood of winning the FSA championship within ten years. The probabilities of achieving these
 goals were computed by comparing the position grouping scores of 2021 tournament nations with
 those of the Bayesian (Foot)Ballers. Upper and lower bound success probabilities for the Bayesian
 (Foot)Ballers were computed based on this comparison (Appendix E Tables 30-31). The analysis
 showed an 82.5% probability for the first goal and 62.5% for the second. More in-depth explanation
 is in Appendix E.
7

 Economic Impact
 Expenses
 ACF considered expenses such as player and staff salaries as well as other expenses including
 facilities, rent, and equipment (Table 2).

 Table 2: Fixed/Variable Distribution of Expense Categories
 Expense Expense Variable Percentage Fixed Percentage
 Category

 Salaries Player Salaries 100% 0%

 Salaries Management, Board, Committees 50% 50%

 Other Facilities, Rent, Equipment, etc. 80% 20%

 To be consistent with practices of other national teams, player salaries for the team will be paid on
 a per-match basis. To estimate the cost of all player salaries in a season, the per-match salary was
 set at ∂3,453.03 (Appendix F). ACF assumed that teams play four “friendlies”, or non-tournament
 matches against other teams, each season. Qualifying rounds are common in the FSA tournament.
 Based on the number of teams in the tournament data, ACF assumed that two zones of 28 teams
 each would be used for qualifying, including Rarita’s Bayesian (Foot)Ballers. If the team qualifies,
 they can progress to the tournament.

 The lower bound, average, and upper bound for number of matches per season is shown in Table
 3.

 Table 3: Matches Played Estimation
 Match Type Lower Bound No. Matches Average No. Matches Upper Bound No. Matches

 Friendlies 4 4 4

 Qualifiers 4 4 4

 Tournament 0 2 5

 Total 8 10 13

 ACF calculated estimations for total player salaries using the number of players on the roster. Then,
 ACF estimated salaries for team staff such as management, committees, and board members,
 based on salaries from the United States Soccer Federation (USSF), separated into fixed and
 variable expenses. Other expenses were estimated using Rarita’s Per Capita Other Expenses in the
 provided data. All variable expenses were scaled by the number of matches, since being knocked
 out of the tournament earlier will result in fewer expenses for training and staff.
8

 Table 4: Annual Expenses
 Per Season Expense Lower Bound (∂) Average (∂) Upper Bound (∂)

 Player Salaries 690,606 863,258 1,122,235

 Fixed Staff Costs 16,118,713 16,118,713 16,118,713

 Variable Staff Costs 3,393,413 4,241,767 5,514,297

 Fixed Other Expenses 450,694,187 450,694,187 450,694,187

 Variable Other Expenses 23,720,747 29,650,933 38,546,213

 Total Expenses 494,617,667 501,568,858 511,995,645

 Revenue and Profit
 Broadcast and commercial revenue were considered as the main sources of revenue for the
 international team, since ACF assumed that the FSA would receive any ticket revenue from games.
 ACF calculated broadcast and commercial revenues using Rarita’s 2016-2021 Per Capita
 Broadcast and Per Capita Commercial revenues (Appendix F). ACF assumed revenues as 20% fixed
 and 80% variable. Profit per season was calculated from the total revenue per season and total
 expenses per season (Table 5). This indicates that Rarita’s new team is profitable.

 Table 5: Seasonal Expenses, Revenues, and Profits
 Lower Bound (∂) Average (∂) Upper Bound (∂)

 Total Expenses Per Season 494,617,667 501,568,85 511,995,645

 Total Revenue Per Season 620,181,628 691,059,528 797,376,379

 Total Profit Per Season 125,563,962 189,490,670 285,380,734

 Tournament winners earn an unknown amount of prize money, so the prize was not included as
 potential revenue. However, if the Bayesian (Foot)Ballers win a tournament, it is recommended that
 half of the prize money is split among the players and the other half used to reinvest in the team or
 make charitable contributions to sports organizations around Rarita.

 Financial Projections
 To estimate the spot rates as of January 1, 2022, ACF selected the median of the provided spot
 rates at each maturity (Figure 1).
9

 Figure 1: Projected Spot Rates
 Projected 2022 Spot Rate
 4.50%
 4.00%
 3.50%
 3.00%
 2.50%
 2.00%
 1.50%
 1.00%
 0.50%
 0.00%
 1 2 3 4 5 6 7 8 9 10
 Maturity

 2018 2019 2020 2021 Projected

 ACF used the estimated spot rates to calculate future values for expenses, revenues, and profit.
 Figure 2 illustrates lower bound, average, and upper bound profit projections.

 Figure 2: Projected Annual Profits
 National Rarita Team Profit Projecitons
 ∂ 600,000,000

 ∂ 500,000,000

 ∂ 400,000,000

 ∂ 300,000,000

 ∂ 200,000,000

 ∂ 100,000,000

 ∂0
 2023 2024 2025 2026 2027 2028 2029 2030 2031 2032

 Lower Bound Average Upper Bound

 GDP Impact
 The annual GDP impact was calculated by Equation 7.

 Equation 7: GDP Impact Per Capita

 =
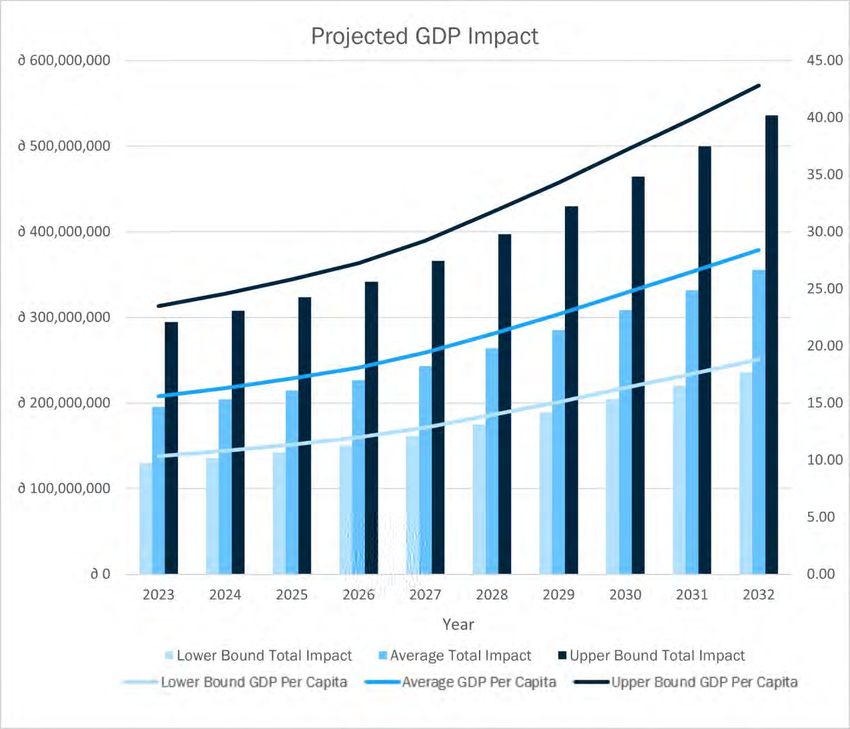
10

 The total Rarita population data was given up to 2020; thus, the total population was projected
 through 2032 (Appendix H). The annual Rarita GDP can be observed in Figure 3 and Appendix H.
 The Bayesian (Foot)Ballers are projected to annually increase the Rarita GDP per capita regardless
 of number of matches played.

 Figure 3: Projected Annual GDP Impact

 The Bayesian (Foot)Ballers will bring economic benefits to other related industries. Restaurants and
 bars will have more customers watching matches. Retail will also benefit from the sale of team-
 related merchandise. Sponsoring brands will see increased sales from the recognition. Hosting
 friendlies will increase tourism, bringing revenue to related transportation industries.

 Sensitivity Analysis
 ACF tested the spot and inflation rate sensitivities. To test the spot rate sensitivity, ACF applied the
 lower quartile and upper quartile of spot rates (Table 33) to the average profit scenario.
11

 Figure 4: Spot Rate Sensitivity Analysis for Profit
 Spot Rate Sensitivity Analysis
 ∂ 400,000,000

 ∂ 350,000,000

 ∂ 300,000,000

 ∂ 250,000,000

 ∂ 200,000,000

 ∂ 150,000,000

 ∂ 100,000,000

 ∂ 50,000,000

 ∂0
 2023 2024 2025 2026 2027 2028 2029 2030 2031 2032

 Lower Quantile Median Upper Quantile

 Similarly, the inflation rate’s sensitivity was tested by increasing and decreasing the base inflation
 rate (2.5%) by 10%.

 Figure 5: Inflation Rate Sensitivity Analysis for Profit
 Inflation Rate Sensitivity Analysis
 ∂ 400,000,000

 ∂ 350,000,000

 ∂ 300,000,000

 ∂ 250,000,000

 ∂ 200,000,000

 ∂ 150,000,000

 ∂ 100,000,000

 ∂ 50,000,000

 ∂0
 2023 2024 2025 2026 2027 2028 2029 2030 2031 2032

 10% Decrease Base 10% Increase

 The sensitivity to the change in spot rate and inflation rate increases as time increases. However, it
 appears that the profit projections under the average scenario are more sensitive to a change in
 spot rate than a change in inflation rate.
12

 Data, Data Limitations, and Assumptions
 Data and Data Limitations
 ACF received player statistics from the 2020 and 2021 league and tournament seasons. However,
 only the tournament results were provided. Similarly, some players did not have populated statistics
 or were only documented within the league or tournament datasets. Financial information was
 provided for Rarita and other nation’s football teams at a total level that included the national teams
 and league teams. Therefore, ACF was unable to directly allocate expenses that would be applicable
 to the Rarita National Team.

 ACF came up with solutions or assumptions for the following data limitations (Table 6).

 Table 6: Data Limitations and Solutions
 Limitation Solution or Assumption

 No league results data for 2020 Used the tournament data and tournament results for
 and 2021 creating player selection criteria

 No passing or defense tournament Used the 2021 tournament data and tournament results
 data for 2020 for creating player selection criteria

 Some players are assigned a Assumed the first position listed was their “primary”
 combination of positions (i.e. DFFW) position

 Some players in the league data are Assumed that player statistics would be consistent within
 not included in the tournament data a league and tournament setting

 Nation Dosqaly does not have 2021 Nation Dosqaly was excluded from analysis
 tournament goalkeeping data

 No player injury or penalty data Advised to collect player injury and penalty data in the
 future as data to monitor

 Data used for expenses included the USSF’s 2021 Audited Financial Statement, and for player
 salaries, ACF used data from England’s Football Association, the United States Women’s National
 Team, and the United States Men’s National Team.
13

 Assumptions
 Table 7: Assumptions
 Variable Assumption

 Number of Matches Bayesian (Foot)Ballers play four friendlies, play in a 28-team
 qualifying round, and may play in a 24-team FSA tournament,
 resulting in an estimated 8 to 13 matches.

 Expenses, Revenues, and Profit These variables are consistent for each year.

 Annual Inflation Rate 2.50%

 Currency Exchange Rates The Dollar To Euro 5-year Average is 0.870. The Euro to
 Doubloon 5-year Average is 1.134.

 Player Position For players with multiple positions listed, the first position is
 their primary position and serves as the basis for their positional
 score.

 Tournament/League Data Tournament and league data are collected in a comparable
 manner.

 Player Salary The per-match player salary is ∂3,453.03 (Appendix F).
14

 Implementation Plan
 ACF developed an annual plan for the Bayesian (Foot)Ballers for repeated tasks (Figure 6) as well
 as a full ten-year timeline (Table 8).

 Figure 6: Annual Plan

 January
 October-December
 Re-evaluate Player
 Re-Assess Player Success Selection and
 Assumptions Based on Coaching Staff
 Emerging Data, Project Based on New
 Revenue and Expenses for Tournament and
 Upcoming Year League Data

 August-September Febuary-March
 Review Results of Tournament, Finalize FSA Championship Players and
 Review Direct Tournament Coaching Staff, Review Previous Year's
 Revenue and Expenses, Initial Revenue and Expenses, Staff Adjust
 Rarita Player and Staff Tactics Based on Previous Years
 Evaluations

 April-May
 Begin Player
 June-July Training, Heavy
 FSA Championship, Focus on Marketing
 Data Team Gathers Upcoming
 Data from Games Tournament,
 Schedule
 "Friendlies"
15

 Table 8: Ten Year Implementation Plan
 Years • Heavy emphasis on marketing the new team to Rarita citizens
 1-3 • Qualify for the international FSA
 • Veteran players mentor younger players
 • Re-evaluate player success assumptions with new data
 • Finish in the top ten by year 3

 Years • Expand marketing internationally to increase tourism
 4-6 • Younger players begin taking on starting roles
 • Veterans relegate to backup or mentor roles
 • New set of young players join as backups
 • Finish in top ten at least twice

 Years • Continue cycling players; backups from years 1-3 are now leading as veterans
 7-10 • Evaluate additional goals for the next decade
 • Win an FSA championship

 Data to Monitor
 To improve future player selection and to conduct player performance reviews, the following data
 should be collected on an annual basis (Table 9).

 Table 9: Data to Monitor
 Annual Report Metric Source

 Tournament Rankings Tournament player and team scores based on
 current assumptions

 Annual Revenue Both direct revenue from tournaments and
 indirect revenue

 Annual Expenses Both direct expenses from tournaments and
 indirect expenses

 Detailed Tournament Player and Rarita Continue collection of player statistics; collect
 League Player Statistics injury and penalty data
16

 Risk and Risk Mitigation Considerations
 Injury Risk
 • Intrinsic risk factors include age and muscle strength, while extrinsic factors include
 equipment and rules of play.
 • Repeated injury can cause chronic conditions, impact team performance, and have negative
 financial impact.
 o The 2014 FIFA World Cup had 1.7 injuries per match and 1.0 injuries per match
 expected to result in time loss.

 Injury Risk Mitigation
 • Employ thorough training programs and invest in player injury and health insurance.
 o The FIFA 11+ Training Program reduced injuries by 30% for teams who participated
 at least twice per week.

 Reputation Risk
 • “Football hooliganism” refers to violent and abusive fans or players, which has resulted in
 injuries, deaths, and damaged reputations.
 • Although rare, it is an imperative risk to mitigate due to the potential dire impact to Rarita’s
 reputation.

 Reputation Risk Mitigation
 • Separate fans by nation, have video surveillance for security, and impose punishments for
 rowdy behavior.
 • Hire a sports psychologist and a coach who also emphasizes sportsmanship.

 Economic risk due to changing spot and inflation rates is not a concern based on our sensitivity
 analysis. Other broader risks such terrorism, political, and pandemic risks can be mitigated by hiring
 a risk management officer, ensuring a governing body in the Rarita league, and seeking general
 liability insurance.
17

 Conclusion
 ACF strongly advises the Executive Committee of Hammessi Bayes to utilize the player selection
 framework based on a 4-5-1 formation and implementation plan in this report to launch the
 Bayesian (Foot)Ballers by 2023. The team is predicted with high probability to place in the FSA top
 ten within five years and to win the FSA championship within ten years. ACF’s supporting analysis
 and financial projections have revealed that Rarita can launch a future top team in the FSA that
 subsequently brings an economic boom and increase in tourism from broadcast and commercial
 revenue and a reputable football brand.
18

 Appendix A – PCA
 Due to the large number of player statistics, ACF used PCA to reduce the dimensionality while
 continuing to encapsulate the data’s information. PCA was performed on the 2021 shooting,
 passing, defense, and goalkeeping player statistics separately. Principal components were chosen
 until approximately 60% of the total variation was explained (Table 10). Similarly, the principal
 components are listed in the appendix in Tables 11-14.

 Weights for player scoring were then found by computing a weighted average of the principal
 components selected using the proportion of variance explained as weights. These weighted
 average components were then scaled so the sum of the components was equal to one. Finally,
 these scaled weighted average values were multiplied by the weights found in Table 20 to arrive at
 the final weights for player scoring (Tables 16-19).

 Table 10: Principal Component Selections by Statistical Category
 Player Statistic Data Number of Principal Cumulative Proportion of
 Components Selected Variance Explained

 Shooting 2 59.6%

 Passing 2 60.1%

 Defense 4 61.0%

 Goalkeeping 2 61.4%

 Table 11: Principal Components for Shooting Statistics
 Shooting Principal Component
 Statistic PC1 PC2
 Gls 0.303 0.435
 Standard Sh 0.369 -0.205
 Standard SoT 0.380 0.052
 Standard FK 0.080 -0.024
 Performance PK 0.081 -0.052
 Standard Sh/90 0.366 -0.206
 Standard SoT/90 0.373 0.039
 Performance PKatt 0.078 -0.017
 Expected xG 0.411 0.019
 Expected npxG 0.406 0.035
 Expected G-xG -0.024 0.599
 Expected np:G-xG -0.026 0.598
 Proportion of Variance Explained 38.37% 21.20%
19

 Table 12: Principal Components for Passing Statistics
 Passing Principal Component
 Statistic PC1 PC2
 Total Cmp 0.344 -0.022
 Total Att 0.342 0.008
 Total TotDist 0.340 -0.117
 Total PrgDist 0.271 -0.115
 Short Att 0.239 0.196
 Short Cmp 0.256 0.179
 Medium Cmp 0.309 -0.129
 Medium Att 0.314 -0.100
 Long Cmp 0.253 -0.182
 Long Att 0.232 -0.151
 Ast 0.017 0.393
 xA 0.018 0.423
 A-xA 0.008 0.213
 KP 0.046 0.392
 1/3 0.266 -0.007
 PPA 0.095 0.396
 CrsPA 0.050 0.293
 Prog 0.238 0.213
 Proportion of Variance Explained 44.15% 15.99%

 Table 13: Principal Components for Defense Statistics
 Defense Principal Component
 Statistic PC1 PC2 PC3 PC4
 Tackles Tkl 0.359 -0.233 0.052 -0.141
 Tackles TklW 0.313 -0.205 0.018 -0.261
 Tackles Def 3rd 0.313 -0.203 0.042 0.177
 Tackles Mid 3rd 0.250 -0.220 0.103 -0.224
 Tackles Att 3rd 0.108 0.036 -0.098 -0.417
 Tkl+Int 0.316 -0.250 -0.098 -0.083
 Pressures Press 0.269 0.401 0.014 -0.081
 Pressures Succ 0.254 0.303 0.025 -0.053
 Pressures Def 3rd 0.262 0.118 -0.271 0.088
 Pressures Mid 3rd 0.205 0.333 0.111 -0.144
 Pressures Att 3rd 0.103 0.393 0.169 -0.099
 Blocks Blocks 0.074 0.151 -0.553 0.005
 Blocks Sh -0.006 -0.014 -0.379 0.216
 Blocks ShSv 0.000 -0.027 -0.027 0.211
 Blocks Pass 0.095 0.195 -0.464 -0.114
 Vs Dribbles Tkl 0.305 -0.192 0.113 0.178
 Vs Dribbles Att 0.295 0.078 0.169 0.426
20

 Vs Dribbles Past 0.183 0.238 0.151 0.450
 Int 0.121 -0.147 -0.198 0.013
 Clr 0.029 -0.172 -0.274 0.267
 Err -0.030 -0.077 -0.079 0.107
 Proportion of Variance Explained 27.39% 13.96% 11.81% 7.88%

 Table 14: Principal Components for Goalkeeping Statistics
 Goalkeeping Principal Component
 Statistic PC1 PC2
 Playing Time MP 0.376 0.233
 Playing Time Starts 0.359 0.279
 Playing Time Min 0.367 0.258
 Playing Time 90s 0.369 0.251
 Performance GA -0.321 0.245
 Performance Saves -0.165 0.334
 W 0.307 -0.022
 D 0.108 0.037
 L -0.326 0.229
 Performance CS 0.177 -0.448
 Performance PKatt -0.160 0.387
 Penalty Kicks PKA 0.044 0.182
 Penalty Kicks PKsv -0.044 0.353
 Penalty Kicks PKm -0.236 0.065
 Proportion of Variance Explained 41.10% 20.34%
21

 Appendix B – Decision Trees
 Regression trees for each position (goalkeeper, defender, midfielder, and forward) were used to
 predict 2021 tournament places based on 2021 tournament player statistics. Calculated player
 statistics such as goals minus expected goals were not included in the trees. Variables that resulted
 in predicted tournament place closest to 1 were considered further for inclusion in the final player
 selection model. The selected variables for further consideration by position are shown in Table 15.

 Table 15: Decision Tree Variables
 Position Regression Tree Variables
 Goalkeeper L
 Defender Tackles Att 3rd, 1/3, Tackles Def 3rd,
 Pressures Def 3rd, Total Cmp
 Midfielder Medium Att, Tackles Att 3rd,
 Pressures Def 3rd, KP, Short Cmp
 Performance PK, Performance PKatt,
 Forward Total Cmp, Standard SoT
22

 Appendix C – Player Score Weights
 Principal Component Approach
 Table 16: PCA Shooting Statistical Weights by Position
 Weight for Position
 Statistic FW MF
 Gls 0.093 0.039
 Standard Sh 0.044 0.018
 Standard SoT 0.070 0.029
 Standard Sh/90 0.043 0.018
 Standard SoT/90 0.068 0.028
 Standard FK 0.011 0.005
 Performance PK 0.009 0.004
 Performance PKatt 0.012 0.005
 Expected xG 0.072 0.030
 Expected npxG 0.073 0.030
 Expected G-xG 0.053 0.022
 Expected np:G-xG 0.052 0.022

 Table 17: PCA Passing Statistical Weights by Position
 Weight for Position
 Statistic FW MF DF
 Total Cmp 0.031 0.039 0.019
 Total Att 0.032 0.040 0.020
 Total TotDist 0.028 0.034 0.017
 Total PrgDist 0.021 0.027 0.013
 Short Cmp 0.030 0.037 0.019
 Short Att 0.029 0.036 0.018
 Medium Cmp 0.024 0.030 0.015
 Medium Att 0.026 0.032 0.016
 Long Cmp 0.017 0.022 0.011
 Long Att 0.016 0.021 0.010
 Ast 0.015 0.018 0.009
 xA 0.016 0.020 0.010
 A-xA 0.008 0.010 0.005
 KP 0.017 0.022 0.011
 1/3 0.024 0.031 0.015
 PPA 0.022 0.028 0.014
 CrsPA 0.014 0.018 0.009
 Prog 0.029 0.036 0.018
23

 Table 18: PCA Defense Statistical Weights by Position
 Weight for Position
 Statistic MF DF
 Tackles Tkl 0.015 0.046
 Tackles TklW 0.010 0.029
 Tackles Def 3rd 0.019 0.058
 Tackles Mid 3rd 0.008 0.025
 Tackles Att 3rd -0.002 -0.007
 Vs Dribbles Tkl 0.021 0.064
 Vs Dribbles Att 0.037 0.111
 Vs Dribbles Past 0.035 0.104
 Pressures Press 0.032 0.095
 Pressures Succ 0.028 0.084
 Pressures Def 3rd 0.016 0.048
 Pressures Mid 3rd 0.027 0.080
 Pressures Att 3rd 0.024 0.073
 Blocks Blocks -0.006 -0.018
 Blocks Sh -0.008 -0.024
 Blocks ShSv 0.002 0.007
 Blocks Pass -0.003 -0.008
 Int -0.003 -0.008
 Tkl+Int 0.008 0.025
 Clr -0.007 -0.021
 Err -0.005 -0.015

 Table 19: PCA Goalkeeping Statistical Weights by Position
 Weight for Position
 Statistic GK
 Playing Time MP 0.242
 Playing Time Starts 0.244
 Playing Time Min 0.243
 Playing Time 90s 0.242
 Performance GA -0.098
 Performance Saves 0.000
 W 0.145
 D 0.062
 L -0.104
 Performance CS -0.022
 Performance PKatt 0.015
 Penalty Kicks PKA 0.066
 Penalty Kicks PKsv 0.064
 Penalty Kicks PKm -0.100
24

 Table 20: Statistical Weights for Computing Player Scores
 Weights for Position Shooting Passing Defense Goalkeeping
 FW 60% 40% 0% 0%
 MF 25% 50% 25% 0%
 DF 0% 25% 75% 0%
 GK 0% 0% 0% 100%

 Table 21: Player Selections from Principal Component Analysis
 Player Nation Position Age Final Score Role
 U. Shoko Rarita FW 24 1.16 Starter
 Z. Zziwa Rarita FW 23 1.26 Backup
 I. Shoshan Rarita FW 30 1.27 Reserve
 Q. Morrison Rarita MF 33 1.36 Starter
 X. Leroy Rarita MF 26 1.60 Starter
 P. Rabiu Rarita MFFW 27 1.12 Starter
 Z. Kakai Rarita MFDF 26 1.06 Starter
 J. Nurhayati Rarita MF 33 0.88 Starter
 P. Villa Rarita MFFW 20 0.65 Backup
 G. binti Salleh Rarita MFFW 26 1.16 Backup
 L. Leibowitz Rarita MF 22 0.56 Backup
 O. Wanjala Rarita MF 23 0.96 Backup
 S. Barman Rarita MF 24 0.89 Backup
 Y. Cheu Rarita MF 18 0.34 Reserve
 Z. Rajabi Rarita DF 30 1.35 Starter
 F. Acayo Rarita DF 24 1.18 Starter
 K. Musah Rarita DF 30 0.90 Starter
 S. Szabó Rarita DF 29 0.88 Starter
 N. Terzi? Rarita DF 22 1.02 Backup
 P. Murmu Rarita DF 22 1.00 Backup
 X. Takagi Rarita DF 23 1.14 Backup
 R. Tsao Rarita DF 26 1.11 Backup
 W. Nasiru Rarita GK 33 0.41 Starter
 F. Akumu Rarita GK 20 0.37 Backup
 F. Ithungu Rarita GK 28 0.33 Reserve

 Principal Component Verification: Decision Trees and Literature Review
 Approach
 Table 22: Decision Tree/Literature Review Shooting Statistical Weights by Position
 Weight for Position
 Statistic FW MF
 Gls 0.00 0.05
 Standard SoT 0.20 0.10
 Performance PK 0.10 0.00
25

 Expected npxG 0.25 0.00

 Table 23: Decision Tree/Literature Review Passing Statistical Weights by Position
 Weight for Position
 Statistic FW MF DF
 Total Cmp% 0.10 0.00 0.00
 Total PrgDist 0.15 0.20 0.25
 Short Cmp% 0.00 0.10 0.00
 Medium Cmp% 0.00 0.10 0.00
 KP 0.20 0.15 0.00

 Table 24: Decision Tree/Literature Review Defense Statistical Weights by Position
 Weight for Position
 Statistic MF DF
 Tackles Def 3rd 0.15 0.20
 Pressures % 0.00 0.25
 Int 0.05 0.15
 Err 0.10 0.15

 Table 25: Decision Tree/Literature Review Goalkeeping Statistical Weights by Position
 Weight for Position
 Statistic GK
 Performance GA90 0.15
 Performance Save% 0.55
 L 0.15
 Performance CS% 0.15

 Table 26: Decision Tree/Literature Review Player Selection
 Player Nation Position Age Final Score Role
 I. Saha Rarita FW 26 1.36 Starter
 U. Shoko Rarita FW 24 1.24 Backup
 Z. Zziwa Rarita FW 23 1.00 Reserve
 X. Leroy Rarita MF 26 2.70 Starter
 Q. Morrison Rarita MF 33 2.08 Starter
 O. Wanjala Rarita MF 23 1.68 Starter
 Z. Kakai Rarita MFDF 26 1.52 Starter
 J. Nurhayati Rarita MF 33 1.45 Starter
 S. Barman Rarita MF 24 1.45 Backup
 L. Leibowitz Rarita MF 22 1.24 Backup
 G. binti Salleh Rarita MFFW 26 1.18 Backup
 P. Rabiu Rarita MFFW 27 1.13 Backup
 P. Villa Rarita MFFW 20 0.95 Backup
 G. Jankowski Rarita MF 21 0.70 Reserve
 X. Takagi Rarita DF 23 1.39 Starter
26

 Z. Rajabi Rarita DF 30 0.47 Starter
 K. Musah Rarita DF 30 0.77 Starter
 F. Acayo Rarita DF 24 0.62 Starter
 P. Murmu Rarita DF 22 0.59 Backup
 N. Terzi? Rarita DF 22 0.49 Backup
 K. Nalwanga Rarita DF 21 0.80 Backup
 R. Tsao Rarita DF 26 0.42 Backup
 W. Nasiru Rarita GK 33 1.23 Starter
 F. Akumu Rarita GK 20 1.43 Backup
 F. Ithungu Rarita GK 28 1.24 Reserve
27

 Appendix D – Team Score and 2021
 Tournament Result
 PCA Team Score Rank is closer to the 2021 Tournament results.

 Table 27: PCA Team Score Rank and Tournament Rank Comparison
 Nation Team Score Team Score Rank 2021 Tournament Rank
 Sobianitedrucy 0.74 1 1
 People's Land of Maneau 0.58 3 2
 Nganion 0.68 2 3
 Mico 0.45 4 4
 Quewenia 0.28 6 5
 Southern Ristan 0.35 5 6
 Galamily 0.16 11 7
 Bernepamar 0.21 8 8
 Giumle Lizeibon 0.16 10 10
 Greri Landmoslands 0.18 9 11
 Xikong -0.17 14 12
 Manlisgamncent 0.07 13 13
 Esia 0.15 12 14
 Byasier Pujan 0.27 7 15
 Djipines -0.19 17 16
 Leoneku Guidisia -0.18 16 17
 Ledian -0.22 19 18
 Eastern Sleboube -0.39 23 19
 New Uwi -0.19 18 20
 Ngoque Blicri -0.25 20 21
 Nkasland Cronestan -0.17 15 22
 Eastern Niasland -0.28 21 23
 Varijitri Isles -0.34 22 24

 Table 28: Decision Tree/Literature Review Team Score Rank and Tournament Rank Comparison
 Nation Team Score Team Score Rank 2021 Tournament Rank
 Sobianitedrucy 0.36 2 1
 People's Land of Maneau 0.41 1 2
 Nganion 0.33 4 3
 Mico 0.23 7 4
 Quewenia 0.18 8 5
 Southern Ristan 0.35 3 6
 Galamily 0.14 12 7
 Bernepamar 0.08 14 8
 Giumle Lizeibon 0.17 10 10
28

 Greri Landmoslands 0.29 5 11
 Xikong 0.03 16 12
 Manlisgamncent 0.00 17 13
 Esia -0.15 22 14
 Byasier Pujan 0.28 6 15
 Djipines -0.02 18 16
 Leoneku Guidisia 0.18 9 17
 Ledian -0.11 21 18
 Eastern Sleboube -0.11 20 19
 New Uwi 0.07 15 20
 Ngoque Blicri 0.08 13 21
 Nkasland Cronestan -0.15 23 22
 Eastern Niasland -0.03 19 23
 Varijitri Isles 0.17 11 24
29

 Appendix E – Success Probabilities
 ACF computed success probabilities by comparing the team scores for tournament teams by
 position with Rarita team positional scores. Tournament team positional scores were taken from
 the previous analysis found in the Player Selection Process section and aggregated into final team
 scores using Equation 6. Since Rarita players did not have tournament playing time, Rarita
 positional scores were computed using Equation 8 for positions with starters, backups, and
 reserves or Equation 9 for positions with only starters and backups.

 Equation 8: Rarita Positional Score Calculation with Reserves
 = 0.75 ∗ +
 0.20 ∗ + 0.05 ∗

 Equation 9: Rarita Positional Score Calculation without Reserves
 = 0.75 ∗ + 0.25 ∗

 Rarita’s positional scores were then compared to the distribution of tournament team positional
 scores, and Rarita was assigned a theoretical rank based on this comparison (Table 29).

 Table 29: Average Positional Scores
 Position Rarita Score Average Score Rarita Rank
 FW 1.32 0.08 1
 MF 1.69 0.15 1
 DF 0.75 -0.05 1
 GK 1.27 0.18 5
 Total 1.25 0.09 1

 ACF assigned probabilities of success to each position based on the comparison. Finally, the
 probability of overall team success was computed (Equation 10).

 Equation 10: Rarita Team Probability of Success
 = 0.15 ∗ +
 0.30 ∗ + 0.30 ∗ +
 0.25 ∗

 Probability of success ranges are in Tables 30-31.

 Table 30: Probability Ranges of Finishing in the Top Ten within Five Years
 Probability of Success
 Position Lower Bound Upper Bound
 FW 75.0% 95.0%
 MF 75.0% 95.0%
 DF 75.0% 95.0%
 GK 65.0% 85.0%
30

 Total 72.5% 92.5%

 Table 31: Probability Ranges of Winning the FSA Championship within Ten Years
 Probability of Success
 Position Lower Bound Upper Bound
 FW 55.0% 75.0%
 MF 55.0% 75.0%
 DF 55.0% 75.0%
 GK 45.0% 65.0%
 Total 52.5% 72.5%
31

 Appendix F – Expenses, Revenues, and Profit
 ACF estimated player salaries using other national team salaries. The England Football Association
 pays players £2,000, or approximately $2,650. The United States Men’s National Team pays
 players $5,000 per match, and players on the United States Women’s National Team are paid
 between $3,250 and $4,500 per match. Based on this data, a per-match salary of $3,500 was
 assumed to be reasonable. This $3,500 per-match salary was exchanged to Doubloons using the
 Dollar to Euro 5-year average and the Euro to Doubloon 5-year average, resulting in the basic per-
 match salary of ∂3,453.03.

 With a 28-team bracket, a team will play four games, progressing to the tournament if they win
 three or four of the games. It was also assumed that the FSA will continue to include 24 teams in
 the tournament for the next ten years, so a team must win either four or five games to win the
 tournament based on what position they start in the beginning tournament bracket. The lower
 bound for matches per season was set at eight, since the team would play four friendlies and four
 matches in the qualifiers, but not progress to the tournament. The average number of matches was
 set at ten, since a team will play four friendlies, four qualifiers, and on average two tournament
 matches. The upper bound for matches was set at 13 since a winning team would play four
 friendlies, four qualifying matches, and up to five tournament matches.

 To scale variable expenses, it was assumed that leagues play 38 games per season. This scaling
 allows for the estimation of how expenses and revenues may change based on how well the team
 is performing. For example, a team which does not qualify for the tournament will only play eight
 games and perhaps not make as much revenue from merchandise sales; however, they may also
 not need to pay for training expenses since they are not moving forward in the tournament.

 Equation 11: Player Salaries Calculation
 ℎ ∗ . ∗ 5
 ∗ 5 ∗ . ℎ ( , , ) / 38

 To calculate the total Per Capita Other Expenses, ACF multiplied the 2016-2021 Per Capita Other
 Expenses by Rarita’s total population for each year. The average of these total other costs was then
 taken as the Total Other Costs.

 Equation 12: Fixed Other Expenses Calculation
 ℎ ∗ 0.80

 Equation 13: Variable Other Expenses Calculation
 ℎ ∗ 0.20 ∗ . ℎ ( , , ) / 38

 ACF found data on the USSF’s expenses, which indicated that management expenses are
 $32,217,650 per year and the board of directors’ and committees’ expenses are $458,288 per
 year.

 Equation 14: Staff Costs
 +
32

 Equation 15: Fixed Staff Costs
 ∗ 5 ∗ 5 ∗ 0.50

 Equation 16: Variable Staff Costs
 ∗ 5 ∗ 5 ∗ 0.50
 ∗ . ℎ ( , , ) / 38

 The Per Capita Total Revenue from 2016-2021 was multiplied by each year’s population for a yearly
 total revenue. These yearly total revenues were averaged, resulting in the Average Total Revenue.
 Broadcast and commercial revenues were found to be on average 83% of each year’s total revenue.

 Equation 17: Fixed Revenues
 ∗ 0.83 ∗ 0.20

 Equation 18: Variable Revenues
 ∗ 0.83 ∗ 0.80 ∗ . ℎ ( , , ) / 38

 Table 32: Expected Seasonal Expenses and Revenues by Category
 Per Season Expenses Lower Bound Average Upper Bound
 Player Salaries 690,606 863,258 1,122,235
 Fixed Staff Costs 16,118,713 16,118,713 16,118,713
 Variable Staff Costs 3,393,413 4,241,767 5,514,297
 Fixed Other Expenses 450,694,187 450,694,187 450,694,187
 Variable Other Expenses 23,720,747 29,650,933 38,546,213
 Total Expenses 494,617,667 501,568,858 511,995,645
 Fixed Revenues 336,670,026 336,670,026 336,670,026
 Variable Revenues 283,511,601 354,389,502 460,706,352
 Total Revenues 620,181,628 691,059,528 797,376,379
 Per Season Profit 125,563,962 189,490,670 285,380,734
33

 Appendix G– Financial Projections
 Table 33: Projected Spot Rates
 Spot Rates
 Lower Projected Upper
 Maturity Quartile 1/1/2022 Quartile
 1 0.33% 0.72% 1.40%
 2 0.68% 1.31% 1.85%
 3 1.25% 1.71% 2.18%
 4 1.85% 2.04% 2.68%
 5 2.05% 2.55% 3.19%
 6 2.15% 3.09% 3.82%
 7 2.27% 3.43% 3.88%
 8 2.60% 3.69% 4.03%
 9 2.91% 3.83% 4.15%
 10 3.07% 3.91% 4.42%
34

 Appendix H– GDP
 The total population was projected for 2021-2032 by applying a five-year moving average (Figure 7
 and Table 34).

 Figure 7: Rarita Population Projection
 Rarita Population Projection
 12,700,000
 12,600,000
 12,500,000
 12,400,000
 12,300,000
 12,200,000
 12,100,000
 12,000,000
 11,900,000
 11,800,000

 Rarita 5-year Moving Average

 Table 34: Rarita Regional Population Estimates
 Population Estimate
 Year East Rarita Central Rarita West Rarita Rarita
 2021 1,926,336 3,024,192 7,543,127 12,493,655
 2022 1,931,678 3,027,403 7,559,736 12,518,817
 2023 1,934,416 3,028,755 7,569,513 12,532,683
 2024 1,933,911 3,025,135 7,569,611 12,528,657
 2025 1,931,585 3,026,371 7,560,497 12,518,453
 2026 1,932,898 3,026,916 7,564,839 12,524,652
 2027 1,933,202 3,026,794 7,566,115 12,526,111
 2028 1,932,899 3,026,304 7,565,265 12,524,468
 2029 1,932,646 3,026,596 7,564,179 12,523,421
 2030 1,932,911 3,026,653 7,565,099 12,524,663
 2031 1,932,915 3,026,587 7,565,165 12,524,666
 2032 1,932,843 3,026,535 7,564,927 12,524,305

 Table 35: Rarita GDP per capita Impact
 GDP Impact
 Year Lower Bound Average Upper Bound
 2023 10.34 15.61 23.51
 2024 10.81 16.31 24.56
35

 2025 11.37 17.15 25.83
 2026 12.00 18.10 27.26
 2027 12.86 19.41 29.23
 2028 13.95 21.06 31.71
 2029 15.10 22.78 34.31
 2030 16.33 24.64 37.11
 2031 17.56 26.49 39.90
 2032 18.83 28.42 42.80
36

 Appendix I– R code: PCA
 #Required Packages
 require(readxl)
 require(tidyverse)
 require(corrplot)
 require(analogue)

 #Import Data
 path = "C:/Users/lilyg/OneDrive/Spring 2022/SOA Case Study/"

 shooting
37

 `Expected xG`= as.numeric(`Expected xG`),
 `Expected npxG` = as.numeric(`Expected npxG`),
 `Expected npxG/Sh` = as.numeric(`Expected npxG/Sh`),
 `Expected G-xG` = as.numeric(`Expected G-xG`),
 `Expected np:G-xG` = as.numeric(`Expected np:G-xG`))

 passing % mutate(Nation = as.factor(Nation),
 Pos = as.factor(Pos),
 Age = as.factor(Age),
 Year = as.factor(Year))

 defense % mutate(Nation = as.factor(Nation),
 Pos = as.factor(Pos),
 Age = as.factor(Age),
 Year = as.factor(Year))

 goalkeep % mutate(Nation = as.factor(Nation),
 Pos = as.factor(Pos),
 Age = as.factor(Age),
 Year = as.factor(Year))

 results % mutate(Year = as.factor(Year),
 Place = as.factor(Place),
 Country = as.factor(Country))

 shooting.l % mutate(Nation = as.factor(Nation),
 Pos = as.factor(Pos),
 Age = as.factor(Age),
 Born = as.factor(Born),
 Year = as.factor(Year),
 `Standard Dist` = as.numeric(`Standard Dist`),
 `Standard FK` = as.numeric(`Standard FK`),
 `Expected xG`= as.numeric(`Expected xG`),
 `Expected npxG` = as.numeric(`Expected npxG`),
 `Expected npxG/Sh` = as.numeric(`Expected npxG/Sh`),
 `Expected G-xG` = as.numeric(`Expected G-xG`),
 `Expected np:G-xG` = as.numeric(`Expected np:G-xG`))

 passing.l % mutate(Nation = as.factor(Nation),
 Pos = as.factor(Pos),
 Age = as.factor(Age),
 Year = as.factor(Year))

 defense.l % mutate(Nation = as.factor(Nation),
 Pos = as.factor(Pos),
 Age = as.factor(Age),
 Year = as.factor(Year))

 goalkeep.l % mutate(Nation = as.factor(Nation),
 Pos = as.factor(Pos),
 Age = as.factor(Age),
 Year = as.factor(Year))
38

 salary.2020 % mutate(Player = as.factor(`Player Name`),
 Squad = as.factor(Squad),
 League = as.factor(League),
 Country = as.factor(Country),
 Position = as.factor(Position))

 salary.2021 % mutate(Player = as.factor(`Player Name`),
 Squad = as.factor(Squad),
 League = as.factor(League),
 Country = as.factor(Country),
 Position = as.factor(Position))

 results % rename(Nation = Country)
 results.2020 % filter(Year == 2020)
 results.2021 % filter(Year == 2021)

 shooting.2020 % filter(Year == 2020)
 shooting.2021 % filter(Year == 2021)

 goalkeep.2020 % filter(Year == 2020)
 goalkeep.2021 % filter(Year == 2021)

 shooting.l.2020 % filter(Year == 2020)
 shooting.l.2021 % filter(Year == 2021)

 defense.l.2020 % filter(Year == 2020)
 defense.l.2021 % filter(Year == 2021)

 passing.l.2020 % filter(Year == 2020)
 passing.l.2021 % filter(Year == 2021)

 goalkeep.l.2020 % filter(Year == 2020)
 goalkeep.l.2021% filter(Year == 2021)

 #Data Joins
 defense.2021.r
39

 `Performance PKatt`,
 `Expected xG`, `Expected npxG`,
 `Expected G-xG`, `Expected np:G-xG`)
 shoot.pca.r
40

 pass.pcs
41

 pr.var.gk
42

 Appendix J – R code: Decision Trees
 # Required Packages
 require(readxl)
 require(tidyverse)
 require(ggplot2)
 require(tree)

 # Import Data
 path = "C:/Users/h1562/Documents/spring 2022/ACT 551/soa case study"

 shooting
43

 Age = as.numeric(Age),
 Year = as.factor(Year))

 results % mutate(Year = as.factor(Year),
 Place = as.numeric(Place),
 Country = as.factor(Country))%>% rename(Nation = Country)

 #Joining Tournament Results
 shooting % rename(x90s='90s', Total_cmp='Total Cmp',total_att= 'Total
 Att', total_totdist='Total TotDist', total_prgdist='Total PrgDist', short_cmp='Short Cmp',short_att= 'Short
 Att',medium_cmp= 'Medium Cmp',medium_att= 'Medium Att', long_cmp='Long Cmp',long_att= 'Long Att',
 onethird='1/3')

 defense_s % filter(Year==2021) %>% select(Place, Player, Pos, Age,'90s','Tackles
 Tkl','Tackles TklW','Tackles Def 3rd','Tackles Mid 3rd','Tackles Att 3rd','Vs Dribbles Tkl','Vs Dribbles Att','Vs
 Dribbles Past','Pressures Press','Pressures Succ','Pressures Def 3rd','Pressures Mid 3rd','Pressures Att
 3rd','Blocks Blocks','Blocks Sh','Blocks ShSv','Blocks Pass',Int,'Tkl+Int',Clr,Err) %>%
 rename(x90s='90s',tackles_tkl='Tackles Tkl',tackles_tklw='Tackles TklW',tackles_def_3rd='Tackles Def
 3rd',takles_mid_3rd='Tackles Mid 3rd',tackles_att_3rd='Tackles Att 3rd',vs_dribbles_tkl='Vs Dribbles
 Tkl',vs_dribbles_att='Vs Dribbles Att',vs_dribbles_past='Vs Dribbles Past',pressures_press='Pressures
 Press',pressures_succ='Pressures Succ',pressures_def_3rd='Pressures Def
 3rd',pressures_mid_3rd='Pressures Mid 3rd',pressures_att_3rd='Pressures Att 3rd',blocks_blocks='Blocks
 Blocks',blocks_sh='Blocks Sh',blocks_shsv='Blocks ShSv',blocks_pass='Blocks Pass',tkl_int='Tkl+Int')

 goalkeep_s % filter(Year==2021) %>% select(Place, Player, Pos, Age,'Playing Time
 MP','Playing Time Starts','Playing Time Min','Playing Time 90s','Performance GA','Performance
 GA90','Performance SoTA','Performance Saves',W,D,L,'Performance CS','Performance PKatt','Penalty Kicks
 PKA','Penalty Kicks PKsv','Penalty Kicks PKm') %>% rename(playing_time_mp='Playing Time
 MP',playing_time_starts='Playing Time Starts',playing_time_min='Playing Time
 Min',playing_time_90s='Playing Time 90s',performance_ga='Performance
 GA',performance_ga90='Performance GA90',performance_sota='Performance
44

 SoTA',performanec_saves='Performance Saves',performance_cs='Performance
 CS',performance_pkatt='Performance PKatt',penalty_kicks_pka='Penalty Kicks
 PKA',penalty_kicks_pksv='Penalty Kicks PKsv',penalty_kicks_pkm='Penalty Kicks PKm')

 # Goalkeepers, considering goalkeeping and passing skills
 set.seed(551)
 passing_s_gk % filter(Pos=="GK")

 gk % rename(Age = Age.x, Place = Place.x)

 train.gk
45

 #Midfielders, considering passing and defense since most midfielders are missing shooting data
 set.seed(551)
 defense_s_mid % filter(Pos %in% c("MF","MFDF","MFFW","FWMF","DFMF"))
 passing_s_mid % filter(Pos %in% c("MF","MFDF","MFFW","FWMF","DFMF"))

 mid % rename(Age = Age.x,
 Place = Place.x)

 train.mid
46 abline(0,1) mean((att.pred-att.test)^2)
47

 References
 “2022 Student Research Case Study Challenge.” SOA,
 https://www.soa.org/research/opportunities/2022-student-research-case-study-challenge/.

 BBC News. “Ethical Factors in Sports.” BBC News, BBC,
 https://www.bbc.co.uk/bitesize/guides/zwcb9qt/revision/2.

 Bradley, Paul S., et al. "The effect of playing formation on high-intensity running and technical
 profiles in English FA Premier League soccer matches." Journal of sports sciences 29.8
 (2011): 821-830.

 Brownell, Peter. “The Most Important New Advanced Soccer Statistics and Why They Matter.”
 Bleacher Report, Bleacher Report, 9 Apr. 2013,
 https://bleacherreport.com/articles/1597790-the-most-important-new-advanced-soccer-
 statistics-and-why-they-matter.

 Chandler, Matthew. “How Much Do International Players Get Paid?” Sports Quotes and Facts,
 https://sqaf.club/how-much-do-international-players-get-paid/.

 Eliakim, Eyal, et al. "Estimation of injury costs: financial damage of English Premier League teams’
 underachievement due to injuries." BMJ Open Sport & Exercise Medicine 6.1 (2020):
 e000675.

 Hägglund, Martin, et al. "Injuries affect team performance negatively in professional football: an
 11-year follow-up of the UEFA Champions League injury study." British journal of sports
 medicine 47.12 (2013): 738-742.

 Junge, Astrid, and Jiri Dvořák. "Football injuries during the 2014 FIFA World Cup." British Journal of
 Sports Medicine 49.9 (2015): 599-602.

 Murray, Caitlin. “USWNT, USMNT pay gap explained: Comparing their U.S. Soccer contracts as
 both sides negotiate new CBAs.” ESPN, 10 Feb. 2022.,
 https://www.espn.com/soccer/united-states-usaw/story/4589310/uswntusmnt-pay-gap-
 explained-comparing-their-us-soccer-contracts-as-both-sides-negotiate-new-cbas.

 Parkin, Simon. "The rise of Russia’s neo-Nazi football hooligans." The Guardian 24 (2018).

 Politics.co.uk. “Football Hooliganism - All You Need to Know.” Politics.co.uk, 18 June 2021,
 https://www.politics.co.uk/reference/football-hooliganism/.

 Sadigursky, David, et al. "The FIFA 11+ injury prevention program for soccer players: a systematic
 review." BMC sports science, medicine and rehabilitation 9.1 (2017): 1-8.

 Sadler, John M. “Implementing a Risk Management Program for Sports Organizations.” Sadler
 Sports & Recreation Insurance, Apr. 2019,
 https://www.sadlersports.com/implementing-risk-management-program-sports-
 organizations/.
48

 Thompson, Mark. “The 5 Key Football Metrics to Know about in 2021.” Twenty3, 28 Jan. 2021,
 https://www.twenty3.sport/data-analytics-5-key-football-metrics-to-know-about-in-2021/.

 United States Soccer Federation. Consolidated Financial Statements and Report of Independent
 Certified Public Accountants, March 31 2021. Web. March 22, 2021.
You can also read