Autotech Seminar October 6, 2021
←
→
Page content transcription
If your browser does not render page correctly, please read the page content below

Autotech Seminar
                                     October 6, 2021

REDEYE AUTOTECH SEMINAR - 2021
                                                       1
w

AGENDA AUTOTECH SEMINAR 2021

    09:00        Introduction Redeye – Erik Rolander, Corporate Advisory

    09:03        Redeye Autotech Report – Jesper Henrikson Equity Research

                 Block 1 Electrification

    09:10        Polestar – Dennis Nobelius, COO

    09:20        Garo – Patrik Andersson, CEO

    09:30        Zaptec – Anders Thingbø, CEO

    09:40        ChargeNode – Kristian Sandahl, CEO

    09:50        Charge Amps – Anders Bergtoft, CEO

    10:00        Paneldiscussions

    10:25        Pause

                 Block 2 Autonomous Driving

    10:35        Klimator – Rebecca Lewis-Lück, COO

    10:45        Terranet – Pär-Olof Johannesson, CEO

    10:55        Gapwaves – Lars-Inge Sjöqvist, CEO

    11:05        Paneldiscussions

                 Block 3 Driver monitoring and safety

    11:25        Smarteye – Martin Krantz CEO, Anders Lyrheden CFO

    11:35        Acconeer – Lars Lindell, CEO

    11:45 - 12:00 Paneldiscussions

                                                                             REDEYE AUTOTECH SEMINAR - 2021
2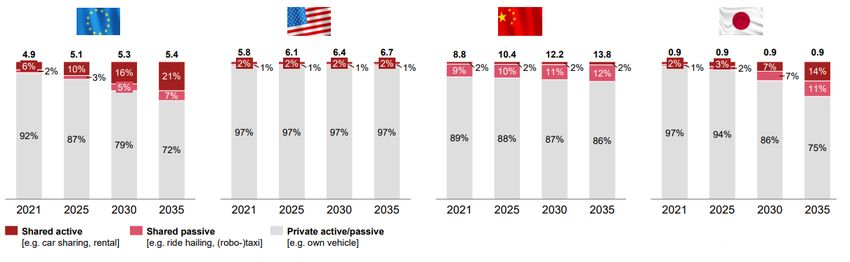
w

                                                                                                               THE REDEYE TECHNOLOGY TEAM

                                     Erik Kramming
                                     Client Manager & Head of Technology
                                     Erik has a Master of Science in finance from Stockholm University. His previous work has included a position
                                     at Handelsbanken Capital Markets. At Redeye, Erik works with Corporate Broking for the Technology team.

                                     Greger Johansson
                                     Client Manager & Co-head Technology
                                     Greger has a background from the telecom industry, both from large companies as well as from entrepreneurial
                                     companies in Sweden (Telia and Ericsson) and USA (Metricom). He also spent 15+ years in investment banking
                                     (Nordea and Redeye). Furthermore, at Redeye Greger advise growth companies within the technology sector
                                     on financing, equity storytelling and getting the right shareholders/investors (Corporate Broking). Coder for two
                                     published C64-games. M.Sc.EE and M.Sc.Econ.

                                     Johan Ekström
                                     Client Manager
                                     Johan has a Master of Science in finance from the Stockholm School of Economics, and has studied e-com-
                                     merce and marketing at the MBA Haas School of Business, University of California, Berkeley. Johan has worked
                                     as an equity portfolio manager at Alfa Bank and Gazprombank in Moscow, as a hedge fund manager at EME
                                     Partners, and as an analyst and portfolio manager at Swedbank Robur. At Redeye, Johan works in the Corporate
                                     Broking team with fundamental analysis and advisory in the tech sector.

                                     Erik Rolander
                                     Client Manager
                                     Erik has a Master’s degree in finance from Linköpings Universitet. He has previously worked at Remium as a
                                     tech analyst and product manager for the equity research platform Introduce.se, which today is owned by ABG
                                     Sundal Collier. At Redeye, Erik works with Corporate Broking for the Technology team.

                                     Niklas Blumenthal
                                     Client Manager
                                     Niklas has studied business administration at Uppsala University and has over 20 years of experience in the
                                     financial market. He has previously worked as client manager at Nordnet, CMC Markets, Remium and ABG
                                     Sundal Collier. At Redeye, Niklas works with Corporate Broking in both Technology and Life Science teams.

                                     Gustav Olin Månsson
                                     Client Manager
                                     Gustav has a Master’s degree in business administration from Karlstad University. He has previously
                                     worked at PwC as an auditor towards listed entities. At Redeye, Gustav works with Corporate Broking for
                                     the Technology team.

    REDEYE AUTOTECH SEMINAR - 2021
                                                                                                                                                         3
THE REDEYE TECHNOLOGY TEAM
Tomas Otterbeck
Head of Research
Tomas gained a Master’s degree in Business and Economics at Stockholm University. He also studied
Computing and Systems Science at the KTH Royal Institute of Technology. Tomas was previously responsible
for Redeye’s website for six years, during which time he developed its blog and community and was editor of its
digital stock exchange journal, Trends. Tomas also worked as a Business Intelligence consultant for over two
years.
Henrik Alveskog
Analyst
Henrik has an MBA from Stockholm University. He started his career in the industry in the mid-1990s.
After working for a couple of investment banks he came to Redeye, where he has celebrated 10 years
as an analyst.
Mattias Ehrenborg
Analyst
Mattias is an equity analyst within Redeye’s technology team, focusing on the renewable energy & cleantech
sector. He holds a BSc in Business and Economics from Uppsala University. Mattias has previously worked at
ABG Sundal Collier as a part of the Capital Goods team, primarily focusing on the renewable energy & cleantech
sector.
Douglas Forsling
Analyst
Douglas is an equity analyst in the technology team with a focus on the online gambling sector and fintech sec-
tor. He holds a Bachelor’s degree in finance and an unfinished Master’s degree in Operational Management and
Control from Stockholm University, School of Business. In addition, he has studied abroad in Hong Kong, Beijing,
and Oxford. He has had positions in SEB, Nordic Capital, and Danone. He has also produced a finance podcast
for nearly two years.
Forbes Goldman
Analyst
Forbes is an equity analyst within the technology team at Redeye. He holds a BSc in Business and
Economics from the Stockholm School of Economics and has also completed an academic exchange
semester in Mexico City.
Jesper Henrikson
Analyst
Jesper is an equity analyst in the technology team with a focus on telecom, automotive tech and more. He
holds a Master’s degree in Industrial Engineering and Management from Lund University, institute of technol-
ogy. In addition, he has studied abroad in Madrid. He has previously worked as an entrepreneur, management
consultant and business development manager at a B2B SaaS company. He has also run a stock-research blog
for nearly five years.
Mats Hyttinge
Analyst
Mats is an equity analyst in the technology & life science team at Redeye. He has an MBA and Bachelor degree
in Finance from USE in Monaco.
REDEYE AUTOTECH SEMINAR - 2021
4THE REDEYE TECHNOLOGY TEAM
Fredrik Nilsson
Analyst
Fredrik is an equity analyst within Redeye’s technology team. He has an MSc in Finance from
University of Gothenburg and has previously worked as a tech-focused equity analyst at Remium.
Mark Siöstedt
Analyst
Mark has a Master’s degree in Accounting and Finance from Lund University. He has a dual role within
Redeye as an editor (quality assurance and Top Picks) and as an equity analyst on the technology team.
Danesh Zare
Analyst
Danesh has a Master’s degree in mechanical engineering from the Royal Institute of Technology. He has
previously worked as a Calculation Engineer for more than 6 years, holding positions at both Scania and Volvo
Trucks. He also produced a finance podcast for nearly two years. Danesh joined Redeye in 2020 and works as
an equity research analyst, covering companies in the tech-sector, with a focus on gaming companies
Niklas Sävås
Analyst
Niklas has more than ten years experience from the financial industry working within banking and financial
technology. He started his first company in 2016 focused on consultancy and investments. Niklas has a dual
role within Redeye where he splits his time between the podcast Investing By The Books, Redeye Academy and
as an analyst on the technology team. He has a bachelor degree in Business and Economics from SLU.
Hjalmar Ahlberg
Analyst
Hjalmar is an equity analyst within the technology team focusing on gaming and online gambling sectors.
He holds a Master’s degree in finance and has previously worked within the banking industry with focus on
equity research covering various sectors.
Jacob Svensson
Analyst
Jacob Svensson is an equity analyst within the technology team, focusing on software companies. He holds
a BSc in Business Administration and a Master’s in Finance from Lund University and has previously worked
within the banking industry and asset management.
Viktor Lindström
Analyst
Viktor is an equity analyst in the technology team, focusing on gaming and cleantech sectors. He holds a
Master’s degree in Finance from University of Gothenburg. Previously, he held positions at Carnegie Investment
Bank and Consensus Asset Management.
REDEYE AUTOTECH SEMINAR - 2021
5Technology Selected Transactions
REDEYE AUTOTECH SEMINAR - 2021
6TECHNOLOGY SELECTED TRANSACTIONS
RECENT
FEBRUARY 2021 FEBRUARY 2021 FEBRUARY 2021 MAY 2021 FEBRUARY 2021
IPO Private Placement Private Placement IPO Private Placement
Selling Agent SEK 40m SEK 30m SEK 60m 53 MSEK
SEK 201m
2017–2020
DECEMBER 2020
Private Placement
52 MSEK
NOVEMBER 2020 OCTOBER 2020 OCTOBER 2020 OCTOBER 2020 MARCH 2020
Directed Issue + Rights Issue Rights Issue Directed Issue Rights Issue Rights Issue
204 MSEK 50 MSEK 66 MSEK 57 MSEK 36 MSEK
DECEMBER 2019 NOVEMBER 2019 OCTOBER 2019 JUNE 2019 MAY 2019
Pre-IPO IPO Rights Issue Rights Issue Directed Issue + Rights Issue
18 MSEK 26 MSEK 51 MSEK 40 MSEK 139 MSEK
MAY 2019 APRIL 2019 APRIL 2019 MARCH 2019 JANUARY 2019
Rights Issue Dual Listing Rights Issue IPO IPO
Co-Lead Manager 10 MSEK 102 MSEK 80 MSEK Joint Bookrunner
135 MSEK 120 MSEK
NOVEMBER 2018 OCTOBER 2018 OCTOBER 2018 OCTOBER 2018 JUNE 2018
Rights Issue Direced Issue Directed Issue Right Issue Private Placement
25 MSEK 43 MSEK 21 MSEK 39 MSEK 108 MSEK
JUNE 2018 JUNE 2018 MAY 2018 APRIL 2018 FEBRUARY 2018
Rights Issue Private Placement IPO Private Placement Private Placement
Join Lead Manager 50 MSEK 30 MSEK 20 MSEK 20 MSEK
127 MSEK
NOVEMBER 2017 NOVEMBER 2017 NOVEMBER 2017 OCTOBER 2017 APRIL 2017
IPO IPO Private Placement 22 MSEK IPO
60 MSEK 180 MSEK 9 MSEK 60 MSEK
REDEYE AUTOTECH SEMINAR - 2021
7Table of content
Key drivers 9
Transactions in the sector 14
Valuation metrics 16
Share performance 17
Covered Companies 16
– Acconeer
– Gapwaves
– Smart Eye
REDEYE AUTOTECH SEMINAR - 2021
8KEY DRIVERS
The automotive market is currently in a tech revolution that has barely started. Most notably, the cars of
the future will be electrified, autonomous, connected, smart and shared, as we will elaborate in the different
sections below.
Environmentally friendly electric cars Europe leading the way for new
All major car OEMs have an electric vehicle strategy and most EV registrations – USA lagging
of them are looking to go fully electric. The installed base of In Europe, EV sales exploded in 2020. In 2019, only 3% of
electric vehicles is expected to exceed 100 million vehicles cars sold in Europe was electric – in 2020 this figure incre-
around 2029, as indicated in the graph below. ased to 10%. Overall Europe’s car market contracted 22% in
2020. Yet, new electric car registrations more than doubled
Expected installed base for 2030 has to 1.4 million.
increased by 10% in two years
The estimated total installed base of electric vehicles (EVs) in China was previously the leader in share of electric vehicles
2030 is 140 million vehicles. This is a 10% increase in estima- sold, amounting to 5% already in 2018. Since then, China’s
tes from 2019. growth of EVs has stagnated and the share of EVs amounted
to 6% in 2020. The US market is clearly lagging both China
and Europe. The share of new vehicles being electric has
been steady at 2% since 2018.
Expected installed base of electric vehicles (million vehicles) Electric car registrations per region, 2015-2020
150 1500
1200
120
Thousands
900
90
600
60
300
30 0
Europe USA China Others
0 2015 2016 2017 2018 2019 2020
2020 2021 2022 2023 2024 2025 2026 2027 2028 2029 2030
Source: IEA, Redeye Research
Source: IEA, Redeye Research
REDEYE AUTOTECH SEMINAR - 2021
9KEY DRIVERS
Smart connected cars Sharing economy & ridesharing
Cars are becoming connected “computers on wheels” as they Owning a car will be less common in the future. Instead, cars
get equipped with internet access/W-LAN, allowing cars to will be shared and rented as a service. The market for so
communicate and share information with each other. This called ride-hailing services (platforms connecting passengers
opens endless opportunities for personalization, IoT and with private drivers) is growing rapidly, albeit with a small dip
driver-car-interaction. One example is controlling household in 2020 due to Covid-19. One good illustration of this trend is
electronics from the car, e.g., closing windows, the fridge the vertical takeoff in the number of Uber rides. Uber reached
telling the car that it is out of milk and much, much more. 10 billion trips in 2018 and 23 billion trips by the end of 2020.
The global connected car market is expected to be worth At the peak, before Covid-19 struck, almost 21 million Uber
over USD 200 bn in 2025, as indicated in the graph below: rides were made each day.
Global connected car market (USD bn)
250
200
150
100
50
0
2017 2018 2019 2020 2021 2022 2023 2024 2025
Source: Redeye Research, various industry sources
Uber: Number of trips (billion)
25
20
15
10
5
0
2012 2013 2014 2015 2016 2017 2018 2019 2020
Trips per year Accumulated
Source: Uber, Redeye Research
REDEYE AUTOTECH SEMINAR - 2021
10KEY DRIVERS
Preference towards shared mobility still varies across the Looking into expectations for 2035, Europe and Japan are
major markets; EU/Japan expected to lead by 2035 expected to travel one out of four kilometers through shared
Today, China and Europe are far ahead of USA and Japan mobility, while China will only grow to 14% while USA expec-
in shared mobility. While China and Europe have market ted to remain at 3%.
penetration of shared mobility of 11% and 8% respectively,
Japan and USA are both only at 3%.
Market penetration by mobility mode (in ‘000 trillion person-kilometer scaled to %)
Source: PwC, Autofacts, Strategy&
REDEYE AUTOTECH SEMINAR - 2021
11KEY DRIVERS
(Semi)-autonomous cars & driver assistance Safety-standard organizations mandating more
All car OEMs are investing in autonomous car technologies, technology to enable higher grade of autonomy
although the 100% autonomous cars will arrive later than As for the safety implications, safety-standard organizations
OEMs previously expected. The investments are related to worldwide are continuously mandating more technology to
many different areas. Various sensors are needed for the car decrease the 1.2 million road fatalities and 50 million traffic
to detect what is going in its surroundings. Artificial Intelligen- injuries that occur every year. About 94 percent of these car
ce (AI) then helps the cars to understand this information and crashes are related to human error, which drives the need for
make adequate maneuvers. Advanced Driver-Assistance Systems (ADAS), i.e. technology
that helps the driver in the driving process. Like self-driving
Some of the OEMs are moving directly to level 4 (high auto- cars, ADAS also require an increasing number of sensors
mation) where the car drives by itself almost the whole time. and AI.
Others believe it is important to first develop semi-autono-
mous level 2+ or level 3 (conditional automation) cars where
the driver is expected to intervene from time to time. Regard-
less which one of these approaches the car OEMs prefer, the
whole car industry has agreed on the long-term importance
of moving towards autonomous cars due to e.g. higher safety
and lower transportation costs.
REDEYE AUTOTECH SEMINAR - 2021
12KEY DRIVERS
2021 has seen first ever deployments of L3 and L4 Trust towards autonomous cars is declining – driven by
– but above 20% share expected only after 2030 worries of cybersecurity threats and recent accidents
In 2021, Honda became the first carmaker to sell a vehic- According to the Digital Auto Report 2021 by Strategy&, trust
le equipped with certified level 3 self-driving technology. towards autonomous cars is declining in several important
Though we already have the first L3 cars on the roads, it markets. In a consumer survey, people in Germany, USA and
will take time before penetration becomes relevant. In 2030, China answered on whether they personally would use a fully
Europe is estimated to reach 29% of L3 or higher of new autonomous car. The share of consumers saying they would
vehicles sold. The same figure for the USA is 16%, 34% for not use an autonomous car increased to 62% in Germany
China, and 29% for Japan. Fully automated cars, i.e., level 5, (36% previous year), 64% in the USA (36% previous year), and
are expected to arrive in 2035, but only at a modest 1% share 14% in China (9% previous year). Trust is however increasing
of all new cars sold. All this according to PwC Autofacts and in Japan, with 28% saying no vs 37% last year.
Strategy&.
The global semi-autonomous vehicle market demand was
valued at 14.2 million units in 2020. NVIDIA estimates that in “In general, willingness to use fully automated cars
2025, there will be 40 million semi-autonomous vehicles, of has declined, especially in Germany and the US.
which 6/7 with Level 2, and the remaining 1/7 of Level 3 or 4. Trust in automated driving is seen as susceptible
Grandviewresearch.com estimates the market to expand to to change, and consumer attitudes might fluctuate
60 million units in 2028. Nvidia also estimates that there will rapidly as critical headlines emerge, e.g. following
be only 1 million Robotaxis in 2025. accidents and cybersecurity threats.”
Addressable market of semi-autonomous vehicles by 2025 (million vehicles)
40
35
30
25
20
15
10
5
0
L2+ (incl. Autopilot) L3/L4 Robotaxis
Source: NVIDIA
REDEYE AUTOTECH SEMINAR - 2021
13TRANSACTIONS IN THE SECTOR
M&A – slightly fewer deals and lowest Looking at the chart below, it is noteworthy that the valua-
multiples since 2015 tions of the deals in 2H 2020 were the lowest since 2015
About 90 M&A transactions were completed in 2020 and the -especially when looking at EBITDA multiples. After three
deal flow has continued in 2021. The largest acquisition of years of EBITDA multiples ranging between 13 and 17, it was
2021 is the ongoing acquisition of Veoneer, which has recei- down at 10 in 2H’20, a level which was normal in 2014-1016.
ved bids from both Magna and Qualcomm. The latest bid is Sales multiples have remained rather constant, hovering
from Qualcomm and amounts to USD 4.6 bn. between 1.7–2.1 the last five years, except for two outliers
in 1H’17 and 2H’18.
Total number of deals & valuation multiples in Autotech, 2014-2020
70 35
60 30
50 25
Valuation multiples
Number of deals
15,5 17,2
40 15,5 15,5 20
13,4
13,4
11,2 17,2
30 11,0 15
9,6 9,6 10,4
9,6
8,2
20 10
4,7
10 3,1 5
1,3 1,4 2,1 2,1 2,1 2,1 2,1 2,0 1,7 1,8 2,1 1,8
0 0
1H 2H 1H 2H 1H 2H 1H 2H 1H 2H 1H 2H 1H 2H
2014 2015 2016 2017 2018 2019 2020
Transaction count Trailing 30-month median EV/S Trailing 30-month median EV/EBITDA
Source: Hampleton Partners
REDEYE AUTOTECH SEMINAR - 2021
14TRANSACTIONS IN THE SECTOR
Below is a list of some of the largest deals of the past five years:
Major M&A deals 2016-2021
Target Acquirer Price (bn USD) EV/Sales multiple
Mobileye Intel 15,3 39x
Harman Samsung 8,0 1x
Wabco ZF 7,4 2x
Veoneer Qualcomm/Magna 4,6 2x
Plus BlackRock, Hennessy, DeShaw 3,3
Careem Uber 3,1
BCA Marketplace BBD Bidco 2,4 1x
Fleetmatics Verizon 2,4 6x
Yinlong Gree 1,9
Wallbox Kensington (SPAC) 1,5 30x
SAFT Total 1,1 1x
99 Taxis DiDi 1,0
NEVS Evergrande 0,9 34x
Telogis Verizon 0,9 7x
Affectiva Smart Eye 0,7 15x
ABC Technologies Apollo 0,4 5x
Xevo Lear 0,3 1x
Source: Redeye Research, various industry sources
REDEYE AUTOTECH SEMINAR - 2021
15VALUATION METRICS
Valuations of the listed autotech companies forecast for the corresponding period for the tier-1s is 1%,
In the tables below, we have summarized the valuations of as indicated in the following table. This leads to on average
car OEMs, tier-1s and autotech-related tier-2/3 players. 34% higher P/E ratios for the tier-1s (median used due to
Car OEMs are expected to grow sales on average 4% during Tesla being such an outlier), while EV/S multiples are actually
2019-2021 according to Factset consensus, while the higher for OEMs.
Valuations of Listed Autotech Companies: OEMs & Tier-1s
Company Mkt P/E EV/EBITDA EV/Sales CAGR Sales
cap sales (SEKbn)
OEMs (SEKbn) 20 21E 22E 20 21E 22E 20 21E 22E 19-21E 2020
GM 615 10 8 7 12 11 9 1,2 1,1 1,0 1% 1127
Ford 442 32 8 7 20 13 11 1,2 1,1 1,0 -1% 1170
Volkwsagen 1275 17 10 9 8 7 7 1,1 1,2 1,1 1% 2339
BMW 535 14 5 6 13 8 8 1,4 1,3 1,2 3% 1039
Daimler 779 21 6 6 12 8 8 1,2 1,1 1,0 1% 1619
Toyota 2461 12 10 9 14 11 10 1,7 1,5 1,4 0% 2281
Honda 476 9 8 7 10 9 8 0,9 0,7 0,7 -1% 1104
Nissan 192 -5 20 9 70 13 10 1,1 0,8 0,8 -2% 659
Suzuki 184 16 13 12 7 6 5 0,7 0,6 0,5 0% 266
Hyundai 386 38 9 8 17 11 11 1,1 1,1 1,1 3% 811
Renault 95 -1 13 4 17 10 8 1,2 1,0 1,0 -3% 456
PSA 541 15 5 5 2 2 2 0,3 0,3 0,3 14% 910
Tesla 6292 329 148 105 128 83 60 24,1 16,4 12,1 36% 290
Average 1098 39,0 20,2 14,9 25,4 14,7 12,1 2,9 2,2 1,8 4,1% 1083
Median 535 14,9 8,8 7,1 13,4 9,6 8,0 1,2 1,1 1,0 0,5% 1039
Tier-1s (SEKbn) 20 21E 22E 20 21E 22E 20 21E 22E 19-21E 2020
Continental 232 36 15 10 8 4 4 0,8 0,7 0,6 -3% 396
Magna 205 20 11 9 8 6 5 0,7 0,7 0,6 0% 301
Veoneer 35 -4 -12 -21 -14 -18 -62 1,5 2,1 1,8 1% 13
Hyundai Mobis 386 38 9 8 17 11 11 1,1 1,1 1,1 3% 811
Aptiv 356 78 40 28 23 18 15 2,8 2,6 2,3 6% 120
Denso 478 48 17 14 12 7 7 1,2 1,1 1,0 1% 414
Valeo 59 -7 19 9 8 4 3 0,7 0,5 0,5 0% 172
Visteon 26 109 48 19 19 13 9 1,4 1,1 0,9 3% 23
Alps Alpine 20 -73 14 10 6 3 3 0,4 0,3 0,3 -2% 60
Faurecia 57 -15 10 7 6 4 3 0,6 0,6 0,5 1% 154
Aisin Seiki 97 11 7 6 5 4 3 0,5 0,5 0,4 1% 296
Average 177 21,9 16,2 8,9 8,7 5,2 0,1 1,1 1,0 0,9 0,9% 251
Median 97 20,0 13,8 9,0 7,9 4,5 3,7 0,8 0,7 0,6 0,7% 172
Source: Factset, Redeye Research
REDEYE AUTOTECH SEMINAR - 2021
16VALUATION METRICS • SHARE PERFORMANCE
In group 2 in the table below, we have included the Swedish, digit EV/sales multiples. However, they are not profitable yet,
smaller, pure-play companies (and in some cases their which we believe is related to the immature autotech market.
competitors). As one would expect, these players have a From 2023 and beyond we expect the autotech winners to
significantly faster expected sales growth and higher, double begin turning profitable and enjoy high margins.
Valuations of Listed Autotech-related Companies: Tier-2/3
Company Mkt P/E EV/EBIT DA EV/Sales CAGR Sales
cap sales (SEKbn)
Group 1 (SEKbn) 20 21E 22E 20 21E 22E 20 21E 22E 19-21E 2020
Xilinx 333 59 44 39 31 33 29 9,2 10,2 9,4 4% 28
Infineon 480 57 34 27 17 17 14 4,2 4,7 4,3 14% 91
NXP 493 34 21 19 18 16 15 5,9 6,1 5,7 6% 79
Renesas 181 46 20 16 11 8 7 3,4 2,6 2,3 8% 62
ST 350 38 23 21 15 13 11 3,2 3,2 3,0 9% 94
Intel 1895 10 11 12 6 7 7 2,9 3,2 3,2 -2% 717
Melexis 41 59 34 31 26 21 19 6,3 6,3 5,8 11% 5
Synopsys 438 60 49 44 29 37 33 8,9 12,3 11,2 8% 35
Nvidia 4819 90 54 49 42 43 39 19,3 21,8 19,5 34% 152
Average 1003 50,5 32,3 28,6 21,9 21,7 19,4 7,0 7,8 7,2 10,2% 140
Median 438 57,1 33,8 27,1 18,3 16,8 15,0 5,9 6,1 5,7 8,1% 79
Group 2 (SEKm) 20 21E 22E 20 21E 22E 20 21E 22E 19-21E 2020
Seeing Machines 4912 -4 -28 -42 -18 -25 -43 4,1 12,9 11,2 21% 259
Acconeer 1535 -8 n/a n/a -30 -20 -44 37,7 84,3 16,1 157% 10
Neonode 485 -11 -8 -14 -19 -10 1 9,3 6,1 1,2 71% 55
Diadrom 104 n/a n/a n/a n/a n/a n/a n/a n/a n/a n/a 39
Terranet 437 n/a n/a n/a n/a n/a n/a n/a n/a n/a n/a 0
Gapwaves 1376 -35 n/a n/a -38 n/a n/a 66,8 54,0 32,0 32% 16
Smart Eye 4255 -47 -49 -58 -76 -43 -106 52,1 31,2 10,3 85% 65
Average 1872 -20,9 -28,4 -38,0 -36,2 -24,5 -48,1 34,0 37,7 14,2 73,3% 63
Median 1376 -10,7 -27,7 -42,0 -30,1 -22,5 -43,6 37,7 31,2 11,2 70,9% 39
Source: Factset, Redeye Research
One year share price performance (%)
Looking at the one-year stock performance (see
the graph beside), all segments have performed 120%
well. The field is tight between OEMs, tier-1s and 100%
large tier-2/3 players, while small tier-2/3 players 80%
have performed even stronger.
60%
40%
20%
0%
OEMs Tier-1s Large tier-2/3s Small tier-2/3s
Source: Bloomberg
REDEYE AUTOTECH SEMINAR - 2021
17Covered Companies
REDEYE AUTOTECH SEMINAR - 2021
18REDEYE AUTOTECH SEMINAR - 2021
19Acconeer ACCON
Company page Publication date
https://www.redeye.se/company/acconeer September 30 2021
Redeye Rating
COMPANY QUALITY FAIR VALUE RANGE CATALYST POTENTIAL
Last price
Impact Timeframe
73.1
Major Long
Moderate Mid
Minor Short
3 2 2 Base
Bear Bull
People Business Financials 21.0 44.0 82.0 Turn page for catalyst specifics
Snapshot Financials
Acconeer Redeye Estimates
OMXS30
2019 2020 2021E 2022E 2023E
60
Revenue, MSEK 6 10 18 94 341
40
Growth -49.6% 72.6% 90.6% >100% >100%
20
EBITDA -68 -65 -49 -35 58
0
EBITDA margin Neg Neg Neg Neg 17.0%
Volume EBIT -68 -65 -64 -37 55
1 000k
500k EBIT margin Neg Neg Neg Neg 16.4%
0
Nov Jan Mar May Jul Sep Pre-tax earnings -68 -68 -64 -37 55
Net earnings -68 -68 -64 -29 43
Marketplace First North Stockholm Net margin Neg Neg Neg Neg 12.9%
CEO Lars Lindell Dividend/Share 0.00 0.00 0.00 0.00 0.00
Chairman Thomas Rex EPS adj. -3.59 -3.58 -2.72 -1.22 1.81
P/E adj. N/A N/A N/A N/A N/A
Share information
EV/S N/A N/A N/A N/A N/A
Share price (SEK) 73.1
EV/EBITDA N/A N/A N/A N/A N/A
Number of shares (M) 23.4
Market cap (MSEK) 1,709 Last updated: 2021-07-23
Net debt (MSEK) -82
Owner Equity Votes
Analyst
Bengt Adolfsson 11.6% 11.6%
Avanza Pension 9.6% 9.6%
Jesper Henrikson
jesper.henrikson@redeye.se Smbc Nikko Securities Inc. 7.9% 7.9%
Swedbank Försäkring 4.3% 4.3%
Nordnet Pensionsförsäkring 3.7% 3.7%
Conflict of interests
Mikael Egard 2.5% 2.5%
Jesper Henrikson owns shares in Acconeer: No
Mats Ingvar Ärlelid 2.4% 2.4%
Redeye performs/have performed services for the Company and receives/have
received compensation from the Company in connection with this. Lars-Erik Wernersson 2.4% 2.4%
Skandinaviska Enskilda Banken S.A 1.2% 1.2%
DTX i Sverige AB 1.1% 1.1%
REDEYE AUTOTECH SEMINAR - 2021
20Company description
Acconeer is a semiconductor company in Lund, Sweden, who went public in radar will be the go-to technology for CPD. Acconeer has won three CPD design
December 2017. It develops and sells radar sensors, with a fabless business wins for a total contract value of SEK 90-120m. We believe the OEM is a small
model, to manufacturers of electronics. The manufacturing partners are some premium car manufacturer, suggesting that CPD is a multi-billion SEK market
of the World's largst (Global Foundries & Amkor). Acconeer has developed a for Acconeer. We think larger premium OEMs could yield three times larger
radar with a minimal footprint (5x5x1 mm) that is 10 times smaller and comes initial contracts of SEK 270-360m, and this is just the premium market. The top
at a 10 times lower cost, compared to competing radars. Its real claim to fame 8 largest mass market manufacturers are 2-5 times larger than that, meaning
though is that the power consumption is 50 times lower than competition. As incredible potential.
for competitive disadvantages, radar technology is complex in general and
requires a lot of education of the customer but at the same time Acconeer is Large design wins to drive the share price
company of minor size that competes with giants. Acconeer needs to start
The key differences in our case scenarios are related to automotive and
building revenue sources in order to be seen as a reliable supplier for larger
smartphones. While news of orders gradually will de-risk the case we assume
companies. The growth strategy is based on a few important pillars such as
certain deals are key catalysts. They are more worth than others and have the
selling on Digi-Key, World's largest online distributor (450 000 customers) and a
potential to substantially move the shares; especially more larger deals within
vast, global network of local, niche distributors. The company's current focus
automotive. With sales ramping, a big news pipeline, and enough cash until
areas are robotics, smart presence, child presence detection, parking sensors,
year 2023 in a worst case scenario, we argue that the neglected Acconeer
level measurement (incl.waste management) and automotive.
stock provides solid risk/reward.
Investment case Main bear point:
• Strong unique product offering & scalability from unmatched cost • Acconeer’s minor size is a disadvantage that likely explains why major
• Automotive has the largest potential players like Google want to go with Infineon. Acconeer needs to start
• Large design wins to drive the share price building revenue sources in order to become reliable as a long-term
• Main bear point supplier for large customers.
Strong unique product offering & scalability
Catalyst types
from unmatched cost Larger deals to drive the share price
Acconeer’s radar of 5x5x1 mm is the tiniest radar on the market, which means Today's valuation has discounted a bunch of deals for Acconeer but since lead
unmatched cost. Other radars are more than three times larger, suggesting that times are long we assume the deals will start to gradually come. Smaller
they have at least three times higher cost. The real claim to fame though, and customers are moving faster. While news of orders gradually will de-risk the
the truly disruptive element in Acconeer’s offering, is the power consumption, case we assume certain larger deals are key catalysts. They are more worth
which is more than 10 times lower than competing radars. Combining these than others and have the potential to substantially move the shares; especially
characteristics and its fabless business model with the largest manufacturing big deals within automotive like Child Presence Detection.
partners in the World (Amkor & Global Foundries), Acconeer is poised to scale
rapidly with high gross margins as soon as sales kick in. Acconeer is ready to
ride the structural growth in large market segments within e.g. IoT, automotive
and robotics respectively. We believe automotive will be the company's most
important market.
Automotive has the largest potential
Acconeer is working on ten use cases in automotive with its tier-1 partner Alps
Alpine. The most exciting area is child presence detection (CPD) since it is
being mandated by Euro NCAP from 2022-2023, meaning it will become
standard in Europe. Moreover, CPD regulation in US is underway. Thus, most
OEMs are procuring or are about to procure CPD. In essence, it is the same type
of case as Smart Eye ~2 years ago. We believe Acconeer has a strong
competitive advantage in CPD as Acconeer's radar can detect a sleeping baby,
behind a blanket, by sensing its pulse or breathing, meaning, i our opinion, that
REDEYE AUTOTECH SEMINAR - 2021
21Gapwaves GAPW B
Company page Publication date
https://www.redeye.se/company/gapwaves September 29 2021
Redeye Rating
COMPANY QUALITY FAIR VALUE RANGE CATALYST POTENTIAL
Last price
Impact Timeframe
48.8
Major Long
Moderate Mid
Minor Short
4 4 2 Base
Bear Bull
People Business Financials 20.0 76.0 115.0 Turn page for catalyst specifics
Snapshot Financials
Gapwaves Redeye Estimates
OMXS30
2019 2020 2021E 2022E 2023E
70
60 Revenue, MSEK 20 22 40 51 116
50 Growth >100% 7.7% 80.4% 28.7% >100%
40
EBITDA -30 -36 -30 -29 6
30
EBITDA margin Neg Neg Neg Neg 5.4%
Volume EBIT -35 -42 -35 -35 0
2M
1M EBIT margin Neg Neg Neg Neg 0.1%
0
Nov Jan Mar May Jul Sep Pre-tax earnings -35 -44 -35 -35 0
Net earnings -35 -44 -35 -35 0
Marketplace First North Stockholm Net margin Neg Neg Neg Neg 0.1%
CEO Lars-Inge Sjöqvist Dividend/Share 0.00 0.00 0.00 0.00 0.00
Chairman Jonas Ehinger EPS adj. -1.32 -1.61 -1.29 -1.28 0.00
P/E adj. N/A N/A N/A N/A N/A
Share information
EV/S 28.5 70.5 N/A N/A N/A
Share price (SEK) 48.8
EV/EBITDA -19.0 -42.5 N/A N/A N/A
Number of shares (M) 30.7
Market cap (MSEK) 1,497 Last updated: 2021-09-29
Net debt (MSEK) -78
Owner Equity Votes
Analyst
Cécile Schilliger 21.8% 57.8%
HELLA 10.1% 3.1%
Forbes Goldman
forbes.goldman@redeye.se Avanza Pension 4.8% 1.5%
Lars-Inge Sjöqvist 3.7% 8.9%
Nordnet Pensionsförsäkring 2.8% 0.9%
Conflict of interests
BNP Paribas Sec Serv Luxembourg 2.7% 0.8%
Forbes Goldman owns shares in Gapwaves: No
Alfred Berg Fonder 2.7% 0.9%
Redeye performs/have performed services for the Company and receives/have
received compensation from the Company in connection with this. SIX SIS AG 1.8% 0.6%
Bright Peter Leo Ebenezer 1.8% 0.5%
Jian Yang 1.7% 5.1%
REDEYE AUTOTECH SEMINAR - 2021
22Company description Counter Points
Competitors catching up
Gapwaves offers wireless communication solutions based on the GAP
waveguide technology, which stems from the research of the late founder Per- While competition may be limited at this point, it is expected to increase.
Simon Kildal. The company’s great potential is found in the millimeter wave Huber+Suhner is the only competitor that is currently using a similar waveguide
antennas that can be applied in expansions of current radio link networks, technology. However, with limited success due to volume production issues
automotive radars and eventually 5G deployments. according to Gapwaves' CEO.
Nevertheless, other competitors could arise that could affect Gapwaves’
Investment case prospects. Another competing technology is, of course, regular patch antennas,
even though they do not have the same technological benefits as do waveguide
• Attractive application areas within both automotive and telecom for
antennas. We believe that the potential customers with in-house capabilities to
Gapwaves' 4-10x more power-efficient antennas.
develop similar products, such as the large system integrators, like Ericsson
• Contracts with several automotive customers with potential to yield SEK
and Nokia, pose perhaps the most serious threat.
250m in annual sales.
Uncertainties regarding 5G networks and the telecom opportunity
• The trends towards self-driving cars and increased safety regulations as
well as the coming 5G transformation creates huge market potential. Even though the 5G transformation is starting to happen, there is still
significant uncertainty regarding how the next generation networks will look
Several promising application areas for Gapwaves' like and how rapid the deployment will be, especially in the higher frequencies.
differentiated technology As of now, Gapwaves has one smaller customer within the telecom segment,
Gapwaves' product offering is based on the company's patented waveguide and it remains for Gapwaves technology to prove itself for this application
technology and includes antennas that can be used in, for example, telecom commercially.
equipment and for automotive applications. There are several benefits to this Rapid technological development
technology. One of them is that the antennas become 4-10x more power-
Technological development moves quickly in the industries that Gapwaves
efficient, and the power losses are thereby reduced. The technology also
focus on, as noted above. Within both the automotive and telecom equipment
increases the output power and the antenna directivity, i.e., the capability to
industries, the next generation is always around the corner, and products
concentrate the radiation in one direction. These characteristics are especially
become obsolete rather fast. Hence, the life cycle of Gapwaves’ product
interesting in the coming 5G transformation of the telecom networks, where,
offering is limited, and the company must address this issue with product
for example, the antenna directivity will be crucial to attaining higher capacity in
development to have a sustainable business.
the networks.
So far, there has been limited interest in the product technology from potential
telecom customers, leading us to believe that in the near term, the case is more
Catalyst types
about the automotive opportunity. The company has received a number of low- Announcement of a breakthrough automotive agreement
volume development agreements from several automotive customers. It has Gapwaves has customer relationships with several automotive Tier 1 parts
two high-volume agreements to date – licensing agreements with Veoneer and suppliers. The most critical catalyst for the share price is that a Tier 1 customer
HELLA. We expect Gapwaves will start receiving significant royalties in 2023. moves forward with volume production.
Gapwaves has sparked interest from other verticals, and that the application
5G market take-off & telecom customers
areas for its antenna units continues to expand. This is nonetheless validated
The transformation of the telecom industry, moving from 4G to 5G technology,
by orders, and follow-up orders from Uhnder and Smartmicro, among others.
is expected to take place in the coming years, and this shift has partially
Gapwaves is tapping into large industries, such as last-mile-delivery (LMD) and
already begun. Gapwaves will be well-positioned to attract customers from this
the internet of things (IoT), which present significant greenfield opportunities.
segment in addition to automotive, meaning a significant upside potential in
the stock.
Huge market potential in core segments
In the coming years, strong growth is expected in both primary application Follow-up orders from existing customers and new customer wins
areas for Gapwaves' technology. Thus, it is easy to see that the potential Gapwaves has attracted significant attention from automotive and new radar
markets for Gapwaves' products are enormous. Within automotive, the growth verticals. It is essential that these customers continue to place follow-up
is in the short term driven by increased regulation to improve safety and, in the orders, and increase volumes.
long run, the trend towards self-driving cars, which increases the need for
sensors drastically. The coming shift within the telecom sector to 5G
technology will lead to a surge in demand for suitable equipment for the denser
networks that the new technology will require. Both of these market
developments constitute exciting opportunities for Gapwaves going forward.
REDEYE AUTOTECH SEMINAR - 2021
23Smart Eye SEYE
Company page Publication date
https://www.redeye.se/company/smart-eye September 20 2021
Redeye Rating
COMPANY QUALITY FAIR VALUE RANGE CATALYST POTENTIAL
Last price
Impact Timeframe
190.2
Major Long
Moderate Mid
Minor Short
5 4 2 Base
Bear Bull
People Business Financials 170.0 340.0 405.0 Turn page for catalyst specifics
Snapshot Financials
Smart Eye Redeye Estimates
OMXS30
2019 2020 2021E 2022E 2023E
250
Revenue, MSEK 57 61 104 314 741
200
Growth 7.8% 8.3% 70.2% >100% >100%
150
EBITDA -61 -51 -97 -39 336
100
EBITDA margin Neg Neg Neg Neg 45.4%
Volume EBIT -77 -75 -114 -69 296
1 000k
500k EBIT margin Neg Neg Neg Neg 40.0%
0
Nov Jan Mar May Jul Sep Pre-tax earnings -78 -75 -114 -69 296
Net earnings -78 -75 -114 -55 233
Marketplace First North Stockholm Net margin Neg Neg Neg Neg 31.5%
CEO Martin Krantz Dividend/Share 0.00 0.00 0.00 0.00 0.00
Chairman Anders Jöfelt EPS adj. -5.18 -4.54 -5.80 -2.78 11.80
P/E adj. N/A N/A N/A N/A N/A
Share information
EV/S 29.8 27.3 N/A N/A N/A
Share price (SEK) 190.2
EV/EBITDA -27.6 -32.4 N/A N/A N/A
Number of shares (M) 19.9
Market cap (MSEK) 3,791 Last updated: 2021-08-27
Net debt (MSEK) -219
Owner Equity Votes
Analyst
Sellers Of Affectiva 10.2% 10.2%
Ålandsbanken I Ägares Ställe 9.3% 9.3%
Jesper Henrikson
jesper.henrikson@redeye.se Swedbank Robur Fonder 7.5% 7.5%
Första AP-fonden 6.9% 6.9%
Mats Krantz inklusive närstående 6.5% 6.5%
Conflict of interests
Handelsbanken Fonder 5.6% 5.6%
Jesper Henrikson owns shares in Smart Eye: Yes
Niclas Eriksson med närstående 5.0% 5.0%
Redeye performs/have performed services for the Company and receives/have
received compensation from the Company in connection with this. Martin Krantz 4.8% 4.8%
Anders Jöfelt 4.7% 4.7%
Avanza Pension 4.6% 4.6%
REDEYE AUTOTECH SEMINAR - 2021
24Company description
Smart Eye provides eye tracking software for especially automotive
Impatient & short term focused stock market
applications but addresses customers in defence, aircraft and academic Smart Eye’s first design wins with new customers are in general worth a lot
research as well. In the Research Instruments segment, where Smart Eye has more than what meets the eye as they are platform based. The platforms will
a market share of 4-5 percent, it provides systems consisting of hardware, usually (although not automatically) yield additional new car models for every
software and accessories. Our investment case, however, is fully based on year over the platforms’ lives of about 10 years. In addition, each car model
the Automotive Solutions segment, which is an OEM business where lives around seven years. For Smart Eye this creates a very foreseeable and
Smart Eye provides tier 1 automotive suppliers with algorithms and software stable revenue stream for many years to come as the large switching costs
for embedding eye tracking in products that are later sold to the car OEM provide solid barriers to entry. The stock market however, as always, only sees
manufacturers. When a car model with Smart Eye's technology is launched the coming few quarters, meaning significant potential for patient, long term
Smart Eye will receive a royalty based license fee per car. Within Automotive investors.
Solutions Smart Eye has won designs from about half of the customers that
has procured eye tracking thus far. The automotive market has high barriers Design wins to move the share price
to entry as it is costly and time consuming to develop products that meet the
We expect a steady news flow going forward with design wins from already
customers' high standards and switching costs are high, meaning important
won procurements as well as RFQ’s worth SEK billions in progress for the next
competitive advantages for Smart Eye.Listing: Stockholm Stock Exchange
quarters, which should drive the share price.
(First North) since year 2016.Locations: HQ in Sweden. Offices in Detroit,
China and Japan.
Catalyst types
Investment case VW win
The Volkswagen procurement will be finished imminently. Volkswagen sells
• In pole position within eye tracking for mandated driver monitoring
almost 11 million vehicles per year and is the World's second largest car OEM
• Impatient & short term focused stock market
(second only to Toyota), meaning significant catalyst potential if Smart Eye
• Design wins to move the share price
would win Volkswagen.
In pole position within eye tracking for Design wins in China
mandated driver monitoring We believe there are design wins overdue in China where Smart Eye's tier-1
partner has been selected and only paperwork remains before Smart Eye is
Due to EU and Euro NCAP's decisions to mandate driver monitoring, the market
officially nominated.
for driver monitoring systems (DMS) is about to explode. This expected growth
is a known fact for the stock market but we believe many do not understand Design wins and follow-up orders in general
Smart Eye’s strong positioning. Smart Eye has devoted ~20 years of 100 The major key catalyst in general is won contracts from the many RFQ’s worth
percent focus to and investments in this very niche. The company is in pole in total SEK 6 billion, which should drive the share price. In addition, we expect
position with an unmatched 84 design wins for 13 car OEMs. As for barriers to follow-up orders from existing customers
entry, the technology needs to cope with e.g. changing light conditions, tunnels,
sunshine, darkness, vibrations etc. and at the same time never fail. Competition
is therefore basically limited to one other tier-2 player aside of the tier-1
customers’ own solutions. However, we believe it is unlikely that the customers
in the long run are willing to put up with all investments and maintain the focus
necessary for in house sourcing. Smart Eye states that, being platform
independent and hardware agnostic, it has a competitive edge as its
technology can be locked late in the development process.
REDEYE AUTOTECH SEMINAR - 2021
25REDEYE AUTOTECH SEMINAR - 2021 26
Disclaimer

Important information
Redeye AB (“Redeye” or “the Company”) is a specialist financial advisory boutique that focuses on small and mid-cap growth companies in the Nordic region. We focus
on the technology and life science sectors. We provide services within Corporate Broking, Corporate Finance, equity research and investor relations. Our strengths are
our award-winning research department, experienced advisers, a unique investor network, and the powerful distribution channel redeye.se. Redeye was founded in
1999 and since 2007 has been subject to the supervision of the Swedish Financial Supervisory Authority.
Redeye is licensed to; receive and transmit orders in financial instruments, provide investment advice to clients regarding financial instruments, prepare and dissemi-
nate financial analyses/recommendations for trading in financial instruments, execute orders in financial instruments on behalf of clients, place financial instruments
without position taking, provide corporate advice and services within mergers and acquisition, provide services in conjunction with the provision of guarantees
regarding financial instruments and to operate as a Certified Advisory business (ancillary authorization).

Limitation of liability
This document was prepared for information purposes for general distribution and is not intended to be advisory. The information contained in this analysis is based
on sources deemed reliable by Redeye. However, Redeye cannot guarantee the accuracy of the information. The forward-looking information in the analysis is based
on subjective assessments about the future, which constitutes a factor of uncertainty. Redeye cannot guarantee that forecasts and forward-looking statements will
materialize. Investors shall conduct all investment decisions independently. This analysis is intended to be one of a number of tools that can be used in making an
investment decision. All investors are therefore encouraged to supplement this information with additional relevant data and to consult a financial advisor prior to an
investment decision. Accordingly, Redeye accepts no liability for any loss or damage resulting from the use of this analysis..

Potential conflict of interest
Redeye’s research department is regulated by operational and administrative rules established to avoid conflicts of interest and to ensure the objectivity and
independence of its analysts. The following applies:
• For companies that are the subject of Redeye’s research analysis, the applicable rules include those established by the Swedish Financial Supervisory Authority
   pertaining to investment recommendations and the handling of conflicts of interest. Furthermore, Redeye employees are not allowed to trade in financial instruments
   of the company in question, from the date Redeye publishes its analysis plus one trading day after this date.
• An analyst may not engage in corporate finance transactions without the express approval of management and may not receive any remuneration directly
   linked to such transactions.
• Redeye may carry out an analysis upon commission or in exchange for payment from the company that is the subject of the analysis, or from an underwriting
   institution in conjunction with a merger and acquisition (M&A) deal, new share issue or a public listing. Readers of these reports should assume that Redeye
   may have received or will receive remuneration from the company/companies cited in the report for the performance of financial advisory services. Such
   remuneration is of a predetermined amount and is not dependent on the content of the analysis.

Redeye’s research coverage
Redeye’s research analyses consist of case-based analyses, which imply that the frequency of the analytical reports may vary over time. Unless otherwise expressly
stated in the report, the analysis is updated when considered necessary by the research department, for example in the event of significant changes in market
conditions or events related to the issuer/the financial instrument.

Recommendation structure
Redeye does not issue any investment recommendations for fundamental analysis. However, Redeye has developed a proprietary analysis and rating model,
Redeye Rating, in which each company is analyzed and evaluated. This analysis aims to provide an independent assessment of the company in question,
its opportunities, risks, etc. The purpose is to provide an objective and professional set of data for owners and investors to use in their decision-making.

Redeye Rating (2021-04-08)
Rating                    People                     Business                     Financials
5p		                       20                            15                           3
3p - 4p                    96                            77                           36
0p - 2p                     6                            30                           83
Company N                  122                          122                          122

Duplication and distribution
This document may not be duplicated, reproduced or copied for purposes other than personal use. The document may not be distributed to physical or
legal entities that are citizens of or domiciled in any country in which such distribution is prohibited according to applicable laws or other regulations.

Copyright Redeye AB.

REDEYE AUTOTECH SEMINAR - 2021
redeye.se

Redeye is the next generation investment banking company, specialized in Life Science and Technology.
Clients are innovative and fast-growing companies based in the Nordics but with a global reach. Redeye is a
leading provider of Equity Research, Corporate Broking, and Corporate Finance in these sectors. The research
 is built on a value-based investment philosophy and with a unique Rating model. Redeye was founded in
Stockholm 1999 and is regulated by the Swedish Financial Authority (Finansinspektionen).

                                                                                              REDEYE AUTOTECH SEMINAR - 2021
You can also read