Atmospheric Drivers in California Precipitation Transitions
←
→
Page content transcription
If your browser does not render page correctly, please read the page content below
Workshop, May 18, 2022

   Atmospheric Drivers in California Precipitation Transitions
         Potential Predictability of Southwest US Precipitation:
         Role of tropical and high-latitude variability
             Gudrun Magnusdottir, Yannick Peings and Yuna Lim
                    Earth System Science Department
                         University of California Irvine
Research Question

Southwest US
  domain

      Skill of CFSv2 seasonal forecasts for predicting DJF precipitation (hindcasts 1982-2010).
      From Kumar and Chen (2020). Kumar and Chen (2020).

What would be the benefit of improving seasonal forecasts in the tropics
and the high-latitudes?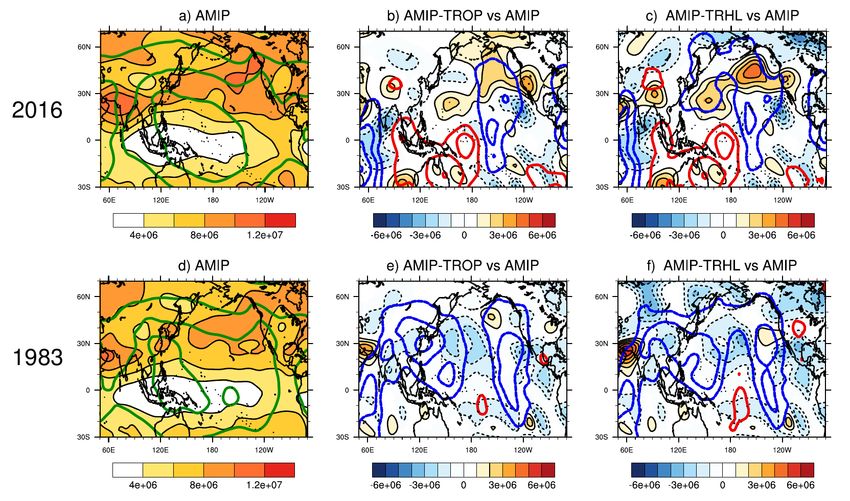
The atmospheric model : WACCM

The Whole Community Climate Atmospheric Model (WACCM)
- WACCM4 1.9° x 2.5° horizontal grid, 66 vertical levels, up to 140 km
- Specified chemistry, External forcing (GHGs, etc) follows historical values
-    Prescribed QBO

                              Experiments
                  Four types of experiments over 1980-2016

                    1) Prescribed observed SST/SIC : AMIP                        AMIP
            2) AMIP with prescribed tropical variability : AMIP-TROP
           3) AMIP with prescribed high-latitude variability : AMIP-HL           AMIP-plus
    4) AMIP with prescribed tropical and high-latitude variability : AMIP-TRHL

                          10 ensemble members per experiment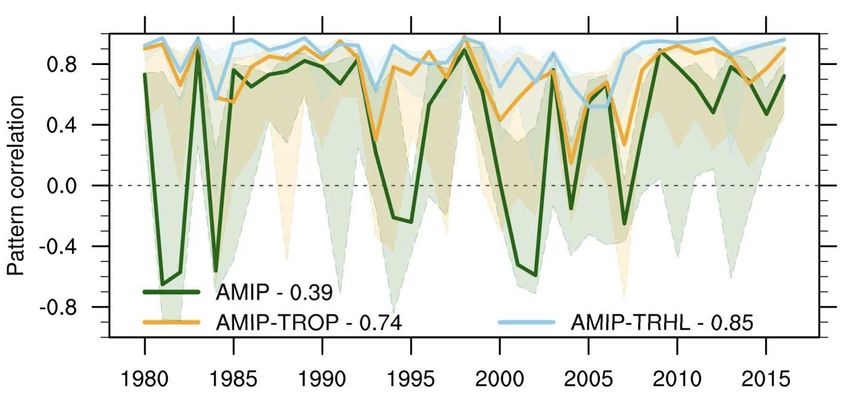
Experimental setup for AMIP-plus experiments

                            Nudging of u, v, T & sfc p toward MERRA-2:
                                XREF = AMIPClim-3hourly + MERRA2anom-3hourly

Value of the nudging coefficient along the horizontal and vertical in : a) and d) AMIP-TROP ; b) and e) AMIP-HL ; c) and f) AMIP-TRHL.
The relaxation strength is linearly decreased from 0.1 to 0 at the edges of the nudging domain. The purple rectangle in the pressure
versus latitude plots indicates the domain of relaxation of the QBO (horizontal wind only, and a nudging time coefficient of 10 days).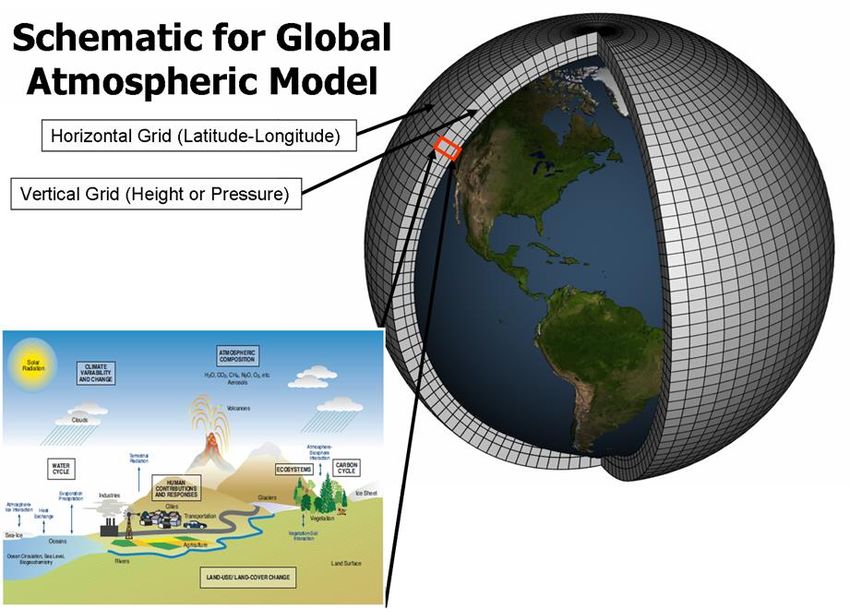
Results
Representation of the North Pacific
       atmospheric variability in each experiment

                   Skill in Z500 (versus MERRA-2)

AMIP (SST only)                               Additional skill in AMIP-TROP

Grid-point correlations of NDJFM Z500 anomalies with MERRA-2 (1980-2016)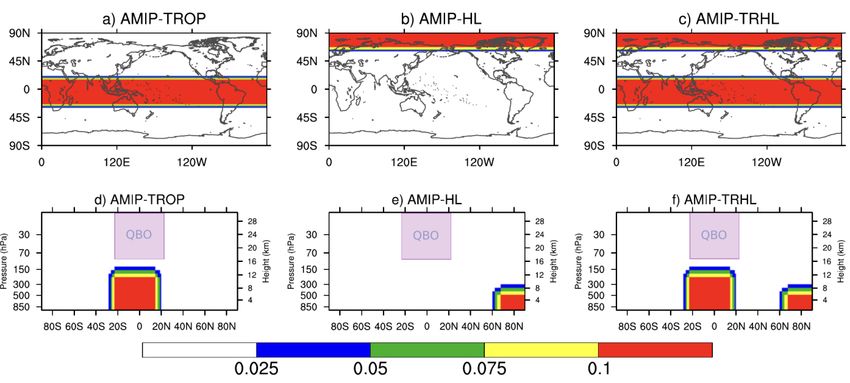
Representation of the North Pacific
      atmospheric variability in each experiment

                   Skill in Z500 (versus MERRA-2)

AMIP (SST only)                              Additional skill in AMIP-TRHL

Grid-point correlation of NDJFM Z500 anomalies with MERRA-2 (1980-2016)
Representation of the North Pacific
      atmospheric variability in each experiment

                   Skill in Z500 (versus MERRA-2)

AMIP (SST only)                                 Total skill in AMIP-TRHL

Grid-point correlation of NDJFM Z500 anomalies with MERRA-2 (1980-2016)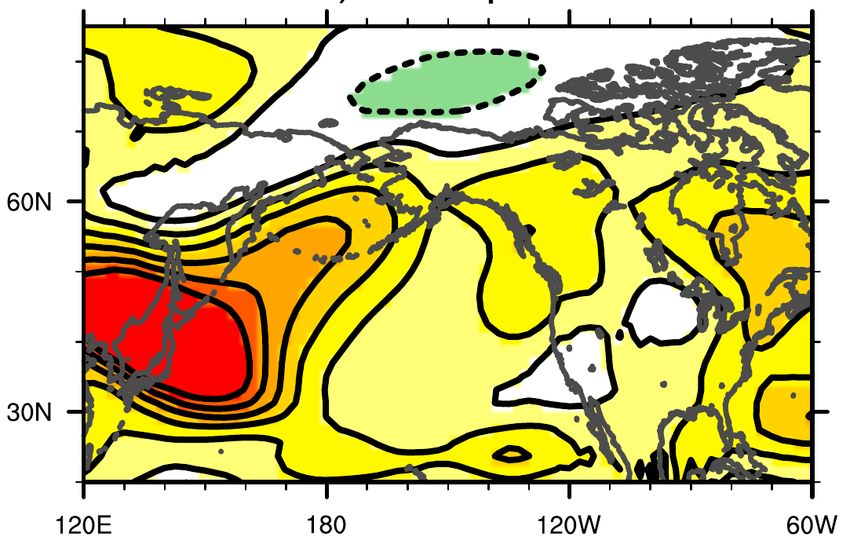
Representation of US precipitation

                  Skill in precipitation (versus CPC)

AMIP (SST only)                                 Total skill in AMIP-TRHL

 Grid-point correlation of NDJFM P anomalies with CPC (1980-2016)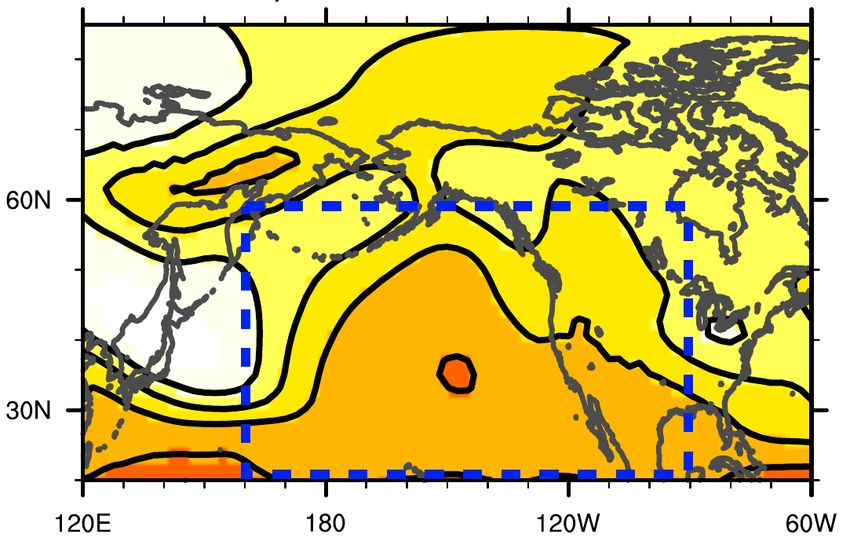
Timeseries of “skill” in the North Pacific
                            AMIP, AMIP-TROP (tropics nudged) and AMIP-TRHL (tropics and Arctic nudged)

North-Pacific/
North America
domain

[160ºE /90ºW;
20ºN/60ºN]

                 Pattern correlation of Z500 anomalies in the North Pacific - North America domain [160°E/90°W,20°N/60°N] between MERRA-2 and
                 ensemble means of AMIP (green), AMIP-TROP (orange) and AMIP-TRHL (blue) and MERRA-2, for each NDJFM season of 1980-2016.
                 For each experiment, the envelope represents max/min values of the spatial correlation among the 10 ensemble members.
Decompose into different timescales using daily data
Synoptic (1-10 days), S2S (10-90 days), Interannual (1-5 years), Multiyear (>5 years)
Compute pattern correlations between the observed and simulated Z500 anomaly in the NP-NA domain,
after time filtering the daily data
If the correlation is greater than 0.7, the event is classified as accurately represented in the experiment.
Composite by phases of MJO (synoptic, S2S), ENSO (interannual) and IPO (multiyear)Counts of periods of accurate representation of NP-NA circulation patterns Count of periods of accurate representation of the North Pacific circulation pattern in AMIP, AMIP-TROP and AMIP-TRHL, for a) the synoptic (1d-10d) timescale (5587 NDJFM days over 1980-2016) ; b) the S2S (10d-90d) timescale (574 pentads) ; c) the interannual (1y-5y) timescale (37 years) ; d) the multiyear timescale (37 years with 5-yr lowpass filter, i.e. 33 years). Events of “accurate representation” are based on a spatial correlation of Z500 anomalies, in the ensemble mean of experiments versus reanalysis, greater than 0.7.
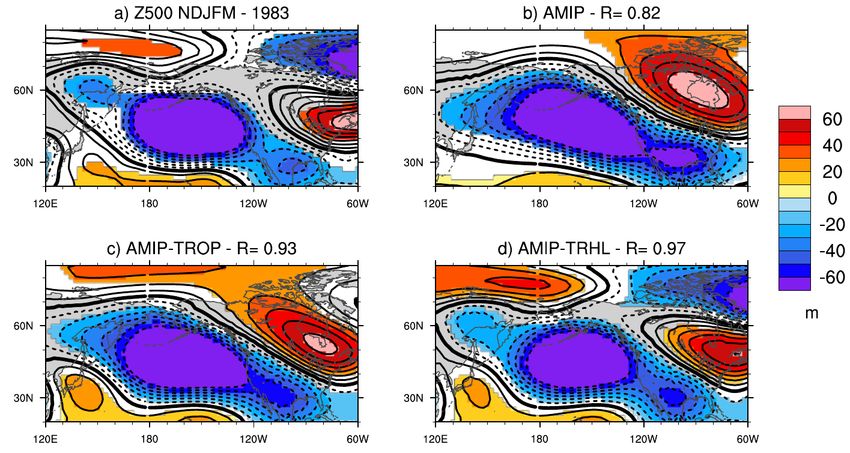
1983 : A “typical” El Niño year

Z500 anomalies in NDJFM 1983, in : a) MERRA2, b) AMIP, c) AMIP-TROP and d) AMIP-TRHL.
1983 : A “typical” El Niño year

Boxplot-whisker representation of the 10-member distribution of NDJFM 1983 CA rainfall anomalies
[124°W/116°W, 32°N/42°N] in AMIP, AMIP-TROP and AMIP-TRHL. The boxplot indicates the median, upper
and lower quartile of the distribution. The whiskers indicate the minimum and maximum values. The ensemble
mean is marked by a red diamond. The horizontal dashed blue line indicates the observed value.
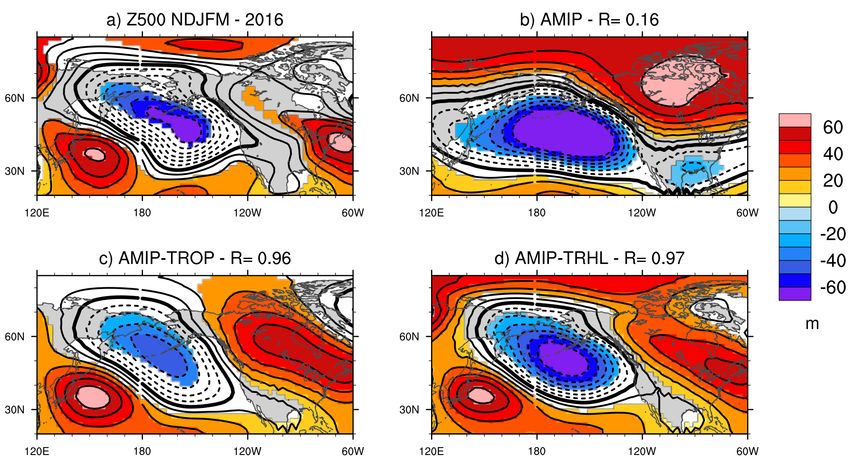
The 2016 El Niño “bust”

Z500 anomalies in NDJFM 2016, in : a) MERRA2, b) AMIP, c) AMIP-TROP and d) AMIP-TRHL.
The 2016 El Niño “bust”

Boxplot-whisker representation of the 10-member distribution of NDJFM 2016 CA rainfall anomalies
[124°W/116°W, 32°N/42°N] in AMIP, AMIP-TROP and AMIP-TRHL. The boxplot indicates the median, upper
and lower quartile of the distribution. The whiskers indicate the minimum and maximum values. The ensemble
mean is marked by a red diamond. The horizontal dashed blue line indicates the observed value.
Greater S2S variability in 2016 versus 1983

NDJFM standard deviation of subseasonal (10d-90d) 850 hPa velocity potential (green, blue and red contours,
kg/s) and 250 hPa streamfunction (shading, kg/s) in (Top) 2016 : a) AMIP, contour interval for VP850 : 5.10-5
kg/s. b) AMIP-TROP minus AMIP difference. Contour interval for VP850 : 2.5.10-5 kg/s (blue is negative, red is
positive). c) Same as b) but for AMIP-TRHL. (Bottom) 1983 ; d-f) Same as a)-c) but for year 1983.
More realistic tropical variability weakens
             the ENSO teleconnection in the model

Comparison of the ENSO teleconnection in observations and the AMIP experiments (1980-2016).
Summary: Take-away points
Tropical variability exerts a strong influence on the North Pacific North America atmospheric
circulation, from S2S to decadal time scales. Imposing high-latitude variability further
increases the skill of the model.
This means that improving predictability in the tropics and high-latitudes will benefit
predictions of the Southwest US precipitation at S2S, seasonal, and decadal time scales.
Signal at one time scale may be a source of noise at another. We find that high S2S activity
(MJO) in the tropics may disrupt the ENSO teleconnection and be detrimental for seasonal
predictions. Further work is ongoing to explore this question in climate model large
ensembles.
References
Peings, Y., Lim, Y., & Magnusdottir, G. (2022) Potential predictability of Southwest US rainfall : role of tropical and high-latitude variability, Journal of Climate,
35, https://doi.org/10.1175/JCLI-D-21-0775.s1
Lim, Y., Peings, Y., & Magnusdottir, G. (2021). The role of atmospheric drivers in a sudden transition of California precipitation in the 2012/13 winter. Journal of
Geophysical Research: Atmospheres, 126, e2021JD035028. https://doi.org/10.1029/2021JD035028
Sena, A. T, Peings, Y, & Magnusdottir, G. (2022). Effect of the Quasi-biennial Oscillation on the Madden Julian Oscillation teleconnections in the Southern
Hemisphere, Geophys. Res. Lett.,49, https://doi.org/10.1029/2021GL096105Nudging the atmosphere towards MERRA-2 fields
In the nudging domain, the T, U, V and surface pressure are nudged towards a reference state :
XREF = AMIPclim-3hourly + MERRA2anom-3hourly
At each grid point of the nudging domain, Xt+1 = Xt + k*(Xt - XREF) , with k nudging coefficient
Verification of nudging efficiencyYou can also read


