Assessment of Sri Lankan Power Sector - October 2020 - K Seeds Investments
←
→
Page content transcription
If your browser does not render page correctly, please read the page content below
K SEEDS INVESTMENTS

Assessment of Sri
Lankan Power
Sector

                     October 2020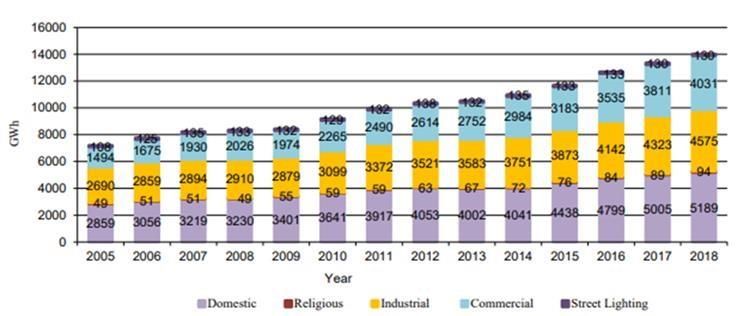
Contents

1. Overview of Sri Lankan Power Sector
  1.1 Accessibility to power                                   05
  1.2 Per Capita Electricity Consumption                       06
  1.3 Power Structure of Sri Lanka                             07
  1.4 Key Challenges Faced by SL Power Sector                  07

2. Global Power Generation Trends                              09

3. Power Generation System
  3.1 Existing Power Generation System                         12
  3.2 Power Generation Expansion System                        14

4. Cost of Production, Selling price and Demand for Power
  4.1 Cost of Production                                       16
  4.2 Selling Price                                            17
  4.3 Average Selling Price Vs Average Cost at Selling Point   21
  4.4 Comparison of Selling Prices                             21
  4.5 Demand for Power                                         22
  4.6 Demand Projections                                       24

5. Power Distribution and Collection
  5.1 Distribution of Power                                    26
  5.2 Collection                                               27

6.Regulator of the Electricity Industry of Sri Lanka           28
7. Mini Hydro projects available in the industry
   7.1 List of Mini Hydro Projects Undertaken by Listed Power
       Companies in Sri Lanka                                      32
   7.2 Small Hydro Power Developers Association (SHPDA)            34
   7.3 Cyclin Impact on the Hydro Power projects                   35
   7.4 Approval of a mini-hydro project                            38
   7.5 Factors to consider by an investor who is looking to have
       exposure to the mini hydro sector                           39

8. Wind projects in the Industry                                   40

9. Solar Power projects in the Industry
  9.1 Solar Power Projects Undertaken by CEB                       45
  9.2 Solar Power Plants Capacity Additions                        45
  9.2 Development of rooftop solar power                           46

10.Thermal Projects
   10.1 The Capacity Breakdown of the Sectors and the
       Sources of Generating Thermal Power                         48
   10.2 Thermal Plant Specific Cost Comparison                     54

11. Listed Power Generation Companies
   11.1 Vidullanka PLC (VLL)                                       55
   11.2 Resus Energy PLC (HPWR)                                    57
   11.3 Vallibel Power Erathna PLC (VPEL)                          58
   11.4 Panasian Power PLC (PAP)                                   59
   11.5 Laugfs Power PLC (LPL)                                     60
   11.6 Laugfs Power PLC (LPL.X)                                   61
   11.7 LVL Energy Fund PLC (LVEF)                                 62
   11.8 Lotus Hydro Power PLC (HPFL)                               63

12. Conclusion                                                     64

13. References                                                     65
1. Overview of Sri
Lankan Power Sector

Over the past 15 years, electric         The production of nonconventional
power use has nearly doubled –           renewable energy (NCRE) and
from 297 kwh per capita to 531 kwh       liquefied natural gas (LNG) is
per capita, and 100 percent              therefore a must in order to meet
electrification has been achieved in     long-term energy demand in a
Sri Lanka. To meet the increasing        sustainable and cost-effective way.
energy needs, Sri Lanka will need to     The natural gas sector in the country
look beyond publicly funded              has been slow to develop and the
projects, increase its share of          exploration of domestic gas basins is
commercial financing and promote         uncertain. The focus has now
increased involvement by the             shifted to procurement of LNG to
private sector in the renewable          fuel the power sector, but there is
energy sector to end the era of fossil   lack of clarity on the demand for
fuel dominance in the energy sector.     LNG beyond the power sector. In the
                                         power sector, LNG is expected to
Given that the power sector in Sri       fuel about 700 MW of old oil-fired
Lanka is heavily dependent on hydro      power plants which are to be
plants, any change in the monsoon        converted to gas-fired plants, and
pattern hurts the industry. At that      about 1,600 MW of new gas plants
time,     country    will    become      are also planned in the long term
increasingly dependent on imported       generation expansion plan (LTGEP).
fuel and eventually impact trade         However,       LNG       procurement
and exchange rate balances. CEB          methodologies and their cost
spending on liquid fuels was close to    effectiveness are yet to be examined
USD 0.5 BN per year, and will            in detail.
continue to rise.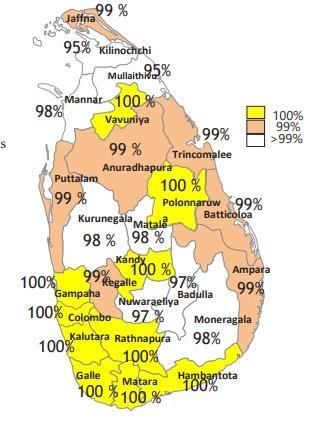
1.1 Accessibility to Power

During 2019 CEB reached out to all its prospective customers and hit an
electrification pace of 99.7 percent by the end of the year. Over the year the
number of buyers rose by 146,360 making the total number of customers as
6,500,641 at the year end. Throughout the year the CEB provided its customers
with electricity for the entire 24 hours of the day, except for occasional short-
term breakdowns.

                FIGURE 01: ELECTRICITY ACCESSIBILITY

                             Source:Powermingov.lk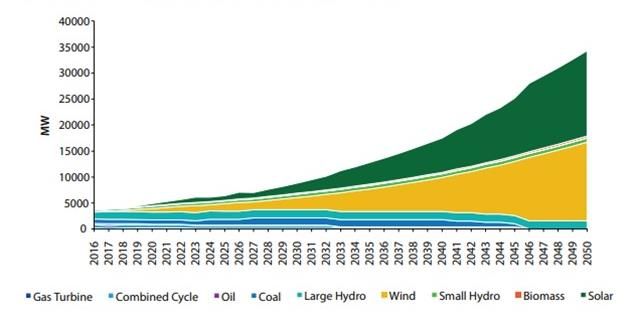
TABLE 01: ELECTRICITY                                     FIGURE 02: SL PER CAPITA
CONSUMER BASE 2019                                        ELECTRICITY CONSUMPTION
Electricity Consumer   2018       2019      Increase in
Accounts                                    accounts
                                            2019
Domestic               5,543,137 5,651,452 108,315
Religious              39,422     40,724    1,302
General Purpose        704,173    739,122   34,949
Hotel                  447        470       23
Industrial             62,570     64,241    1,671
Government             4,530      4,574     44
Agriculture            -          56        56
Bulk Supply to LECO    1          1         0

Street Lighting        1          1         0
Total                  6,354,281 6,500,641 146,360

Source: Statistical Digest 2019                            Source: Generation Expansion Plan - 2019

                                                          FIGURE 03: ASIAN COUNTRIES
1.2 Electricity Per Capita
                                                          PER CAPITA ELECTRICITY
Consumption
                                                          CONSUMPTION:

The average per capita electricity
consumption in 2017 and 2018
were 626kWh per person and 650
kWh per person respectively.
Generally, it has been rising
steadily; however, in the period
2007 – 2009 amidst the slow down
of electricity growth, the per
capita consumption has stagnated.
A similar trend is observed during
2012 to 2013.
Figure 2 shows Sri Lanka's increase
in per capita electricity usage from
2004 through 2018. It is compared
to other Asian countries with
differences in per capita electricity
usage between 2004 and 2016 as                             Source: Generation Expansion Plan - 2019
shown in Figure 3.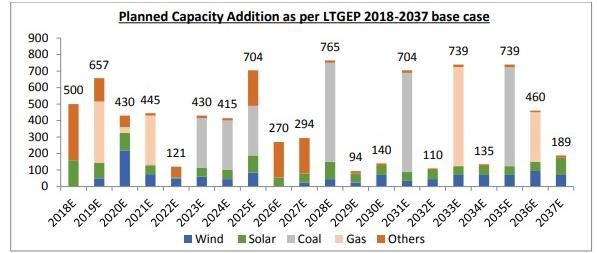
1.3 Power Structure of Sri Lanka       • A substantial amount of investment
Below figure depicts the key           is needed to improve the existing
entities involved in the generation,   power generation, transmission and
transmission and distribution of       distribution system. Sri Lanka
power in Sri Lanka.                    therefore needs to promote greater
                                       involvement of the private sector in
FIGURE 04: POWER                       the power sector. Sri Lanka will need
STRUCTURE                              to mobilize capital investments of
                                       about USD 5.0 BN in generation, USD
                                       1.1 BN in transmission, USD 229 MN
                                       in distribution, and USD 512 MN in
                                       proposed DSM programs to meet its
                                       estimated demand for electricity in
                                       2026. Such a large investment cannot
                                       be financed only by public sector
                                       funding.

                                       • As the composition of world
                                       electricity generation moves towards
                                       renewable energy (RE), Sri Lanka
1.4 Key Challenges Faced by Sri
                                       needs to look at ways of promoting
Lankan Power Sector
                                       RE growth. While Sri Lanka is blessed
                                       with numerous forms of renewable
• During adverse monsoon               energy resources, there are no
seasons, costly power production       research facilities within the country
methods using oil is mostly            dedicated to RE growth.
adopted       to     offset    low
hydroelectric power generation,        • Slow roof-top solar production due
resulting in higher average power      to lack of proper customer education
generation costs relative to other     and limited options from commercial
countries. (~ 8.5 US cents / kWh in
2016, compared to ~ 5.5 in India       banks for low cost financing. In spite
and ~ 6.5 in Bangladesh).              of having regulations promulgating
                                       rooftop solar adoption, Sri Lanka has
                                       been unable to generate any gainful
                                       momentum in the country's rooftop
                                       solar deployment.
The high cost of rooftop solar          • There are a large number of players
systems, combined with the lack of      in the power sector and new
affordable financing or business        licensees are on a tender basis for
models open to the public to build      future projects. As a result, the
and use these systems, is one of
the primary reasons for this.           entrance of new players would be
                                        influenced by pricing and the benefit
                                        will be marginal.
• There is a large gap between CEB
visionaries       and      industry
developers, which could slow
down the industry considerably.
Targets and objectives for the
power sector have not been
completely       aligned     among
stakeholders in the sector. The
2018 - 2037 long-term generation
plan was approved in June 2018
following lengthy deliberations
among sector stakeholders. Lack
of coordination between sectoral
entities can continue to delay
implementation of the project and
hinder      commercial      finance
mobilization.

• Sri Lanka lacks the domestic
potential to finance ambitious
commercial        bank      projects.
Without funding from multilaterals
and     low-cost     financing    by
international banks, growth would
be difficult to achieve.
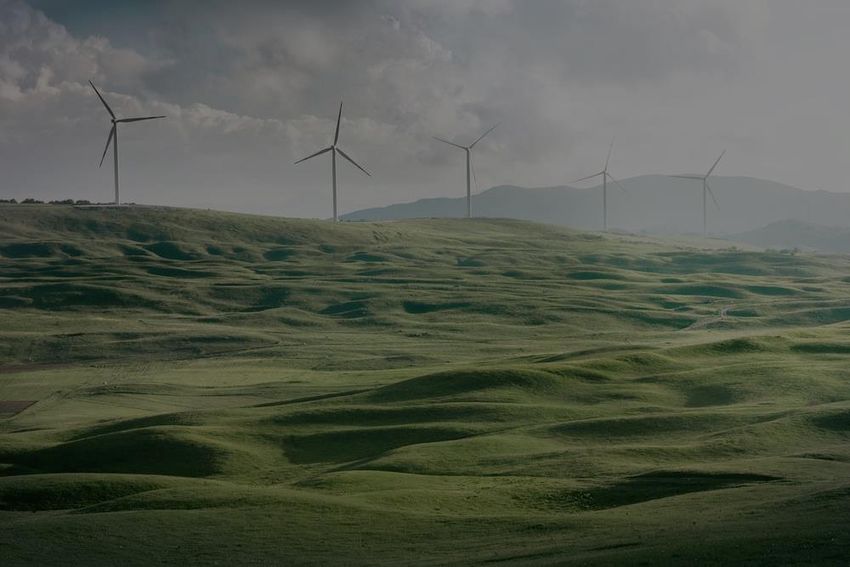
2. Global Power Generation
Trends

The energy world is changing…            manufacturing industries. The last
Regionally, over the coming years,       10 years have also witnessed a
Asia Pacific is expected to be a         drastic price drop as the experience
leading contributor to the global        and scope of renewable energy
power generation market. Growing         projects extended.
demand for advanced power                The global energy market has begun
generation      and      distribution    to evolve in encouraging ways, with
infrastructure in Southeast Asian        widespread       renewable    energy
countries      and      constructive     adoption and related technology
government funding to develop the        boding well for a sustainable future.
power generation and distribution        The global demand for new power
networks in emerging economies           generation capacity is being
like India and China are the leading     dominated          by      renewable
drivers for the Asia Pacific power       technologies. In many markets, solar
generation market.                       power and wind power are rapidly
In the coming years, steady growth       the cheapest source of electricity,
of the renewable energy sector is        and most renewable energy sources
likely to be a key feature of the Asia   would be competitively priced at full
Pacific power generation market, as      cost. In 2019, as renewable
the area is closer to the equator        electricity production increased by
than either North America or             more than the growth in electricity
Europe and thus has considerable         demand, a new milestone was
potential in terms of wind and solar     reached, while fossil-fuel electricity
generation. This is further aided by     generation decreased. This is the
the massive drop in renewable            first time in decades that the
energy costs and using electricity to    production of fossil fuels has
decarbonize      the     industry   is   decreased as the total generation of
increasingly desirable, transport and    electricity has increased.
FIGURE 05: RENEWABLES IN THE WORLD’S ENERGY MIX

Source: IRENA Global Renewables Outlook

Developed economies continued to be the early adopters of renewable energy
technologies like wind, solar and biomass. Increasingly, however, in the 2010s,
and particularly once costs have fallen to parity with fossil fuel alternatives,
developing economies have chosen the baton up. Figure 6 shows that, for the
first time in 2015, emerging economies accounted for the majority of global
investment in renewable energy power, and have retained this since then. In
2019, out of a world total of $282.2 billion, they accounted for $152.2 billion, a
54 percent share. This was the same proportion as in 2018, but down from a
62 percent share in 2017. In 'other developing countries', except China and
India, 2019 was the highest number ever for renewable capacity investment.
This jumped 17% to $59.5 billion, and for 2016, it was double the equivalent
amount.
FIGURE 06: GLOBAL INVESTMENT TRENDS IN RENEWABLE
ENERGY (in USD billions)

     Source: UNEP, Bloomberg New Energy Finance

Further, a start-up based in New Zealand “Emrod” has developed a method of
transmitting electric power securely and wirelessly over long distances without
the use of copper wire, and is partnering with Powerco, the second largest
power distributor in the world to introduce it.

Emrod currently has a working prototype of its device, but will develop another
one for Powerco, with plans to produce by October 2020, and then spend
several months in laboratory testing before moving to a field trial. The prototype
system is said to be able to supply "quite a few kilowatts" of electricity, but can
be scaled up easily. Wireless transmission is, indeed, seen by Emrod as a key
enabling technology for renewable energy, which is often produced far from
where it is required. This kind of device could be a perfect way to get offshore
and remote renewable energy generation products into city grids without the
need for giant storage batteries and the like.
3. Power Generation
System
3.1 Existing Power Generation along with the sources of power
System generation.
TABLE 02: POWER
The country's current generating GENERATION 2019
system is mainly operated by CEB
along with substantial private-sector
ownership. Until 1996 CEB owned
the entire electricity system. As of
1996, the private sector also
engaged in producing electricity to
meet the rise in electricity demand.
The country's existing generating
system has approximately 4,046
MW of installed capacity by 2019
including 610 MW non-dispatchable
plants operated by private sector
developers. CEB owns the bulk of
the dispatchable power, which
comprises 1,398.85 MW of hydro
and 1,504 MW of thermal Source: Statistical Digest 2019
generation capacity. Independent
Power Producers (IPPs) own However, the government of Sri
balancing dispatchable energy, Lanka, through the envisaged
which is totally thermal plants. renewable energy targets and
projected generation planning, has
Table 2 illustrates the breakdown of been pursuing a shift toward clean
contribution by CEB and IPP in 2019 power generation, including both
NCRE and LNG based generation.FIGURE 07: POWER GENERATION COMPOSITION OVER THE PAST YEARS Source: Revised LTGEP Sri Lankan Power System has operated maintaining 30%-60% share of renewable energy throughout the recent years. This trend will be continued in the future with the optimum amount of renewable energy integration to the system. FIGURE 08: RENEWABLE SHARE IN THE RECENT PAST Source: Revised LTGEP
3.2 Power Generation                             •     4,199 MW of wind (1205 MW),
Expansion System                                       solar (1389 MW) and gas (1605
                                                       MW) projects by 2037
FIGURE 09: SRI LANKA 2050
ELECTRICITY GENERATION
MIX: 100 PERCENT RE                                  Additionally,    base    case  also
                                                     estimates installation of 215 MW of
                                                     mini hydro, 85 MW of biomass, 822
                                                     MW of major hydro, 2.7 GW of coal
                                                     and 320 MW of oil-based generators
                                                     up to 2037.
                                                     Vision is to pave the way for Carbon
                                                     neutrality to be realized by 2050
                                                     according to the draft Energy Policy.
                                                     In 2016, the share of renewable
                                                     energy in power generation was
                                                     32%. Power generation facilities are
                                                     planned and implemented according
Source: Assessment of Sri Lankan Power Sector,
                                                     to CEB 's Long-Term Generation
UNDP                                                 Expansion Plan (2018-2037) to cater
                                                     for the growing electricity demand.
LTGEP 2018-2037 focuses on                           Main concern is given to the
diversifying the power mix and                       construction of optimal power
growing reliance on projects                         generating plants with minimum
relating to renewable energy and                     impact to the environment and all
gas. Base case under the 2018-                       plans are prepared to meet
2037 LTGEP provides for:
                                                     international obligations including
                                                     COP 21.
• 1,035 MW of wind (270 MW),
  solar (360 MW) and gas (405
  MW) projects by 2020

• 1,980 MW of wind (585 MW),
  solar (690 MW) and gas (705
  MW) projects by 2026
FIGURE 08: PLANNED CAPACITY ADDITION AS PER LTGEP 2018-
2037 BASE CASE
Source: Assessment of Sri Lankan Power Sector, UNDP
Capital investment requirement is estimated based on the power generation
expansion plan. Total capital requirement includes capital costs expected to be
incurred for setting up the generation plants (including both conventional and
renewables). Additional investment will be required for operating plants and for
fuel related expenditure.
TABLE 03 :CAPITAL REQUIREMENTS OF POWER GENERATION
SEGMENTS
All Values in USD Power Generation
million
Solar Wind Gas Coal Others Total
Short term (till 360 351 631 - 424 1,767
2020)
Medium Term 690 761 756 1,100 1,724 5,041
(cumulative up
to 2026)
Long 1,389 1,567 1,881 2,700 2,056 9,564
Term(cumulative
up to 2037)
Source: Assessment of Sri Lankan Power Sector, UNDP4. Cost of Production, Selling Price, and Demand for Power 4.1 Cost of Production The average cost at selling point in 2017 and 2018 were Rs. 20.34 per 1 kWh and Rs.19.12 per 1 kWh respectively. Following table depicts the generation cost of one kwh for several power stations during 2016. TABLE 04: POWER GENERATION COST OF SEVERAL POWER STATIONS DURING 2016 Source: Generation Performance in Sri Lanka-2016
4.2 Selling Price                         Block Tariff

The average selling price per unit in     Consumption blocks are based on a
2017 and 2018 were Rs. 16.26 per 1        30-day billing period and the number
kWh and Rs.16.29 per 1 kWh                of units in a block would be prorated
respectively.                             according to the number of dates in
FIGURE 09: COST OF POWER VS               each billing period.
END USER PRICING ( US
Cents/kWh)                                Domestic Low Users (if monthly
                                          consumption is 60 units per
                                          month or less than 60 units)

                                          Consumption        Energy Charge       Fixed Charge
                                          per month          (LKR/kWh)           (LKR/month)
                                          (kWh)

                                          0-30               2.50                30.00
                                          31-60              4.85                60.00

                                         Source: pucsl..gov.lk

Source: World Bank
                                          Domestic-Users over 60 units per
                                          month
4.2.1 End User Tariff Structure
                                          Consumption per        Energy Charge    Fixed Charge
                                          month (kWh)            (LKR/kWh)        (LKR/month)
Used for domestic purposes in
private residences. There are two
                                          0-60                   7.85              -
types of Domestic Tariff Categories.
                                          61-90                  10.00            90.00

     1. Block Tariff                      91-120                 27.75            480.00

     2. Time of Use Tariff (TOU):         121-180                32.00            480.00
      The optional tariff for domestic    More Than 180          45.00            540.00
      consumers
                                         Source: pucsl..gov.lk
Optional Time of Use (ToU) Tariff Consumption per Energy Charge Fixed Charge
for Domestic Customers month (kWh) (LKR/kWh) (LKR/month)
Team of Use (ToU) Energy Fixed 0-30 1.90 30.00
Charge Charge 31-90 2.80 60.00
(LKR/kWh) (LKR/month 91-120 6.75 180.00
) 121-180 7.50 180.00
Off Peak (22.30-5.30 13.00 More Than 180 9.40 240.00
hrs) 540.00 Source: pucsl..gov.lk
Day (5.30-18.30 hrs) 25.00
Peak (18.30 -22.30 hrs) 54.00
3. Hotels
Source: pucsl..gov.lk
Customer Category H-1
2. Religious and Charitable This rate shall apply to supplies at
each individual point of supply
delivered and metered at 400/230
The tariff will be charged on Volt nominal and where the
Incremental Block Tariff basis. This contract demand is less than or
rate shall apply to supplies of equal to 42 kVA.
electricity to,
Energy Charge Fixed Charge Maximum
• places of public religious (LKR/kWh) (LKR/month) Demand
worship including private Charge Per
month(
residences of priests where such
LKR/kVA)
residences are associated with or 21.50 600
are within the place of public
religious worship,
Source: pucsl..gov.lk
• Homes for aged, orphanages Customer Category H-2
and homes for the handicapped, This rate shall apply to supplies at
which are specifically certified by each individual point of supply
the Director of Social Services as delivered and metered
charitable institutions, and the 400/230 Volt nominal and where
installation should not include any the contract demand exceeds
building used for commercial 42kVA.
purposes.Time Interval Energy Fixed Maximum Customer Category I-2
Charge Charge Demand Charge This rate shall apply to supplies at each
(LKR/k (LKR/mo Per month(
individual point of supply delivered
Wh) nth) LKR/kVA)
Peak 18.30- 23.50
and metered at 400/230 Volt nominal
22.30 and where the contract demand
Day 5.30-18.30 14.65 exceeds 42 kVA.
Off-peak22.30- 9.80 3,000 1,100
Time Energy Fixed Maximum Demand
5.30
Interval Charge Charge Charge Per month(
Source: pucsl..gov.lk (LKR/kW (LKR/mon LKR/kVA)
Customer Category H-3 h) th
Peak 20.50
This rate shall apply to supplies at (18.30-
each individual point of supply 22.30)
Day (5.30- 11.00
delivered and metered at 11,000 18.30)
Volt nominal and above. Off-peak 6.85 3,000 1,100
(22.30-
Time Interval Energy Fixed Maximum 5.30)
Charge Charge Demand Charge Source: pucsl..gov.lk
(LKR/kW (LKR/mon Per month(
Customer Category I-3
h) th) LKR/kVA)
Peak (18.30- 22.50 This rate shall apply to supplies at each
22.30) individual point of supply delivered
Day (5.30-18.30) 13.70 and metered at 11,000 Volt nominal
Off-peak(22.30- 8.80 3,000 1,100
and above.
5.30) Time Energy Fixed Maximum Demand
Source: pucsl..gov.lk Interval Charge Charge(LK Charge Per month(
(LKR/kW R/month LKR/kVA)
4.Industrial Consumers h
Peak 23.50
Customer Category I-1 (18.30-
22.30)
This rate shall apply to supplies at Day (5.30- 10.25
18.30)
each individual point of supply Off-peak 5.90 3,000 1,000
delivered and metered at 400/230 (22.30-
5.30)
Volt nominal and where the Source: pucsl.gov.lk
contract demand is less than or
5.General Purpose
equal to 42 kVA.
Consumptio Energy Fixed Maximum
Supply of electricity to be used in
n per Charge Charge Demand Charge shops, offices, banks, warehouses,
month(kWh (LKR/kWh (LKR/month Per month public buildings, hospitals, educational
establishments, places ofCustomer Category GP-1 Time Interval Energy Fixed Maximum
Charge( Charge(L Demand Charge
This rate shall apply to supplies at LKR/kW KR/mont Per month(
each individual point of supply h h) LKR/kVA)
Peak (18.30- 25.50 3,000 1,000
delivered and metered at 400/230 22.30)
Volt nominal and where the Day (5.30- 20.70
contract demand is less than or 18.30)
Off-peak 14.35
equal to 42 kVA. (22.30-5.30)
Source: pucsl..gov.lk
Consumption Energy Fixed Maximum
per Charge Charge Demand
month(kWh) (LKR/kWh (LKR/mo Charge Per 6.Government
) nth) month(
LKR/kVA) Supply of electricity to be used in
Less than or 18.30 240 - schools, hospitals, vocational
equal 300
More than 22.85 training institutions, and
300 universities, which are fully owned
Source: pucsl..gov.lk by the Government and funded
through the national budget and
Customer Category GP-2 provide their services free of charge
This rate shall apply to supplies at to the general public.
each individual point of supply Customer Category GV-1
delivered and metered at 400/230
Volt nominal and where the This rate shall apply to supplies at
contract demand exceeds 42 kVA. each individual point of supply
delivered and metered at 400/230
Time Interval Energy Fixed Maximum Demand Volt nominal and where the
Charge Charge Charge Per month(
(LKR/k (LKR/m LKR/kVA)
contract demand is less than or
Wh) onth) equal to 42 kVA.
Peak (18.30- 26.60 3,000 1,100
22.30)
Day (5.30- 21.80 Energy Charge Fixed Charge Maximum
18.30) (LKR/kWh) (LKR/month) Demand Charge
Off-peak 15.40
Per month(
(22.30-5.30)
LKR/kVA)
Source: pucsl..gov.lk 14.65 600
Customer Category GP-3
This rate shall apply to supplies at Source: pucsl..gov.lk
each individual point of supply
delivered and metered at 11,000
Volt nominal and above.Customer Category GV-2
Day (0530-1830 hrs) 30.00
This rate shall apply to supplies at Level 2
each individual point of supply AC
Peak (1830-2230 hrs) 55.00
delivered and metered at 400/230 Charging
Volt nominal and where the
contract demand exceeds 42 kVA. Off peak (2230-0530 hrs) 20.00
Energy Charge Fixed Charge Maximum Source: pucsl..gov.lk
(LKR/kWh) (LKR/month) Demand Charge
Per month( 4.3 Average Selling Price Vs
LKR/kVA) Average Cost at Selling Point
14.55 3000 1100
FIGURE 10: AVERAGE SELLING PRICE VS
AVERAGE COST OVER THE PAST YEARS
Source: pucsl..gov.lk
25
Customer Category GV-3 Avg Selling Price Vs Avg Cost 20
15
This rate shall apply to supplies at Average Selling
Price Per
each individual point of supply 10 Unit(Rs/kWh )
delivered and metered at 11,000 5 Average Cost Per
Unit (@ selling
Volt nominal and above. 0 point)(Rs/kWh )
Energy Charge Fixed Charge Maximum
(LKR/kWh) (LKR/month) Demand Charge Year
Per month(
Generally, average cost per 1 kwh at
LKR/kVA)
14.35 3000 1000
selling point is rising steadily;
however, in the period 2015 and
Source: pucsl..gov.lk
2018 it has been reduced by 24.7
percent, 6 percent respectively. An
Commission approved Electricity increasing trend is observed with
Tariff for the customers who are average selling prices per 1 kwh
charging their vehicles at CEB over the period.
owned charging stations. 4.4 Comparison of Selling Prices
Tariff Charge
Category
TOU Time Period
(LKR/kWh) SL selling prices of 1 kWh for
Day (0530-1830 hrs) 50.00
households and Businesses (as at
DC Fast
Dec. 2019) is compared to
Peak (1830-2230 hrs) 70.00
Charging benchmark countries depicted in
Off peak (2230-530 hrs) 30.00 Figure 11.FIGURE 11: SELLING PRICE COMPARISON WITH BENCHMARK
COUNTRIES
0.16
0.14
0.12
0.1
0.08
0.06
0.04
0.02
0
Country
Household, kWh Business, kWh
4.5 Demand for Power
Total power demand in Sri Lanka increased by 12,785 GWh in 2016 during the
period 2011-16 at a CAGR of 5.0 per cent. CEB has forecasted power demand to
rise to 50.978 GWh by 2044 at a CAGR of about 5.0 per cent.
FIGURE 12: POWER DEMAND EVOLUTION (2011-2016)
-
14000 12785
11786
12000 10624 11063
10026 10475
10000
8000
6000
4000
2000
0
2011 2012 2013 2014 2015 2016
Source: Sri Lanka Energy Infrasap,World Bank
The sectoral contribution to the existing demand is highlighted below.FIGURE 13: SECTORIAL CONSUMPTION OF ELECTRICITY 2005-2018
Source: Generation Expansion Plan 2019
FIGURE 14: SECTORIAL CONSUMPTION OF ELECTRICITY 2018
Source: Generation Expansion Plan 2019
These Figures reveal that the cumulative industrial and commercial
(general purpose, hotel, government) sectors’ electricity consumption is
much more than the electricity consumption by the domestic sector.4.6 Demand Projections Development Project, Administrative
Cities Development Project, Multi
The Government has proposed Model Transport Hub (Pettah) and
and planned for large scale Science and Technology City) under
development projects, which will the Capital City and Colombo
lead to an increase of electricity Commercial City development
demand in the future. The major programs of Ministry of Megapolis and
development plans are mainly Western Development are indicatively
identified by Western Region estimated as 121MW for 2018-2022,
Megapolis Plan and Hambantota 399MW for 2023-2026 and 508MW
Port Development Plan in for 2027-2030 period.
Southern Region. The Western
Region Megapolis Plan identifies The Colombo Port City Development
following major areas for the Project is a major development
development. project under the Western Region
Megapolis Plan and indicate
• Multi Model Transport Hub cumulative electricity demand
(Pettah) requirement estimated as 30MW by
• Administrative Cities 2020, 177MW by 2025, 313MW by
Development Project 2030 and 393MW by 2040.
Hambantota Port Development Plan in
• Science and Technology City
Southern Region also estimated
• Maritime City Development approximately 400MW electricity
Project demand for the initial stage in the
• Colombo Central Business present development plan. The
District Electricity Demand Forecast 2020-
2044 was prepared considering the
• Housing Development phase development of the above
• Horana & Mirigama Industrial large-scale projects. During the
Township detailed planning stages, it is required
to identify the time-based load
• SME Industry requirement to determine the load
• Colombo Port City pattern which would impact on actual
electricity demand.
• Transport
Different demand forecast scenarios
• Tourism were planned in the power generation
The cumulative electricity demand expansion plan 2019, taking into
requirements for the identified account growth rate variations in the
projects (Maritime City baseline demand forecast, long-term
trend approach,end-user approach, and those listed FIGURE 15 : GENERATION
below.
FORECAST OF LOW, HIGH,
1. High Load Forecast - The forecast LONG TERM TIME TREND AND
developed considering 1% higher MAED WITH BASE
economic growth of the country
beyond 2022 and economic sector
change based on higher growth in
Industrial and Service sector in future.
2. Low Load Forecast - The forecast
developed considering 1% reduction
from the annual growth rate of Base
Load Forecast.
3. Long Term Time Trend Forecast -
The forecast developed purely based Source: Generation Expansion Plan 2019
on the time trend approach using the
past 25-year electricity demand FIGURE 16 :PEAK DEMAND
figures starting from 1993. FORECAST OF LOW, HIGH,
LONG TERM TIME TREND AND
4. MAED Load Projection – The MAED WITH BASE
projection derived from MAED
software by considering end user
energy demand data and identifying
technological, economic and social
driving factors influencing each
category of final consumption and
their relations to the final energy.
For the above four scenarios,
including the Base Load Forecast,
Figure 15 & Figure 16 graphically
displays the power production and Source: Generation Expansion Plan 2019
peak load forecast.5. Power Distribution and
Collection
4.5 Distribution of Power Division Province Area
North Western Chilaw,Kurunegala,Kuliyapi
tiya,Wariyapola,Puttlam
and Narammala
Major part of the country's Distribution
Division 1 North Central Anuradapura,Kekirawa and
electricity distribution is handled by Minneriya
CEB amounting to 88 per cent of the North Jaffna,Kilinochchi and
overall sales volume, while the rest Vavuniya
is managed by the subsidiary of CEB, Colombo City Colombo North, Colombo
South,Colombo West and
Lanka Electricity Company Ltd Colombo East
(LECO). Distribution licensees are
responsible for supplying end user Division Province Area
power and receiving end user
Eastern Ampara,Batticaloa,Trincomalee
revenue. and Kalmunai
Central Province Kegalle,Mawanella,Kandy
For ease of administration and Distribution
Division 2 City,Peradeniya,Kundasale,Katug
service, the entire CEB distribution astota,Galagedara,Matale,Damb
ulla,Nuwaraeliya,Ginigathena,Na
system is geographically divided into walapitiya
four Divisions; Distribution Division
Western Province North Gampaha,Kelaniya,Negombo,Ja-
1 (DD1), Distribution Division 2 ela,Divulapitiya and Veyangoda
(DD2), Distribution Division 3 (DD3),
and Distribution Division 4 (DD4).
The key aim of creating the four Division Province Area
Divisions is to achieve benchmark Western
South II
Province Bandaragama,Homagama,Avi
ssawella Sri
competitiveness that can boost Distribution
Division 3
Jayawardenapura,and
consumer efficiency and supply Horana
quality.
Sabaragamuwa Ratnapura,Kahawatte,Ruwan
wella,Eheliyagoda and
Embilipitiya
Uwa Badulla,Diyatalawa,Monarag
alaDivision Province Area
Southern Province Ambalangoda,Galle,Hambant
hota,Matara,Tangalle,Akures
Distribution
sa(formally Weligama) and
Division 4
Baddegama
Western Province South I Ratmalana,Kalutara and
Dehiwala
Source:Powermingov.lk
5.2 Collection
The CEB's collection agents, Sampath
Bank, National Development Bank
(NDB), and National Savings Bank
(NSB), have introduced real-time
online (OLRT) monitoring of consumer
electricity bill payments over the year.6. Regulator of the
Electricity Industry of Sri
Lanka
Public Utilities Commission of Sri Lanka (PUCSL) is the economic, technical and
safety regulator of the electricity industry. The Commission regulates the
industry through licenses, regulations, rules and methodologies.
Economic
Regulation
PUCSL
Mandate
Technical Safety
Regulation Regulation
Price
Regulation
Safety Regulation
Technical & Safety
Economic Regulation
Regulation
Market Service
Regulation Quality Technical Quality
RegulationOUTCOMES OBTAINED BY PUCSL 1. Improved productivity & convenience for electricity consumers. 2. Affordable Price for consumers and sustainable financial stability for licensees. 3. Improved safety of every living being and properties of general public, licensees & operators. 4. Improved environmental conditions for humans, animals and plants.
7. Mini Hydro Projects in
the Industry

Sri Lanka is blessed at a local          generation of colonial-era large-scale
location relative to rains in the        tea plantations. Since then, until the
interior of, in addition to especially   1960s, the limited hydro capacity
around the central mountainous           steadily expanded until the expansion
regions. Heavy rains and the sloping     of the power grid to provide power.
nature of the land have resulted in a
                                         CEB 's assistance to the development
series of small and large streams
carrying water throughout the year,      of the Mini hydropower sector was
enabling a variety of reservoirs to      given in the 1990s with the necessary
produce and meet significant             assistance to the private sector, which
sections of the energy needs of the      involved training & capacity building,
country. Although the government is      pre-feasibility studies, and resource
carrying out large-scale power           assessments. Beginning in 1997, the
generation projects, the private         process for the purchasing of electricity
sector has been approved for             from Small Power Producers (SPPs) by
projects with a capacity of under 10
                                         the CEB was regularized by the
MW. Many local organizations are
pursuing potential locations and         publication of the Uniform Power
selling the generated energy to the      Purchase Agreement (SPPA), which
Ceylon Electricity Board when the        included a scheme to measure the
green light is provided, building and    purchase price based on the concept of
installing power plants.                 avoided costs. Further, 2006 National
                                         Energy      Policy   established     fuel
                                         diversification and energy security in
Sri Lanka's history of small
                                         electricity generation as a strategic
hydropower generation extends
over a century and is largely            target and as part of this strategy the
associated with the power                development of renewable energy
                                         projects was established. In view of
the above, the implementation of a Minihydro capacity is expected to three-tier tariff was introduced grow moderately over the next instead of the avoided cost-based twenty years in the long-term tariff with effect from 2008. Both generation expansion plan, as most of large-scale hydropower generation the attractive resources and sites facilities will remain under have already been established. government control for the near future, and the private sector will be responsible for the construction of small hydropower plants. Currently the technology specific cost reflective tariff introduced in 2012 is in force. The geo-climatic condition in Sri Lanka is favorable for the mini hydro development and several past studies have assessed the potential for the development of mini-hydro resources. A comprehensive study was conducted as part of the hydropower portion of the Ministry of Irrigation and Water Resources' Dam Safety and Water Resources Planning (DSWRP) project, focusing on the country's 13 river basins, and the study concluded that the country's total Minihydro capacity is 873MW. The total grid-connected Mini hydro capacity at the end of 2018 is 393.5 MW, comprising 368.5 MW built by the private sector and 25 MW under the multi-development project Moragahakanda Kaluganga Development by the relevant Ministry of Mahaweli Development and Environment with the Mahaweli Authority of Sri Lanka.
7.1 List of Mini Hydro projects undertaken by Listed Power Companies in
 Sri Lanka
 TABLE 05:LIST OF MINI HYDRO PROJECTS UNDERTAKEN BY
 LISTED POWER COMPANIES
Power Project        Ownership Generation Location         River Catchment   Plant Commissioning
                               Capacity                                      Factor Year

Bambarabatuoya      Vidullanka    3.2 Mw    Rathnapura     Kalu Ganga,       44%   1-Jun-2001
MHPP                PLC                                    Bambarabatuoya
Rideepana MHPP      Vidullanka    1.75 Mw   Badulla        Badulu Oya        4%    15-May-2015
                    PLC
Lower Kothmale MHPP Vidullanka    4 MW      Kotmale,       Kothmale Oya      37%   25-Jun-2014
                    PLC                     Nuwara-Eliya
Madugeta MHPP       Vidullanka    2.5 MW    Neluwa,        Gin Gange         46%   1-Nov-2013
                    PLC                     Galle
Wembiyagoda MHPP Vidullanka       1.3 MW    Kalawana,      Koswathu Ganga    40%   19-Mar-2013
                    PLC                     Ratnapura
Ganthuna MHPP       Vidullanka    1.2 MW    Ganthuna,      Gurugodaya        38%   26-Mar-2010
                    PLC                     Aranayake,
                                            Kegalle
Ethamala Ella        Vidullanka   2 MW      Matara         Nilwala Ganga     44%   30-Sep- 2016
                     PLC
Batatotha MHPP       Vidullanka   2.0 MW    Kuruwita,      Kuru Ganga        58%   6-Mar-2007
                     PLC                    Ratnapura
Udawela MHPP         Vidullanka   1.4MW     Badulla        Badulu Oya        45%   29-Dec-2017
                     PLC
Upper agra oya       Resus        2.6 MW    Lindula,    Agra Oya             39%   01-Feb-2006
hydropower project   Energy PLC             Thalawakele

Giddawa hydropower   Resus      2.0 MW      Giddawa,       Huluganga         45%   01-Oct-2008
project              Energy PLC             Teldeniya

Upper magal ganga    Resus      2.4 MW      Dikellakanda. Magal Ganga        40%   01-Sep-2011
hydropower project   Energy PLC             Maliboda

Gomale oya           Resus      1.4 MW      Magala,        Gomale Oya        30%   01-Aug-2016
hydropower project   Energy PLC             Maliboda

Moragaha oya         Resus      1.5 MW      Panvila,       Moragaha Oya      35%   01-Mar-2017
hydropower project   Energy PLC             Kandy
Ranawala oya Resus 1.2 MW Maliboda, Ranwala Oya 37% 29-Nov-2018
hydropower project Energy PLC Deraniyagala
Upper hulu ganga Resus 1.9 MW Panwila, Kandy Hulu Ganga 35% 25-July-2019
hydropower project Energy PLC
Rathganga MHP Panasian 3 Mw Ratthurugala, Rathganga 45% 2004
Power PLC Ratnapura
Manelwala MHP Panasian Walapane,Nuwa Kurundu Oya 38% 2008
Power PLC ra Eliya
Padiyapelella MHP Panasian 3.5 Mw Padiyapelella, Beliul Oya 43% 2017
Power PLC Nuwara Eliya
Erathna mhpp Vallibel 9.9 MW Kuruwita, Kuru Ganga N/A 2004
Power Rathnapura
Erathna PLC
Denawaka ganga mhpp Vallibel 7.2 MW Malwala, Denawaka Ganga N/A 2012
Power Rathnapura
Erathna PLC
Kiriwaneliya mhpp Vallibel 4.65 Norton Bridge, Maskeli Oya N/A 2011
Power MW Nuwara Eliya
Erathna PLC
Ginigathhena Laugfs 0.7 MW Ginigathhena N/A N/A 2017
Power PLC
Ranmudu Oya Phase 1 Laugfs 0.5 MW Balangoda N/A N/A 2017
Power PLC
Ranmudu Oya Phase 3 Laugfs 0.55 Balangoda N/A N/A 2017
Power PLC MW
Belihul oya LVL Energy 2.2 MW Balangoda Horton Plains 47% May 2002
Fund PLC
Assupini ella LVL Energy 4.0 MW Gampola and Maha Oya 47%. November
Fund PLC Mawanella 2005
Kadawala LVL Energy 6 MW Watawala and N/A 25% March 2008
Fund PLC Kadawala
Neluwa LVL Energy 2.2 MW border of Galle Gin Ganga 33% January 2008
Fund PLC and Kalutara
Theberton LVL Energy 1.3 MW Kiriwaneliya N/A 41% September
Fund PLC 2015
Campion LVL Energy 1.2 MW Bogawantalawa Kehelgamuwa Oya 45%. May 2017
Fund PLC
Bambarapana LVL Energy 2.5 MW Bambarapana, Uma Oya 41%. February 2018
Fund PLC Badulla7.2 Small Hydro Power 6 Zyrex Power (Pvt.) Ltd. N/A
Developers Association (SHPDA) 7 Elpitiya Plantations 4.46 Mw
The Small Hydro Power Developers
8 Lotus Hydro Power Plc. 4.9 Mw
Association (SHPDA), representing
(Formerly known as Hydro
the major local power generators Power Free Lanka / Browns
of renewable energy in Sri Lanka, Hydro Power Plc.)
seeks to jointly work with relevant
state authorities to formulate and 9 Natural Power (Pvt.) Ltd. N/A
implement appropriate national 10 Dunsinane Power Co. (Pvt.) N/A
Ltd.
renewable energy policies. SHPDA 11 Midland Energy (Pvt.) Ltd. N/A
members currently supply 12 Vallibel Power Erathna Plc. 21.85 Mw
approximately 10% of the nation’s 13 Serendib Energy (Pvt.) Ltd. N/A
demand, saving millions of dollars in 14 Weswin Power (Pvt.) Ltd. N/A
foreign exchange to the country 15 Agraoya Hydro Power N/A
annually. Moreover, small (Pvt.) Ltd.
16 Santak Power (Pvt.) Ltd. N/A
hydropower projects, while being 17 Energy Reclamation (Pvt.) N/A
environmentally friendly, have Ltd.
stimulated tangible economic 18 Hydro Trust Lanka (Pvt.) 4 MW
progress among rural Sri Lankan Ltd.
communities. Table 06 includes the 19 WKV Hydrotechnics (Pvt) 43.4 Mw
Ltd.
members of Small Hydro Power 20 Samangiri Hydro Electrical N/A
Developers Association. Co. Pvt
21 Hynford Water Power N/A
TABLE 06: MEMBERS OF SMALL (Pvt.) Ltd.
HYDROPOWER DEVELOPERS 22 Resus Energy Plc. 13 MW
ASSOCIATION (Formerly known as
Hemas Power Plc.)
Company Installed 23 Falcon Valley Hydro N/A
capacity in mini 24 Bogo Power (Pvt.) Ltd. N/A
hydro projects 25 Vidullanka Plc 32.35 Mw
1 Access Energy (Pvt.) Ltd. N/A
2 Eco Power (Pvt.) Ltd. 58.2 Mw 26 Mark Hydro (Pvt.) Ltd / N/A
3 Recogen Haycarb (Pvt.) N/A Mark Marine Services Pvt.
Ltd. Ltd.
4 Hydrodynamics (Pvt.) Ltd. N/A 27 Royali Power (Pvt.) Ltd. N/A
5 Saman Jala Viduli Co. N/A 28 Branford Hydro Power N/A
(Pvt.) Ltd. (Formerly (Pvt.) Ltd.
known as Hydro Tech
Lanka Dickoya)29 Hayleys Power Ltd. 9.5 MW 7.3 Cyclin impact on the hydro power
(Formerly known as projects
Hayleys Industrial
Solutions)
30 Panasian Power Plc. 8.9 Mw
Although an assessment of a project's
31 Waltrim Hydropower 6.6 MW technological viability would be
(Private) Ltd. Formerly straight forward, the climate
known as Sunshine Power
conditions could be highly
(Pvt.) Ltd.
32 Terraqua International N/A complicated.
(Pvt.) Ltd. The climate of Sri Lanka is marked by
33 Sujalashakthi (Pvt.) Ltd. N/A
34
the southwest monsoon and
Wellawaya Hydro Power N/A
Pvt. Ltd. northeast monsoon. The Climate
35 Castle Power House (Pvt.) 11.85 Mw experienced during the 12 months
Ltd. period in Sri Lanka can be
36 Energy Generators (Pvt.) N/A characterized in to 4 climate seasons
Ltd.
37 Laugfs Power Ltd. 1.75 Mw
as follows.
38 Ceylex Engineering Pvt. 7.5 MW
Ltd. (LTL Power) 1. First Inter-monsoon Period (March
39 Magalganga Power (Pvt.) N/A to April)
Ltd.
40 Bhoruka Power Lanka N/A Arm and uncomfortable conditions,
(Pvt.) Ltd. with thunderstorm-type rain,
41 Hiran Power (Pvt.) Ltd. N/A
42 Nilwala Vidulibala N/A
particularly during the afternoon or
Company (Pvt.) Ltd. evening, are the typical weather
43 Eskey Power Generators N/A conditions during this season. The
Pvt. Ltd. distribution of rainfall during this
44 Fair Energy Developers N/A period shows that the entire South-
Pvt. Ltd.
45 Campion Hydro Pvt. Ltd. N/A
western sector at the hill country
46 Escas Owala Pvt. Ltd. N/A receiving 250 mm of rainfall, with
47 Mossiville Hydro Power N/A localized area on the South-western
Pvt. Ltd. slopes experiencing rainfall in excess
48 Aqua Power Pvt. Ltd. N/A of 700 mm (Keragala 771 mm). Over
49 Meunex Nahawathura N/A most parts of the island, the amount
Hydro Power Pvt Ltd.
50 Hydro Jet Power Pvt. Ltd. N/A
of rainfall various between 100 and
250 mm, the notable exception being
the Northern Jaffna Peninsula (Jaffna-
78 mm, Elephant pass- 83 mm).5-month long period. Lowest figures are
recorded from Northern and
Southeastern regions.
Source: http://www.meteo.gov.lk/
2. Southwest Monsoon Period
(May to September)
Source: http://www.meteo.gov.lk/
Windy weather during this
monsoon eases off the warmth
that prevailed during the 1st Inter 3. Second Inter-monsoon Period
monsoon season. Southwest (October to November)
monsoon rains are experienced at
any time of the day and night, The thunderstorm-type of rain,
sometimes intermittently mainly particularly during the afternoon or
in the Southwestern part of the evening, is the typical climate during
country. Amount of rainfall during this season. But unlike in the Inter-
this season varies from about 100 monsoon season, the influence of
mm to over 3000 mm. The highest weather system like depression and
rainfall received in the mid- cyclones in the Bay of Bengal is
elevations of the western slopes common during the second
(Ginigathhena- 3267 mm, Intermonsoon season. Under such
Watawala- 3252 mm, Norton- conditions, the whole country
3121 mm). Rainfall decreases experiences strong winds with wide
rapidly from these maximum spread rain, sometimes leading to
regions towards the higher floods and landslides. The second
elevation, and in Nuwara-eliya, it Intermonsoon period of October –
drops to 853 mm. The variation November is the period with the most
towards the Southwestern coastal evenly balanced distribution of rainfall
area is less rapid, with the over Sri Lanka. Almost the entire island
Southwestern coastal belt receives in excess of 400 mm of rain
experiencing between 1000 mm during this season, with the
to 1600 mm of rain during this Southwestern slopes receivinghigher rainfall in the range 750 the minimum is in the Western
mm to 1200 mm (Weweltalawa coastal area around Puttalam (Chilaw-
Estate in Yatiyantota recording 177 mm) during this period.
1219 mm)
Source: http://www.meteo.gov.lk/
Source: http://www.meteo.gov.lk/
Seasonal Rainfall
4. North-East Monsoon Period
(December to February) The rainfall pattern is influenced by
the monsoon winds of the Indian
The dry and cold wind blowing Ocean and Bay of Bengal and is
from the Indian land-mass will marked by four seasons. The first is
establish a comparatively cool, but from mid-May to October, when
dry weather over many parts winds originate in the southwest,
making the surrounding pleasant bringing moisture from the Indian
and comfortable weather except Ocean. When these winds encounter
for some rather cold morning the slopes of the Central Highlands,
hours. Cloud-free skies provide they unload heavy rains on the
days full of sunshine and pleasant mountain slopes and the
and cool night. During this period, southwestern sector of the island.
the highest rainfall figures are Some of the windward slopes receive
up to 250 centimeters of rain per
recorded in the North, Eastern
month, but the leeward slopes in the
slopes of the hill country and the
east and northeast receive little rain.
Eastern slopes of the The second season occurs in October
Knuckles/Rangala range. The and November, the inter-monsoonal
maximum rainfall is experience at months. During this season, periodic
Kobonella estate (1281 mm), andsqualls occur and sometimes
tropical cyclones bring overcast tape. Whenever a developer finds a
skies and rains to the southwest, potential site for a hydropower
northeast, and eastern parts of the project, they must examine the
island. During the third season, feasibility and apply an application for
December to March, monsoon construction to the sustainable
winds come from the northeast, energy Authority (SEA), which would
bringing moisture from the Bay of grant a provisional approval (PA).
Bengal. The northeastern slopes of With the PA, the developer will now
the mountains may be inundated
be applying for a CEB Letter of Intent
with up to 125 centimeters of rain
during these months. Another and Central Environmental Authority
inter-monsoonal period occurs (CEA) environmental approval.
from March until mid-May, with The CEA will refer the application to
light, variable winds and evening another authority serving as Agency
thundershowers. for Project Approval (PAA). The PAA
sets in scope meetings and
government agencies from which the
developer needs to seek project
approval, which will include no
objections from the Grama Sevaka
and Divisional Secretary calling public
meetings. PAA will also provide Terms
of Reference (TOR) for an initial
report on environmental assessments
(IEER).
Source: http://www.meteo.gov.lk/
The developer shall submit the IEER
7.4 Approval Process of a mini- to PAA along with other approvals to
hydro Project be reviewed by the Technical
Assessment Committee (TEC)
Obtaining recognition and appointed by PAA.
approval of a mini-hydro power
project requires lengthy Environmental clearance for the
inspections as outlined below, Energy Permit (EP) shall be given to
and going through loads of red CEA if approved.The developer is required to begin physical construction at the proposed site upon receipt of EP. The developer would submit Public Utility application from the Public Utilities Commission of Sri Lanka (PUCSL) for Energy License and apply for signing a Power Purchase Agreement with the CEB. 7.5 Factors to consider by an investor who is looking to have exposure to the mini hydro sector If an investor is going to purchase an already established plant, the historical generation of the plant or the plant factors need to be considered. Once the technical feasibility of undertaking the project is done, marginal cost and benefit analysis needs to be performed. If only marginal cost of generating 1 Mw is less than the additional revenue it generates, the project is feasible. Most of the locations of the projects are inaccessible and developers need to create roads or upgrade existing footpaths to allow vehicles and equipment for construction. Power generators are very heavy and the operation of the plant requires daily access after completion, therefore proper roads are required.
8. Wind Projects in the
Industry

More than a century ago, wind           generating electrical energy.
turbines first appeared. In the
1830s, after the invention of the       Depending on the size of the turbine
electric motor, engineers began
trying to harness wind energy to        and the length of its blades, the
generate electricity. Wind power        amount of power which can be
generation took place in the United     harnessed from the wind is
Kingdom and the United States in        determined.     The     output     is
1887 and 1888, but in Denmark,          proportional    to    the     rotor's
where horizontal-axis wind turbines     dimensions and to the wind speed
were built in 1891 and a 22.8-metre     cube. In principle, as wind speed
wind turbine began operation in         doubles, the capacity for wind
1897, modern wind power is              power increases by a factor of eight.
considered to have been first
developed.
                                        Wind-turbine capacity has increased
Using the kinetic energy created by     over time. Typical turbines had a
air in motion, wind is used to          nominal capacity of 0.05 megawatts
produce electricity. Using wind
turbines or wind energy conversion      (MW) and a 15-metre rotor
devices, this is converted into         diameter in 1985.
electrical energy. Wind first hits a
turbine’s blades, causing them to       The turbine potential of today's
rotate and turn the turbine             latest wind power projects is around
connected to them. This converts        2 MW onshore and 3-5 MW
kinetic energy into rotational energy   offshore. Commercially available
by rotating a shaft connected to a      wind turbines with rotor diameters
generator and, by electromagnetism      of up to 164 meters have achieved a
                                        capacity of 8 MW. In iron smelting
fucentury B.C., Sri Lanka is the capacity is economically exploitable.
country which first used wind for The Ceylon Electricity Board has
industrial use. established these possible exploitable
wind resources and, along with the
The National Renewable Energy expansion of transmission networks,
Laboratory (NREL) of the USA has prioritized their growth activities.
developed the All Island Wind Energy Harnessing the exploitable wind
Resource Atlas of Sri Lanka in 2003, power potential is then subjected to
suggesting nearly 5,000 km2 of windy various technical constraints such as
areas with good-to-excellent potential power systems stability, power
for wind resources in Sri Lanka. Of the system operation, seasonality and
total windy area, approximately 4,100 variability. This technical potential is
km2 is on land and about 700 km2 is defined by the renewable energy grid
in lagoons. The windy land represents integration study conducted by the
about 6 percent of Sri Lanka's total Ceylon Electricity Board.
land area (65,600 km2). Using a
conservative estimate of 5 MW per In the next 20-year period, Mannar
km2, nearly 20,000 MW of potential and Northern areas will be focused
installed capacity could be provided for wind power development at large
by this windy property. The total scale and the Puttalam, Eastern and
theoretical wind capacity rises to central highland areas are will
approximately 24,000 MW if the contribute to small to medium scale
windy lagoons are included. wind power resource development.
Sri Lanka Sustainable Energy
Sri Lanka is blessed with quality wind Authority has identified resource
energy primarily in the coastal region locations for large scale wind power
of the northwest, the northern and development in Mannar, Jaffna
central highlands. There is a slightly peninsula, Kokilai and Puttalam areas.
higher potential for wind power in There is both public and private
areas exposed to the southwestern participation in the production of
monsoon. For different factors, such these tools, and competitive pricing
as overlapping land uses, accessibility strategies are increasingly being
and environmentally sensitive issues, sought in the production of these
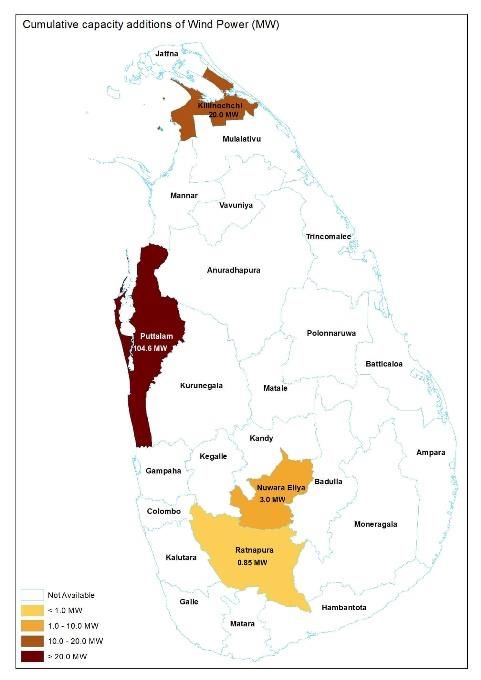
only a fraction of the overall available power projects at present.FIGURE 17 : CUMALATIVE CAPACITY ADDITION OF WIND POWER Source: www.energy.gov.lk TABLE 07 : WIND RESOURCE REGIMES AND EXPECTED ANNUAL CAPACITY FACTORS Wind Regime Annual Capacity Factor(%) Northern 34.1 Mannar 36.7 Puttalam 32.1 Eastern 27.3 Central Highland 19.1 Source: Generation Expansion Plan 2019
TABLE 08: CEB OWNED WIND                             2021    -          50                   400
POWER STATIONS                                                          (10 MW X 5Nos. -
Power Station     Capacity (in MW) Year of                              Trincomalee,
                                   Commissioning                        Monaragala,
Mampur            10.000          May,2010                              Kilinochchi…)
Seguwanthivu      10.000          May,2010           2022    -          290                  290
Vidatamuna        10.000          July,2010
                                                                        Pooneryn 240
                                                                        MW Mannar 50
Willpita          0.150           Oct,2010
                                                                        MW
Nirmalapura       10.000          Oct, & Jul,2012   2023      -          160 MW              160
Uppu Daluwa        10.000          July,2012
                                                                         (Mannar 60
Madurankuliya      10.000          July,2012
                                                                         MW, Mannar
Ambewaka-Ace       3.000           Aug,2012                              mainland 100
Wind                                                                     MW)
Total Wind         73.040         As at Dec,.2012   2024      -          50                  50
                                                                         (Kokilai - 50
                                                                         MW)
Source : Powermin.gov.lk                            2025      5          130                 135
                                                                         (Puttalam - 100
Wind power plants with a total                                           MW, Jaffna - 30
capacity of 210 MW will be added                                         MW)
in 2020, 2022 and 2023. Other                       Total     5          800                 805
wind power plants will be added
                                                    Source: Renewable Energy Development Plan Phase I
giving priority to the areas with
high wind energy resource
potential identified in the RE
resource inventory. A pilot project
on offshore wind energy will be
connected to the national grid in
2025.
TABLE 09 : WIND POWER
CAPACITY ADDITION
                    Capacity (MW)
         Offsho     Onshore             Total
         re
 2019    -          20                  95
                    (Chinaka -10 MW
                    x2 Nos.)
 2020    -          100                 100
                    (Mannar-100 MW)
9. Solar Power Projects in
the Industry
Solar power generation has come a countries such as Bangladesh,
long way from its inception and is making solar rooftop projects more
now becoming a very competitive appropriate for Sri Lanka.
renewable energy source. Solar
power can be generated using many
methods and the most common and While the government of Sri Lanka
environmentally friendly alternative has not been able to promote solar
is photovoltaic (PV) panels. rooftop projects until recently,
several private companies have
Both rooftops and solar farms will
install PV panels. Solar farms are successfully carried out their own
desirable choices for countries with projects in their factories and office
large open land areas, such as the buildings. At their fabric park in
Middle East, Australia and North Thulhiriya, MAS Holdings has
America. But it isn't a feasible choice completed a 1 MW solar rooftop
for an island nation and a project. With a 1.3 MW rooftop
biodiversity hotspot like Sri Lanka solar project to power the famous
with restricted land resources. HNB buildings of Colombo, 249 HNB
Rooftop solar systems, on the other customer centers throughout the
hand, reuse existing government
rooftops and private office island and seven solar-only
buildings, factories, and residential branches, Hatton National Bank
houses. They have no negative followed up.
environmental consequences, can
be easily installed in a very short
time. Excess power from on rooftop
solar panels can be fed back to the
national grid. Rooftop solar projects
also provide the benefit of being
able to install grid off in rural areas,
as seen in9.1 Solar Power Projects other than solar parks. Monaragala,
Undertaken by CEB Pooneryn, Polonnaruwa and
Mahiyanganaya have been identified
TABLE 10: CEB OWNED SOLAR for establishing solar parks.
POWER STATIONS Out of these, 100 MW from
Monaragala and 130 MW from
Power Capacity Year of Commissioning
Station (in MW) Pooneryn will be added by 2021. 100
Battaramull 0.018 Jan,2002 MW each will be added from
a Polonnaruwa, Monaragala and
Gannoruwa- 0.500 April,2011
Mahiyanganaya in the period 2023-
2
Thiruppane 0.123 July,2011 2025. Apart from these, Maduru Oya
Gannoruwa- 0.737 Aug.,2011 floating solar project will be added in
1 2021. Solar roof top systems will be
Total Solar 1.378 As at Dec,.2012 added through the Soorya Bala
Sangramaya project.
Source: Powermin.gov.lk
TABLE 11 : SOLAR POWER
9.2 Solar Power Plants Capacity CAPACITY ADDITION
Additions Ca
pa
cit
According to Renewable Energy y
Development Plan Phase I 2019- (M
W)
2025, 25 projects of 1 MW X 60 Large Roo Float Total
Nos.solar power tender were added ftop ing
in 2019, and the balance will be 2019 25 70 - 95
added in 2020. Projects under 1 MW (1 MW x 25 Nos.)
2020 129 30 - 159
X 90 Nos. solar power tender will be (Valachchenei - 10 MW,
added in 2020, 2021 and 2022. Vaunathivu – 10
Further, the already tendered 10 MW, Pooneryn – 80 MW, 1
MW X 29 Nos.)
MW projects of Valachchanai and 2021 270 30 100 400
Vaunathivu will be added in 2020. (Monaragala – 100 MW,
Apart from these, a total capacity of Pooneryn – 50 MW,
1 MW X 50 Nos., 70 MW
360 MW will be added from 2021 to from other projects)
2025 from this type of projects2022 90 26 15 31
penetration on small scale and top
(1 MW x 20 Nos., 70
MW from other roof.
projects)
2023 180 MW 25 15 220 In Sri Lanka, in 2010, the Ministry of
(Monaragala – 100 MW,
80 MW from other
Power and Renewable Energy, Ceylon
projects) Electricity Boards (CEB) and Lanka
2024 170 MW 40 50 265 Electric Company (LECO) launched the
(Polonnaruwa – 100
MW, 70 MW from other
'Energy Banking Facility' for such
projects) micro-scale generating facilities,
2025 170 MW 104 20 294 generally known as the 'Network
(Mahiyanganaya – 100 Energy Metering Facility' for
MW, 70 MW from other
projects) electricity consumers. This scheme
Total 1034 330 200 1564 requires any user of electricity to
engage as a producer in the
Source: Renewable Energy Development Plan Phase I production of electricity from a
source of renewable energy for their
own use and in the export of any
9.3 Development of Rooftop Solar surplus energy. The installed capacity
Power of the generating facility shall not
surpass the customer's contractual
Roof top solar systems are beginning requirement. Consumers are not
to play a prominent role in providing charged for energy exports, but are
electricity consumers with energy compensated (in kWh) for consuming
needs and it is an efficient type of the same amount of energy over
embedded generation located at the subsequent billing periods. No
end user. financial compensation is paid out for
the consumer's surplus energy
With the availability of rooftop exported. Taking into account the
spaces, rooftop solar PV installations difference between the import and
can significantly reduce land use and the export of energy, the electricity
environmental issues, especially in bill is prepared. At present, under a
urban and suburban areas. Several net metering scheme amounting to
schemes are introduced around the 106 MW of solar power, the country
world to create an enabling has around 14,700 such installations.
environment for photovoltaicYou can also read