Assessment of Ambient Air Quality of Mosul City/Iraq Via Air Quality Index
←
→
Page content transcription
If your browser does not render page correctly, please read the page content below
Journal of Ecological Engineering
Journal of Ecological Engineering 2021, 22(10), 241–250 Received: 2021.08.16
https://doi.org/10.12911/22998993/142448 Accepted: 2021.09.17
ISSN 2299–8993, License CC-BY 4.0 Published: 2021.10.01

Assessment of Ambient Air Quality of Mosul City/Iraq
Via Air Quality Index

Abdulmuhsin S. Shihab1
1
 Mosul University, Environmental Research Centre, Mosul, Iraq
 e-mail: mss_qzz@uomosul.edu.iq

ABSTRACT
The research aimed to assess air quality in Mosul city (Iraq) using air quality index (AQI). The data were collected
at six monitoring sites using two stations, one fixed and the other is mobile type. The concentrations of CO, NO2,
O3, SO2 and PM10 were measured. The daily AQI were calculated for each site and classified to AQI categories ac-
cording to USEPA approach. The dominant AQI category at the public library site fluctuated between “Moderate”
to “Unhealthy for Sensitive Groups”. AQI undergoes seasonal variation with lower value at March. The results
showed that PM10 is the main contributor for AQI determination in Mosul city with 93.8%. CO has no contribution
to Mosul AQI. SO2, O3 and NO2 have little contribution to Mosul AQI with 0.8%, 2.7% and 2.7% respectively.
The annual mean of AQI in the public library site/ Mosul city is 96 in the category “Moderate. The worst site was
Mosul municipality (old location) with a dominant category “Unhealthy for Sensitive Groups”.

Keywords: AQI, Mosul city, air quality, PM10, ozone, NO2, SO2, CO

INTRODUCT ION quality index (AQI) has been suggested by En-
 vironmental Protection Agency (EPA) [1999]
 Air pollution is an environmental threat as- and the procedure was later updated and defined
sociated with urban areas around the world. Epi- in terms of main air pollutants: Carbon monox-
demiological studies have linked between higher ide (CO), Nitrogen dioxide (NO2), Ozone (O3),
ambient levels of air pollutants and adverse health particulate matter (PM) and Silver dioxide (SO2)
effects, such as respiratory, cardiovascular dis- [EPA, 1999; EPA, 2009].
ease, coronary heart disease and mortality [Brook Air Quality Index (AQI) is a valuable tool to
et al., 2012; Hoek et al., 2013; Achilleos et al., indicate the levels of daily air pollutants from a
2017]. Additionally, air pollution continues to public health point of view. It is an alert to the
present one of the world’s biggest health hazards public in terms of health impact. AQI values var-
to people everywhere, contributing to about 7 ies from “0” to “500” and its value is proportional
million premature deaths annually [WHO 2020]. to the concentrations of the pollutants in the air.
 Numerous pollutants are monitored by each Thus, greater AQI indicates more serious health
station and daily or hourly concentrations are col- complications. The overall range is subdivided
lected in urban areas. As a results, air monitoring into six ranges to which six categories of air qual-
stations provide a large mass of data. Therefore, ity is relate (Table 1).
the presentation of these data to the population Many researchers had calculated AQI estab-
and their interpretation by public agencies is a lished by USEPA to analyze the daily air quality
difficult task. In addition, air quality is exhibited [Choi et al., 2015; Verma et al., 2016]. Mosul city
in different manners using different interpretation as the largest population community in Northern
criteria, which is usually not clear. Therefore, a Iraq, suffers from lack of air quality studies. This
need is arise to make an index of air quality with town includes 317000 vehicle and 3147 electri-
respect to its effects on human health. A daily air cal generators. The importance of conducting this

 241
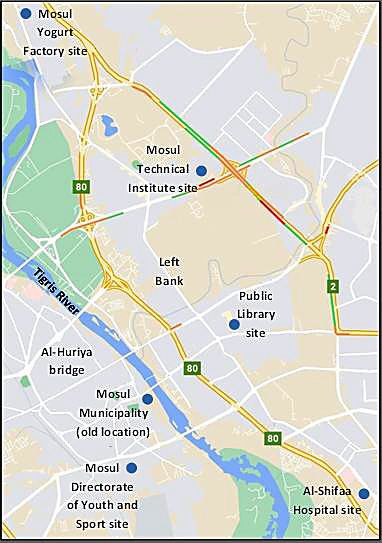
Journal of Ecological Engineering 2021, 22(9), 241–250

Table 1. Categories of air based on air quality index [EPA 2009]
 Air quality index range Air quality condition Color code
 0-50 Good Green
 51-100 Moderate Yellow
 101-150 Unhealthy for sensitive groups Orange
 151-200 Unhealthy Red
 201-300 Very unhealthy Purple
 >300 Serious Maroon

study arises, as it will identify the category of air and two sites at the right bank of the city: “Mo-
quality with respect to its effects on human health sul Municipality (old location)” and “Directorate
and presented in a clear manner. Air pollution of Youth and Sport” (Figure 1). Two monitoring
has been studied in Mosul city. The earlier stud- stations were used to collect concentrations of air
ies focused on dustfall and suspended particulate quality pollutants. One station is stationary type
distribution of PM50 [Shihab et al., 2010; Shihab Horiba (German made) at the public library site
and Taha, 2014]. After that, Al-Jarrah [2015] along the study period, while the other station
conducted a study to identify the levels of pollut- is mobile type Teledyne (American made). The
ants concentrations within the largest population mobile station was moved among the sites ex-
community in Northern Iraq, Mosul city. Further- cept the public library site along the study period.
more, Shihab and Al-Jarrah [2015] investigated These stations belongs to Ninavah Environment
the levels of ozone and nitrogen oxides includ- Directorate.
ing their relationships with metrological factors. The concentrations of CO, NO2, O3, SO2 and
In Iraq, Mohamed et al. [2016] studied AQI in PM10 were measured. The devices in the station
Kirkuk city/ Iraq, while Shehabalden and Azeez are calibrated automatically using span gases
[2017] studied AQI in Basra province/ Iraq. and zero gas. The measurements were conducted
 The objective of this research to use air qual- every three minutes and then the average of 30
ity index in analyzing air quality parameters in
Mosul city for the first time.

MATERIALS AND METHODS

Study site
 Mosul is a major city in Northern Iraq, serv-
ing as the capital of Nineveh Governorate. Ap-
proximately 400 km north of Baghdad, with an
area of 180 km2 and a population of 2,443,861
[Iraqi Ministry of Planning 2021]. Mosul lies on
both the left bank (East side) and the right bank
(West side) of the Tigris river. Mosul city has a
semi-arid climate with extremely hot, prolonged,
dry summer, mild autumn and spring and mod-
erately wet cool winter. The dominant wind di-
rection in the study area is NW with 17.2% calm
conditions [Al-Jarrah 2015].

Air quality monitoring sites
 The study includes six monitoring sites in
Mosul city. Four sites at the left bank of the city:
“Public Library”, “Mosul Technical Institute”, Figure 1. Air quality monitoring sites
“Al-Shifaa Hospital” and “Mosul Yogurt Factory” distributed on Mosul city map

242
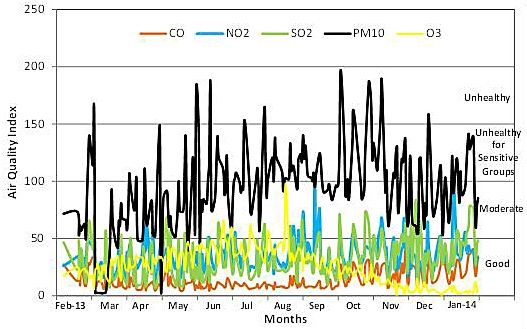
Journal of Ecological Engineering 2021, 22(9), 241–250

minutes was calculated. The surveillance opera- sites. A comparison of AQI was conducted be-
tion was continued from Feb 2013 till Jan 2014. tween the public library site and other sites us-
 ing unpaired t-test.
Air quality index
 Air quality index (AQI) was calculated by us- RESULTS AND DISCUSSION
ing equation (1) which proposed by the USEPA
(EPA, 2009). The trend of AQI in Mosul city at the public
 I − I library site shows a decrease or an improvement
 I = (C − BP ) + I (1) in March 2013, followed by a gradual increase till
 BP − BP
 September, AQI exhibited a decrease (Figure 2).
where: Ip – the index of pollutant p, In October and November, a slight increase oc-
 =Cp
 – the( rounded concentration of pollut-
 , 2 , 3 , 2 , 10 ) curred, followed by a decline in November and
 ant p, December and an increase in January 2014 (Win-
 BPHi – the break point that is greater than ter). The decrease is due to the low concentration
 or equal to Cp, of PM10 with the growth of green cover in March,
 BPLo – the break point that is less than or while the start of rainfall season in November and
 equal to Cp, December improved AQI in this period. The pol-
 IHi – the AQI value corresponding to BPHi lutants sub-indices (Figure 3) illustrate clearly the
 ILo – the AQI value corresponding to BPLo prevalence of PM10 in deteriorating AQI among
 other pollutants along the study period. The main
 The daily moving average according to the
 contributor to PM10 is the diesel vehicles like bus-
break point values must be calculated (CO 8 hr
 es and trucks as this site is located at two way
avg.), (NO2 1 hr avg.), (O3 8 hr avg.), (SO2 1 hr
 road-side. The improvement in AQI was also no-
avg.) and (PM
 I 10−24I
 hr avg.) to be used in the cal-
 ticed at March in Baghdad city, the capital of Iraq
 I =of AQI.
culation (C − BP ) + I
 BP − BP [Hashim et al. 2021].
 The value of the highest sub-indices AQI is
 Table 2 shows that August is the most pol-
considered the AQI of the site (eq. 2).
 luted month with 24 unhealthy days (AQI>100)
 = ( , 2 , 3 , 2 , 10 ) (2) all for PM10. On the other hand, March recorded
 the lowest polluted month with 3 unhealthy days
Statistical analysis only for PM10.
 The monthly frequencies of AQI categories,
 The daily AQI were analyzed statisti- for public library site where high vehicular traffic
cally by calculating the descriptive statistics is present, are shown in Figure 4. The monthly
for each month: mean, median, minimum and frequency of the category “Good” varied be-
maximum. The frequency and percentage of tween 0% to 45%. For the category “Moderate”,
AQI categories were found for the studied it fluctuated from 22.2% to 71.4%. The category

 Figure 2. AQI along the study period in the public library site

 243
Journal of Ecological Engineering 2021, 22(9), 241–250

 Figure 3. Daily variation of pollutants sub-indices along the study period in the public library site

Table 2. The number of unhealthy days (AQI >100) according to type of pollutant and month along the study
period
 Month CO NO2 SO2 O3 PM10 Total
 Feb-13 0 0 0 0 6 6
 Mar 0 0 0 0 3 3
 Apr 0 0 0 0 8 8
 May 0 0 0 0 7 7
 Jun 0 0 0 0 13 13
 Jul 0 0 0 0 14 14
 Aug 0 0 0 0 24 24
 Sep 0 1 0 0 15 16
 Oct 0 0 0 0 20 20
 Nov 0 0 0 0 22 22
 Dec 0 0 0 0 10 10
 Jan-14 0 2 0 0 14 16
 Total 0 3 0 0 156 159

“Unhealthy for sensitive groups” varied between “Moderate” fluctuated from 5.3% to 61.1%. The
5.0% to 77.8%, while the category “Unhealthy” frequency of AQI category “Unhealthy for sensi-
varied between 0.0% to 28.6%. It seems that the tive groups” ranged between 22.2% to 42.1%. The
dominance fluctuated between the categories other categories of AQI: “Unhealthy”, “Very Un-
“Moderate” and “Unhealthy for sensitive groups”. healthy” and “Hazardous” all appear in this site
These results justify the effect of vehicular traffic with frequency percentages 0–31.6%, 0–15.8%
and the wind in this location. and 0–5.3% respectively with unclear dominance
 For the mobile station located in Mosul yo- for any category, while these results showed that
gurt factory site North of Mosul city at February air quality in this site was poor.
and March, the category of AQI “Good” ranged For the results of air quality at Mosul Techni-
between 42.1% to 46.7%. The category “Mod- cal Institute site (Figure 5), the frequencies of cat-
erate” varied between 42.1% to 53.3%. On the egory “Good” varied between 20.0–31.5% versus
other hand, the categories “Unhealthy for sensi- 42.1–75.0% for “Moderate”. Furthermore, the
tive groups” and “Unhealthy” varied from 0% to category “Unhealthy” has a frequency of 5.0%.
10.5% and 0.0% to 5.3% respectively. It looks The other categories were not found. The domi-
like the dominance shared between the categories nance was for the category “Moderate” in this site
“Good” and “Moderate” (Figure 5). at April and May. For Mosul Municipality (old lo-
 In Al-Shifaa Hospital site, South Mosul city, cation) site, the category “Good” appears only in
the category “Good” varied between 0.0% to December with a frequency of 5% (Figure 6). The
16.7% (Figure 5). On the other hand, the category categories “Moderate”, Unhealthy for sensitive

244
Journal of Ecological Engineering 2021, 22(9), 241–250

 Figure 4. Monthly frequencies of AQI categories in public library site

 Figure 5. The monthly frequencies of AQI categories in the sites Mosul
 yogurt factory, Al-Shifaa hospital and Mosul technical institute

 Figure 6. The monthly frequencies of AQI categories in the sites Mosul
 municipality (old site) and Ninevah directorate of youth and sport

groups” and “Unhealthy” occurred at frequencies For the Directorate of youth and sport site at
0–50.0%, 40.0–93.3% and 0–21.1% respectively. the right side of Mosul city, AQI categories distrib-
The results recognize the category “Unhealthy for uted between “Moderate” with 42.1% and “Un-
sensitive group” as dominant for the site with the healthy for sensitive groups” with 57.9% at Janu-
worse air quality among other sites. ary 2014 (Figure 6). From the results of AQI in the

 245
Journal of Ecological Engineering 2021, 22(9), 241–250

studied sites, it appears that the category “Moder- The annual contribution percentages of pol-
ate” is more dominant. Additionally, the category lutants in AQI show that the deterioration of air
“Unhealthy for sensitive groups” was dominant quality in Mosul city is mainly belongs to high
at Mosul municipality (old location) site. A com- concentration of PM10 with 93.8% (Figure 7).
parison of these results with other studies, like a CO has no contribution to AQI, while SO2, O3
study conducted in Catania/ Italy for municipal and NO2 has little contribution to AQI at 0.8%,
sites, the dominance was for the category “Good” 2.7% and 2.7% respectively. There is no inter-
[Lanzafame et al. 2015]. A study at Kirkuk city est in creating the green areas and take care of
rich with oil showed that air quality index falls in them in addition to the effect of diesel vehicles
the category “Unhealthy” due to NO2 concentra- especially buses. In Saudi Arabia, Al-Harbi et al.
tion [Mohamed et al. 2016]. In South Iraq/ Basra [2014] found that 71% of time Riyadh city air is
province, the category “Unhealthy for sensitive of “Good” category, while 74% of the remaining
groups” was dominant due to high concentration 29% is caused by PM10. In India/ Kodinar Gujrat,
of total suspended particulates [Shehabaldain and a study of AQI found air quality in the catego-
Azeez 2017]. In Bahrain, a study found air quality ries from “Moderate” to “Unhealthy for sensitive
dominant in the category “Moderate” in January, groups” due to the high concentration of PM10
while the dominance changed to “Unhealthy for [Chaurasia et al. 2013].
sensitive groups” in August as PM10 showed high Figure 8 presents the contribution of the pol-
concentration [Jassim and Coskuner 2017]. lutants in determining AQI as percentage in the
 public library site. With respect to winter months
 (December to February), PM10 is dominant and
 accounts for 98.2% of AQI determination on
 average. These results corresponds to the find-
 ings of Al-Awadhi [2019] in Kuwait who found
 PM10 to be the more contributor to AQI and to
 Motesaddi et al. [2017] in Tehran who found the
 same results. In spring (March to May), PM10 still
 dominant with a lesser percentage, which contrib-
 uted 81.6% to AQI determination followed by O3
 which accounts for 8.3% of AQI determination.
 The possible appearing of O3 contribution may
 be due to the longer duration of solar radiation
 and temperature increase in spring [Chuturkova
 2015]. In summer months (June to August), PM10
 Figure 7. Distribution of air pollutants according prevailing the contribution of other pollutants
 to their annual contribution to air quality index especially O3, which accounts for an average of
 for public library station Feb-13 to Jan-14 98.2% of AQI determination. This may be due to

 Figure 8. Percentage of pollutants contribution in determining AQI value

246
Journal of Ecological Engineering 2021, 22(9), 241–250

the lack of green spaces around the town and to compared with Yogurt factory site in February
diesel vehicles. In autumn (September to Novem- and with Mosul Technical Institute site in May.
ber), PM10 still the dominant contributor to AQI On the other hand, AQI in the sites Al-Shifaa
determination with 98.5%. It appears that the Hospital site and Mosul Municipality (old loca-
effect of green spaces lack with high PM10 over- tion) site showed a significant increase than AQI
comes the other air quality pollutants. in Public Library site at July and August respec-
 Descriptive statistics of AQI for the studied tively. The other comparisons with Public Library
sites in Mosul city according to site and month site shows non-significant difference. This may
are shown in Table 3. For the fixed station at the be due to the effect of wind direction as each site
public library, there is a significant difference has different wind direction which increase the
among the monthly AQI values (p0.05*
 May-13 85.3 74.2 47.1- 181.9 62.52 56.7 43.2- 110.7 0.005
 Jun-13 100.2 88.2 48.0- 187.7 80.03 75.4 37.6- 134.9 >0.05*
 Jul-13 100.5 99.0 58.3- 163.4 176.53 158.0 87.2- 448.5 0.05*
 Nov-13 112.2 113.1 61.5- 187.5 102.24 103.1 58.4- 139.9 >0.05*
 Dec-13 85.9 80.4 53.2- 157.2 98.94 98.0 42.1- 153.5 >0.05*
 Jan-14 102.2 103.0 59.5- 141.5 100.75 109.4 50.8- 143.9 >0.05*
1
 Yogurt factory site, 2 Mosul Technical Institute site, 3 Al-Shifaa Hospital site, 4 Mosul Municipality (old location)
site, 5 Directorate of Youth and Sport site. * No significant difference. # Significant difference among monthly AQI
by ANOVA test p
Journal of Ecological Engineering 2021, 22(9), 241–250

according to site. It was in the categories: “Good” 100%, while the highest percentages for “Moder-
with a percentage between 78.8–100%, “Moderate” ate” and “Unhealthy for sensitive groups” catego-
with a percentage between 0.0–15.8% and “Un- ries were recorded in the directorate of youth and
healthy for sensitive groups” between 0.0–5.3%. sports” site with 15.8% and 5.3% respectively.
The highest percentage of the category “Good” Ozone falls in “Good” category at percent-
for NO2 was recorded in the sites Al-Shifaa Hospi- age between 83.8–100% according to site, with
tal site and Mosul Technical Institute at a value of highest percentage of 100% recorded at the sites

Table 5. Percentage of Sub-indices of AQI according to the categories in the public Library site
 Pollution Categories CO 8hr NO2 1hr O3 8hr SO2 1hr PM10 24hr
Good 100.0 88.9 96.9 96.9 7.1
Moderate 0 10.2 3.1 18.1 50.0
Unhealthy for sensitive group 0 0.9 0 0 37.1
Unhealthy 0 0 0 0 5.8
Very Unhealthy 0 0 0 0 0
Hazardous 0 0 0 0 0

Table 6. Percentage of Sub- indices of AQI according to the categories in the Mosul Municipality (old location) site
 Pollution Categories CO 8hr NO2 1hr O3 8hr SO2 1hr PM10 24hr
Good 100.0 92.5 98.9 58.1 2.2
Moderate 0 6.4 1.1 38.7 32.2
Unhealthy for sensitive group 0 1.1 0 2.1 60.2
Unhealthy 0 0 0 1.1 5.4
Very Unhealthy 0 0 0 0 0
Hazardous 0 0 0 0 0

Table 7. Percentage of Sub- indices of AQI according to the categories in the Yogurt factory site
 Pollution Categories CO 8hr NO2 1hr O3 8hr SO2 1hr PM10 24hr
Good 100.0 94.1 100.0 100.0 47.1
Moderate 0 5.9 0 0 44.1
Unhealthy for sensitive group 0 0 0 0 5.9
Unhealthy 0 0 0 0 2.9
Very Unhealthy 0 0 0 0 0
Hazardous 0 0 0 0 0

Table 8. Percentage of Sub-AQI according to the categories in the Al-Shifaa hospital site
 Pollution Categories CO 8hr NO2 1hr O3 8hr SO2 1hr PM10 24hr
Good 100.0 100.0 83.8 91.9 8.1
Moderate 0 0 16.2 8.1 32.4
Unhealthy for sensitive group 0 0 0 0 32.5
Unhealthy 0 0 0 0 16.2
Very Unhealthy 0 0 0 0 8.1
Hazardous 0 0 0 0 2.7

Table 9. Percentage of Sub- indices of AQI according to the categories in the Technical institute/Mosul site
 Pollution Categories CO 8hr NO2 1hr O3 8hr SO2 1hr PM10 24hr
Good 100.0 100.0 94.9 100.0 30.8
Moderate 0 0 5.1 0 53.8
Unhealthy for sensitive group 0 0 0 0 12.8
Unhealthy 0 0 0 0 0.0
Very Unhealthy 0 0 0 0 2.6
Hazardous 0 0 0 0 0

Table 10. Percentage of Sub- indices of AQI according to the categories in the Sports and Youth Directorate site
 Pollution Categories CO 8hr NO2 1hr O3 8hr SO2 1hr PM10 24hr
Good 100.0 78.9 100.0 73.7 0.0
Moderate 0 15.8 0 15.8 47.4
Unhealthy for sensitive group 0 5.3 0 10.5 52.6
Unhealthy 0 0 0 0 0
Very Unhealthy 0 0 0 0 0
Hazardous 0 0 0 0 0

248
Journal of Ecological Engineering 2021, 22(9), 241–250

Directorate of youth and sport and Yogurt fac- Acknowledgement
tory. While, O3 falls in “Moderate” category at
a maximum percentage of 16.2% in the site Al- The author is very grateful to Mosul Univer-
Shifaa Hospital. Sulfur dioxide falls with cat- sity/ Environmental Research Center for their
egory “Good” at percentages 58.1–100% in the funding this work and providing the facilities
studied sites. The highest percentage of 100% which helped to improve the quality of this work.
was recorded in two sites: Yogurt factory and
Mosul technical institute. On the other hand,
the minimum percentage of category “Good” of REFERENCES
58.1% was recorded in Mosul municipality (old
 1. Achilleos S., Kioumourtzoglou M.-A., Wu C.-D.,
location) site. In addition, SO2 falls in the cate-
 Schwartz J.D., Koutrakis P., Papatheodorou S.I.
gories “Moderate” and “Unhealthy for sensitive 2017. Acute effects of fine particulate matter con-
groups”. The highest percentage of “Moderate” stituents on mortality: A systematic review and
was recorded in the Mosul municipality (old meta-regression analysis. Environment Interna-
location) site with 38.7% and 10.5% for “Un- tional, 109, 89-100.
healthy for sensitive groups” at Directorate of 2. Al-Awadhi, J.M. 2014. Measurement of air pollu-
youth and sports site. tion in Kuwait city using passive samplers. Atmo-
 PM10 records the lowest percentage of “Good” spheric and Climate Sciences, 4, 253-271.
category in the studied sites among other pollut- 3. Alharbi B.H., Pasha M.J., Tapper N. 2014. Assess-
ants. It ranged between 0.0% at Directorate of ment of ambient air quality in Riyadh City, Saudi
youth and sports to 47.1% at Yogurt factory site. Arabia. Current World Environment, 9(2), 227-236.
For “Moderate” category, Technical institute site 4. Al-Jarrah O.A.I. 2015. The Levels of Some Air
recorded the maximum percentage of 53.8%. All Pollutants in Selected Sites of Mosul City, and Its
the categories of air pollution were recorded in Relationship with the Traffic Volume and Meteo-
the Al-Shifaa hospital site from “Good” at 8.1% rological Factors. M.Sc. Thesis, Mosul University,
to “Hazardous” at 2.7%. Iraq, [In Arabic].
 5. Brook R.D., Franklin B., Cascio W., Hong Y., How-
 ard G., Lipsett M., Luepker R., Mittleman M., Samet
CONCLUSIONS J., Smith S.C. 2012. Air pollution and cardiovascular
 disease. Thrombosis Research. 129(3), 230-234.
 AQI undergoes seasonal variations along 6. Chaurasia S., Karwaria A., Gupta A. 2013. Air Pol-
the year. The lower values of AQI was recorded lution and air quality index of Kodinar Gujrat, India.
in March, while the higher values of AQI was International Research Journal of Environment Sci-
recorded in October. AQIs values along the year ences, 2(5), 62-67.
was distributed mainly in the categories “Mod- 7. Choi J., Park Y.S., Park, J.D. 2015. Development of
erate” and “Unhealthy for sensitive group”, an aggregate air quality index using a PCA-based
while few values fall in the categories “Good” method: A case study of the US transportation sec-
 tor. American Journal of Industrial and Business
and “Unhealthy”. The dominance category var-
 Management, 5(2), 53-65.
ied from “Good” to “Moderate” at yogurt fac-
tory site, “Moderate” to “Unhealthy for sensi- 8. Chuturkova R. 2015. Ozone and ozone precursors
 in urban atmosphere. Journal Scientific and Applied
tive group” in public library site, “Moderate” at
 Research, 8, 31-40.
Mosul technical institute, and “Unhealthy for
 9. EPA (United States Environmental Protection
sensitive group” at Mosul municipality (old lo-
 Agency) 1999. Guidelines for the reporting of
cation) site. PM10 was the main contributor for daily air quality-the air quality index (AQI), EPA-
AQI determination in Mosul city. 454/B-06-001. U.S. Environmental Protection
 Ozone, Carbon monoxide and NO2 had Agency, Washington, DC
very little contribution to air pollution in Mo- 10. EPA (United States Environmental Protection Agen-
sul city. The mean annual AQI in Mosul city cy) 2009. Technical assistance document for report-
was 96.0 in the category “Moderate”. The sub- ing of daily air quality-the air quality index (AQI).
indices of AQI for PM10 falls in the “Moder- EPA-454/B-09-001. U.S. Environmental Protection
ate” category then “Unhealthy for sensitive Agency, North Carolina.
group”, while other pollutants falls in the cat- 11. Hashim B.M., Al-Naseri S.K., Al-Maliki A., Al-
egory “Good”. Ansari N. 2021. Impact of COVID-19 lockdown on

 249
Journal of Ecological Engineering 2021, 22(9), 241–250

 NO2, O3, PM2.5 and PM10 concentrations and assess- 17. Shehabalden S.H., Azeez N.M. 2017. Air quality
 ing air quality changes in Baghdad, Iraq. Science of index over Basra Province, south of Iraq. Interna-
 the Total Environment 754, No. 141978. tional Journal of Technical Research and Applica-
12. Hoek G., Krishnan R.M., Beelen R., Peters A., Ostro tions, 5(2), 112-114.
 B., Brunekreef B., Kaufman J.D. 2013. Long-term 18. Shihab A.S., Al-Jarrah O.A.I. 2015. The levels of
 air pollution exposure and cardio-respiratory mor- ozone and nitrogen oxides and its relationship with
 tality: A review. Environmental Health, 12(1), 1-16. metrological factors. Al-Rafidain Engineering Jour-
13. Iraqi Ministry of Planning, Central System of Statis- nal, 23(4), 98-109 [In Arabic].
 tics, 2021 (cosit.gov.iq). Jassim M.S., Coskuner G. 19. Shihab A.S., Fadhil M.N., Jumaa O.K 2010. Dis-
 2017. Assessment of spatial variations of particulate tribution of dustfall in selected sites in Mosul city
 matter (PM10 and PM2.5) in Bahrain identified by and around it/ Iraq. Tishreen University Journal for
 air quality index (AQI). Arabian Journal of Geosci- Scientific Researches and Studies, Engineering Se-
 ences 10(1), 19. ries, 32(6), 191-203.
14. Lanzafame R., Monforte P., Patanè G., Strano S. 20. Shihab A.S., Taha A.T. 2014. Suspended particulate
 2015. Trend analysis of air quality index in Catania levels in the left bank residential areas of Mosul city
 from 2010 to 2014. Energy Procedia 82, 708-715. and its relation with some metrological factors. Al-
15. Mohamed Z.B., Mohamed G.H., Salah S.A.H. Rafidain Engineering Journal, 22(3), 158-.
 2016. Air Quality Index (AQI) for Kirkuk City. 21. Verma M.K., Patel A., Sahariah B.P., Kant J.C.
 Kirkuk University Journal /Scientific Studies (KU- 2016. Computation of air quality index for major
 JSS), 11(1), 185-201. cities of Chhattisgarh state. Environmental Claims
16. Motesaddi S., Yalda Hashempour Y., Nowrouz P. Journal, 28(1), 1-11.
 2017. Characterizing of Air Pollution in Tehran: 22. WHO (World Health Organization). 2020 world air
 Comparison of Two Air Quality Indices. Civil En- quality report. https://www.iqair.com (Assessed on
 gineering Journal, 3(9), 749-758. 19.8.21).

250
You can also read