Assessment of air quality during lockdowns in Delhi - THE ENERGY AND RESOURCES INSTITUTE - TERI

 
CONTINUE READING
Assessment of air quality during lockdowns in Delhi - THE ENERGY AND RESOURCES INSTITUTE - TERI
Assessment of air quality
during lockdowns in Delhi

                  THE ENERGY AND
                  RESOURCES INSTITUTE
 Creating Innovative Solutions for a Sustainable Future
Assessment of air quality during lockdowns in Delhi - THE ENERGY AND RESOURCES INSTITUTE - TERI
Assessment of air quality
during lockdowns in Delhi
                                              SUPPORTED BY
                                   BLOOMBERG PHILANTHROPIES

                   THE ENERGY AND
                   RESOURCES INSTITUTE
  Creating Innovative Solutions for a Sustainable Future
Assessment of air quality during lockdowns in Delhi - THE ENERGY AND RESOURCES INSTITUTE - TERI
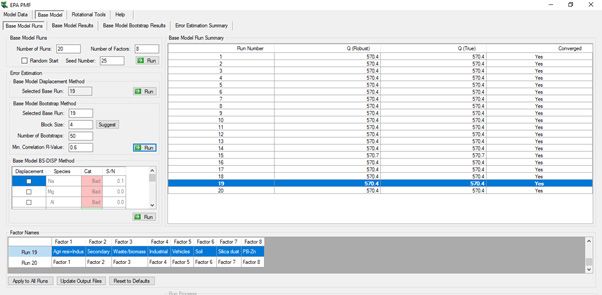
© The Energy and Resources Institute 2021

Suggested format for citation

T E R I. 2021

Assessment of air quality during lockdowns in Delhi

New Delhi: The Energy and Resources Institute.

Disclaimer

The opinions expressed do not necessarily reflect those of Bloomberg Philanthropies nor should they be attributed
to the organization.

For more information

Project Monitoring Cell
TERI                      Tel. 2468 2100 or 2468 2111
Darbari Seth Block      E-mail sumits@teri.res.in
IHC Complex, Lodhi Road    Fax 2468 2144 or 2468 2145
New Delhi – 110 003       Web www.teriin.org
India		 India +91 • Delhi (0)11
ASSESSMENT OF AIR QUALITY DURING LOCKDOWNS IN DELHI

TEAM                                                       ACKNOWLEDGEMENTS
Project Investigator: Dr. Sumit Sharma                     We thank Bloomberg Philanthropies for their support
                                                           to carry out this work. We thank CPCB for providing data
Team Members: Suresh R, Shivang Agarwal, Arindam
                                                           on air quality. We finally thank the reviewers for their
Datta, Prabhat Sharma, Md. Hafizur Rahman, Surender
                                                           constructive peer-review and suggestions to improve
Singh Negi, Moqtik Bawase (ARAI), Yamini Patil (ARAI)
                                                           the quality of report.
Reviewer: Dr. Manos Manousakas (PSI, Switzerland),
Prof. Prateek Sharma (TERI SAS), Dr. Ajay Mathur (TERI),
Prof. Mukesh Khare (IITD)
ASSESSMENT OF AIR QUALITY DURING LOCKDOWNS IN DELHI

                                                      TABLE OF CONTENTS

Team                    ............................................................................................................................................ 3
Acknowledgements........................................................................................................................................ 3
ExecutiveSummary ......................................................................................................................................... 7
      Key findings ........................................................................................................................................... 8
1.    Introduction........................................................................................................................................... 11
2.     Scope and Objectives ...........................................................................................................................12
3.    Methodology.........................................................................................................................................12
      3.1    Assessment of effect of restricted source activity due to lockdown on air quality ............................12
      3.2 Special monitoring and chemical characterization during lockdowns .............................................12
4.    Statistical analysis of pollutant concentrations during lockdowns ..........................................................14
      4.1    Exploratory Analysis:.....................................................................................................................15
      4.2     Box and Whisker Plots.................................................................................................................. 16
      4.3 Tests of significance...................................................................................................................... 16
5. Special monitoring and chemical characterization of PM2.5 in Delhi ........................................................19
      5.1    Ambient air quality status at three selected locations.....................................................................19
      5.2 Chemical speciation of PM2.5 at Delhi during the lockdown .............................................................21
6.    Assessment of source contributions using positive matrix factorization ................................................. 23
      6.1 Factor identification...................................................................................................................... 24
      6.2 Source contributions estimation ................................................................................................... 30
7.    Conclusions ...........................................................................................................................................31
      Bibliography......................................................................................................................................... 32
      Annexure 1 .......................................................................................................................................... 34
| 6 |   ASSESSMENT OF AIR QUALITY DURING LOCKDOWNS IN DELHI
ASSESSMENT OF AIR QUALITY DURING LOCKDOWNS IN DELHI

         EXECUTIVE
         SUMMARY
| 8 |                        ASSESSMENT OF AIR QUALITY DURING LOCKDOWNS IN DELHI

This study has been carried out to understand the           and the samples were analysed for different chemical
changes in Delhi's air pollution levels and prevailing      components of PM2.5. Monitored PM2.5 concentrations
sources during the COVID related lockdowns enforced         at the three locations were found to be close to the
in the city in the months of April-May 2020. Scope of       observations at nearby CPCB monitoring stations.
this study includes a statistical analysis to assess the    Analysis of PM2.5 data shows that despite lockdowns
significance of change in PM2.5, NOx concentrations         in place during the monitoring period, 31-60% of
and meteorological datasets in 2020 w.r.t. 2019. It         days violated the daily PM2.5 standards at these three
also contains a comprehensive chemical analysis of          locations. Chemical characterization of PM2.5 shows
spatially monitored PM2.5 particles during the lockdown     that total carbon was the most dominating at all three
period, which were used for an in-depth assessment of       sites, followed by ions and metals, respectively.
source contributions using positive matrix factorization
                                                            PMF based source apportionment shows that while in
(PMF) technique.
                                                            absolute terms pollution contributions have reduced
The statistical analysis of air quality data from 32        from many sources during the lockdowns, in terms of
monitoring stations in Delhi unearthed many exciting        relative contribution, industrial sector and biomass
results for the two pollutants (PM2.5 and NOx) due to the   burning have the higher shares. Most industries
unprecedented restrictions in the year 2020. Pollutant      and households in Delhi have shifted to gas, hence,
concentrations were studied for three timeline              the industrial and biomass based contributions are
categories- Pre-Lockdown (1st January – 24th March),        mainly attributable to upwind areas of National Capital
Lockdown (25th March – 31st May), and Unlock-1/             Region. The relative decrease in vehicular movements
Post-Lockdown (1st June – 30th June), for the years         and industrial activities in Delhi resulted in inflated
2019 and 2020. Statistical analysis was also carried        contributions from other sectors like biomass,
out to assess change in ventilation coefficients (VC=       agricultural residue burning, waste burning, and dust,
wind speeds x mixing heights) in Delhi during both          which previously had a relatively lower share in Delhi's
the years. The reduction in PM2.5 and NOx was found         PM2.5 concentrations.
to be statistically significant during the Lockdown and
                                                            The unfortunate COVID-19 and associated lockdowns
Unlock period. Average reductions of 43% and 61%
                                                            led to reduced pollutant concentrations in Delhi.
were observed in PM2.5 and NOx concentrations at 32
                                                            This study, carried out during the natural experiment
stations in Delhi during the period of lockdowns in
                                                            opportunity created by lockdowns, has helped us
2020 with respect to 2019. PM2.5 also had a smaller but
                                                            identify some of the key points related to local and
statistically significant decrease in the Pre-Lockdown
                                                            regional sources of pollution in Delhi.
period as well, whereas NOx was not significantly
reduced during the same period. This decrease can
be partially attributed to meteorological conditions
(high mixing heights and precipitation) during pre-
                                                            Key findings
lockdown period in 2020 w.r.t. 2019. In summary, the        1.   Reductions (43% and 61% in PM2.5 and NOx
concentration of two pollutants decreased in 2020 wrt            concentrations, respectively) observed in PM2.5
2019 despite reduced wind speeds, indicating towards             and NOx concentrations during lockdowns in 2020
reduced emissions from sources, especially during the            w.r.t 2019 were statistically significant.
lockdowns.                                                  2. Despite lockdowns, PM2.5 levels violated the daily
Special air quality monitoring has been carried out            standard 31-60% times at the three locations in
in this study at three locations in Delhi - Central            Delhi.
(IHC-Lodhi Road), West (PN-Patel Nagar), and East           3. Contributions were found to be lower from
(LN-Laxmi Nagar). Monitoring was carried out for the           transport, and higher from biomass and industrial
period between 22nd April '20 – 5th June '20) for PM2.5        combustion     activities,  indicating   regional
ASSESSMENT OF AIR QUALITY DURING LOCKDOWNS IN DELHI

   contributions from outside of Delhi.                 significant reductions in PM2.5 concentrations.

4. Air pollutant reductions during lockdowns shows 5.   Significantly high pollutant levels observed in
   that vehicles and industries are important sectors   Delhi despite restrictions point towards substantial
   contributing to PM2.5 concentrations in Delhi, and   contributions of several non-local sources and the
   controls over them (as in lockdowns) can lead to     need for delineation of airshed for Delhi and also
                                                        for other non-attainment cities for development of
                                                        effective air quality management plans.
| 10 |   ASSESSMENT OF AIR QUALITY DURING LOCKDOWNS IN DELHI
ASSESSMENT OF AIR QUALITY DURING LOCKDOWNS IN DELHI

1. Introduction                                                                                                                                          (2018) are transport (17-28%), industries including
                                                                                                                                                         power plants (20-30%), and biomass burning (14-
Air quality has become a primary concern in India,
                                                                                                                                                         15%). Dusty fugitive sources (both natural and
with more than 70% of Indian cities violating the                                                                                                        anthropogenic) contribute to about 17-38% in the two
prescribed standards of PM10 (particulate matter                                                                                                         seasons.
less than 10 mm). The several sources of pollution –
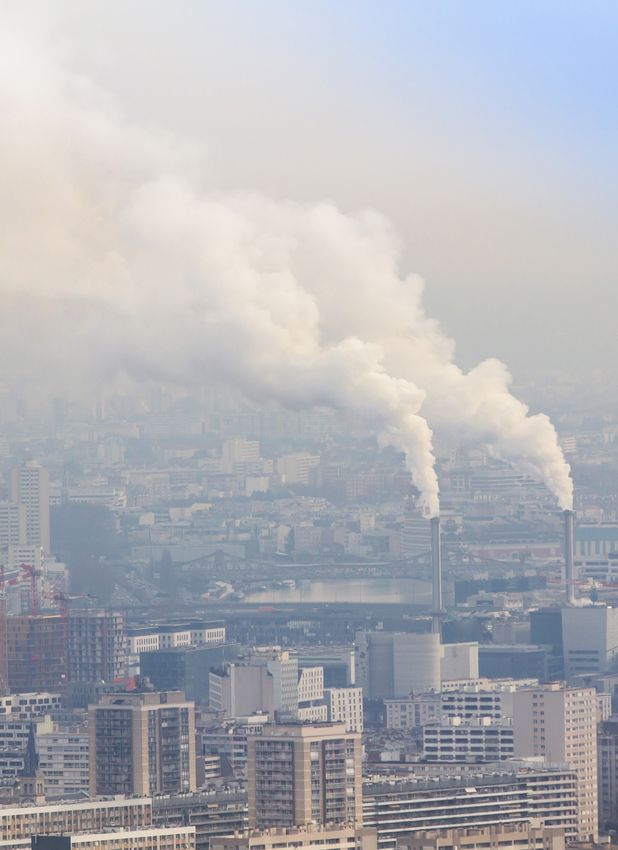
                                                                                                                                                         COVID-19 pandemic has touched all spheres of human
transport, industries, construction, biomass burning,
                                                                                                                                                         lives. While it has been disastrous, the lockdowns
etc., contribute to the overall levels of pollutants in
                                                                                                                                                         enforced for control of the COVID-19 spread have
varying proportions. Delhi, the capital city, is severely
                                                                                                                                                         resulted in significant air quality improvement. India
polluted in terms of PM10 and PM2.5 concentrations.
                                                                                                                                                         went under a lockdown on 24th March 2020 initially
Figure 1 shows the average of the 24-h average
                                                                                                                                                         for 21 days. Later, on 14th April 2020, the nationwide
concentrations of PM2.5 at 29 monitoring stations in                                                                                                     lockdown was extended till 3rd May, with some
2018, 2019, and 2020. The 24 hourly average PM2.5                                                                                                        conditional relaxations in some areas after 20th April
concentration remains above standards in most parts                                                                                                      2020. The lockdowns were further extended on 1st
of the year except during monsoons, when the rain                                                                                                        May by two weeks until 17th May. Various districts in
downwash effect reduces particulate concentrations.                                                                                                      the country were divided into three categories based
Winters show higher concentrations due to adverse                                                                                                        on the corona virus’s spread—green, red, and orange.
meteorological conditions caused by low wind speeds                                                                                                      Lastly, lockdowns got extended from 17th May till 31st
and shallower mixing heights. Consistently for the                                                                                                       May. The restrictions were gradually lifted thereafter,
last so many years, Delhi has witnessed highest PM2.5                                                                                                    with continued restrictions in the containment zones.
concentrations during early November. This episode is                                                                                                    Figure 1 shows a lower PM2.5 concentrations during the
mainly attributable to post-harvest agricultural residue                                                                                                 period of lockdown (March to June, 2020) compared to the
burning in the upwind regions of Delhi, coupled with                                                                                                     previous two years. . This was the period during which the
adverse meteorology.                                                                                                                                     restrictions were imposed on the vehicular movements,
Primary sources that contribute to PM2.5 levels in Delhi                                                                                                 industrial operations (except for essential industries
in winters and summers (as estimated by TERI & ARAI,                                                                                                     such as power plants, refineries, pharmaceutical, milk

                                      600

                                      500
        PM2.5 Concentration (µg/m3)

                                      400

                                      300

                                      200

                                      100

                                        0
                                        1-Jan

                                                                  12-Feb
                                                                           26-Feb
                                                                                    12-Mar
                                                                                             26-Mar
                                                                                                      9-Apr
                                                                                                              23-Apr
                                                                                                                       7-May
                                                                                                                               21-May
                                                                                                                                        4-Jun

                                                                                                                                                         2-Jul

                                                                                                                                                                                   13-Aug
                                                                                                                                                                                            27-Aug
                                                                                                                                                                                                     10-Sep
                                                                                                                                                                                                              24-Sep
                                                                                                                                                                                                                       8-Oct

                                                                                                                                                                                                                                        5-Nov

                                                                                                                                                                                                                                                         3-Dec
                                                                                                                                                                                                                                                                 17-Dec
                                                                                                                                                                                                                                                                          31-Dec
                                                                                                                                                                                                                               22-Oct
                                                15-Jan
                                                         29-Jan

                                                                                                                                                                                                                                                19-Nov
                                                                                                                                                18-Jun

                                                                                                                                                                 16-Jul
                                                                                                                                                                          30-Jul

                                                                                                                                            Date
                                                                                        2018                                     2019                                     2020                                         Standard

                            Figure 1: Daily PM2.5 concentrations in Delhi (average of 29 stations) in 2018, 2019, and 2020
                                                              * Jan 2018 had 15 stations
| 12 |                        ASSESSMENT OF AIR QUALITY DURING LOCKDOWNS IN DELHI

plants etc.), construction activities, etc. These sources      the ambient air quality for the years 2019 and 2020.
being the critical contributor of pollution in Delhi city, a   The statistical analysis is carried out on PM2.5 and NOx
restricted activity of these sources is expected to lower      data for the year 2019 and 2020 for three timelines,
the PM2.5 concentrations during that period. It becomes        namely, pre-lockdown, lockdown and post-lockdown
an interesting proposition to study the effects of these       period. In order to study the influence of meteorology,
restrictions imposed on the source activity on the             a separate statistical analysis has been undertaken
ambient air quality. Besides, it is crucial to understand      for the wind speed (WS), mixing heights (MH) and
the chemical composition and sources contributing to           ventilation coefficients (VC= WS x MH), for the same
the PM2.5 concentrations in the city during that period        three durations. In order to assess the statistical
in order to identify the potential sources in the absence      significance of the change observed in Delhi, the test
of local contributing sources. With support from               of normality (Anderson-Darling test) was conducted on
Bloomberg Philanthropies, TERI has conducted primary           the 2020 and 2019 dataset of PM2.5 and NOx. Thereafter,
ambient air quality monitoring at three different receptor     after confirming the normality of the data, parametric
locations in Delhi during the lockdown period in order to      paired t-tests – 2 sample t-tests were conducted on
carry out chemical characterization and source profiling.      the dataset of 2019 and 2020 to identify p values and
The study provide useful insights into the contributing        see if the change is significant or not. The details and
sources during restricted conditions in the city and help      the results have been presented and discussed in
in identifying appropriate policy interventions to target      section 4. In addition, a two-sample F-test was also
specific sources in order to meet the air quality related      conducted to assess the statistical significance of ratio
goals in the context of particulate matter concentrations.
                                                               of variances corresponding to years 2019 and 2020,
                                                               for PM2.5 and NOx concentrations data. A comparison
2. Scope and Objectives                                        of variance of the pollutant concentrations during
The study aimed at studying the impacts of restricted          the three time periods (pre-lockdown, lockdown, and
source activity during the lockdown period (March to           Unlock-1) for the years 2019 and 2020 has been made
June, 2020) on the ambient air quality (particulate            in order to assess any change in the variability of the
matter concentrations) of Delhi and carry out chemical         data w.r.t two years.
speciation and source profiling of the sources
contributing to the PM2.5 concentrations during this
                                                               3.2 Special monitoring and
period of restricted activities.
                                                                   chemical characterization
The specific objectives of the study are
                                                                   during lockdowns
a. To analyze the effect of source activity restrictions
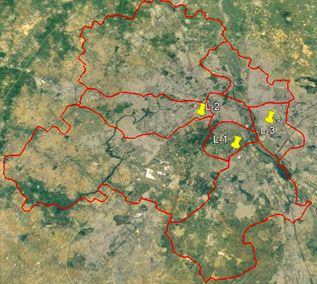
                                                               Figure 2 shows the location of national capital region
   imposed during lockdown on ambient air quality.
                                                               and three monitoring stations on Delhi’s map. National
b. To assess the chemical characteristics of PM2.5
                                                               capital region is comprised of 28 districts falling in
   concentrations (chemical speciation)
                                                               three states of Haryana, Uttar Pradesh and Rajasthan,
c. To identify contributing sources to the PM2.5
                                                               with Delhi being in the center. While Delhi city is
   concentrations
                                                               known for its vehicular density, road dust, construction
3. Methodology                                                 activities for its emission sources, the rest of NCR has
                                                               several additional sources such as industries using
3.1		Assessment of effect of                                   coal and other fuels, coal based power plants, biomass
                                                               burning in rural kitchens, agricultural residue burning,
     restricted source activity due
                                                               etc. The predominant wind direction in Delhi is from
     to lockdown on air quality                                N-W as shown in the Figure 2, and hence atmospheric
The assessment of effect of lockdown on ambient air            transport from upwind districts like Jind, Panipat,
quality has been carried by exploratory analysis, box-         Rohtak, Jhajjar, Sonipat etc influence the air quality of
whisker plots and comparative statistical analysis of          Delhi considerably. In this study, air quality monitoring
ASSESSMENT OF AIR QUALITY DURING LOCKDOWNS IN DELHI

   Predominant wind direction

           National capital region                                                         Delhi

                     Figure 2: National capital region and location of 3 monitoring stations in Delhi.

is carried out only in Delhi which is influenced by            followed was strictly according to the guidelines laid
sources in both Delhi and rest of NCR. Three zones in          down by the Central Pollution Control Board (CPCB) and
Delhi- Central (L1, IHC- Lodhi Road), West (L2, PN-Patel       the Bureau of Indian Standards (BIS). Quartz and Teflon
Nagar), and East (L3, LN- Laxmi Nagar), were selected          filters of 47 mm diameter were used for the collection
for carrying out ambient air quality monitoring.               of PM2.5 samples. PM2.5 samples collected in different
                                                               filter media such as Teflon and quartz were used for the
Out of the three selected locations, two (L3 (LN.),
                                                               chemical characterization of various metals, ions, and
and L2 (PN.)) were typically residential, while L1
                                                               carbonaceous particle, as shown in Table 1 below.
(IHC) is mainly an institutional area, with low-density
residences around. Also, the site at L1 (IHC) is close to
                                                               3.2.1 Chemical Analysis of PM2.5 samples
a busy road, while L3 (LN) and L2 (PN) were confined to
pure residential setups. We installed the instrument at        The quantitative analysis of elements in PM2.5
the height of 5-10m from ground level at L2 and L3 and         samples’ elements collected on Teflon filters was
25-30m from ground level at L1 (IHC building’s roof top,       carried out using Energy Dispersive X-ray Fluorescence
Lodhi road).                                                   Spectrometer (ED-XRF) at ARAI. As XRF analysis is a
                                                               non-destructive technique, same filter was used for
PM2.5 monitoring was conducted with special                    subsequent analysis of water-soluble inorganic ions
permissions following the guidelines concerning the            using Ion Chromatography. PM samples collected on
COVID-19 outbreak. All the instruments were calibrated,        quartz filters were subjected to O.C. (organic carbon)
sanitized, and installed at each of the selected               and E.C (elemental carbon) analysis using the Thermal/
monitoring locations. The PM2.5 sampler (APM 550M,
                                                               Optical Carbon Analyzer. Details of the sample analysis
Envirotech make, India) set at a flow rate of 16.7 LPM
                                                               are given below.
was used to monitor PM2.5 in each of the selected
locations. At all the chosen locations, 24-hourly              The ED-XRF spectrometry (EDX 7000, Shimadzu, Japan)
monitoring of PM2.5 was carried out for 45 days starting       was used to determine the concentrations of elements
from 22nd April 2020 till 5th June 2020. The methodology       including Al, Si, K, Ca, Ti, V, Fe, Co, Ni, Cu, Zn, As, Se, Zr,
| 14 |                                ASSESSMENT OF AIR QUALITY DURING LOCKDOWNS IN DELHI

Table 1: Filters and analytical methods used for analysis
 Component                                                   Required filter   Analytical method
                                                             matrix
 PM2.5                                                       Teflon & quartz Gravimetric
                                                             filter
 Elements                                                    Teflon filter     Energy Dispersive X-Ray Fluorescence (ED-XRF)
 (Na, Mg, Al, Si, P, S, Cl, Ca, Br, V, Mn, Fe, Co, Ni, Cu,                     spectrometry (EDX 7000, Shimadzu, Japan)
 Zn, As, Ti, Ga, Rb, Y, Zr, Pd, Ag, In, Sn, La Se, Sr, Mo,
 Cr, Cd, Sb, Ba, Hg, and Pb)
 Ions                                                        Teflon filter     Ion chromatography (IC) system (ICS
 (F , Cl , Br , NO , NO , SO , K , NH , Na , Ca , Mg )
   -     -   -    -    -     -2   +       +   +   ++   ++                      Aquion, ThermoFishr Scientific)
                 2    3     4            4

 Carbon Analysis                                             Quartz filter     Thermal/Optical Carbon Analyzer (DRI Model
 (O.C., E.C. & Total Carbon)                                                   2001A; Desert Research Institute, USA)

Mo, Pd, Cd, Ce, and Pb, on the Teflon filters. Calibration             The four O.C. fractions, i.e., OC1, OC2, O.C., and OC4,
standards, in the form of filter paper, of Micromatter                 are produced in a step-wise manner at 140, 280, 480,
Inc. for various elements were used for calibration of                 and 580 0C temperatures, respectively, in a pure Helium
equipment. Measurements were also made on the                          (100% He) atmosphere. This analysis was further
blank filter, and correction in the intensities was made               continued for three more temperatures, i.e., 580, 740,
for the loaded filters. Data acquisition and quantitative              and 840 0C, to determine three E.C. fractions, i.e., EC1,
analysis were carried out by using the equipment                       EC2, and EC3, respectively, in 98% helium and 2%
software.                                                              oxygen-containing atmosphere. The pyrolyzed carbon
                                                                       fraction (O.P.) is also determined when the reflected
The water-soluble inorganic ionic components in
                                                                       laser signal returns to its initial value after oxygen
PM collected on Teflon filters were determined using
                                                                       is added to the Helium atmosphere. The IMPROVE
the ion chromatography method. Each sample was
                                                                       protocol defined O.C. as OC1+OC2+OC3+OC4+OP and
ultrasonically extracted using 50 mL of deionized water
                                                                       E.C. as EC1+EC2 +EC3-OP. Each filter and blank filters
for 90 minutes. The extract was filtered through a 0.22
                                                                       were analyzed to get the representative estimation of
μm nylon membrane syringe filter to remove insoluble
                                                                       O.C. and E.C. concentrations.
matter and then analyzed using an ion chromatography
(I.C.) system (ICS Aquion, ThermoFisher Scientific).
The cations’ concentration (Na+, K+, Mg+, NH4+, Ca2+)                  4. Statistical Analysis of
was determined using an IonPac CS16, 5mm analytical
column. It’s CDRS600, 4mm guard column, 3.8 mM                            pollutant concentrations
Methanesulfonic Acid was used as eluent while the                         during lockdowns
concentrations of anions (Cl-, F-, Br-, NO3-, SO42-) were
                                                                       Air pollutants concentrations are inherently random
determined using a separation analytical column
                                                                       variables because of their dependence on various
IonPac AS23; 4mm and guard column ADRS600,
                                                                       source emissions, meteorological, and other
4mm), and 4.3 mM carbonate and 0.8mM bicarbonate
                                                                       spatiotemporal variables. When sets of random
as eluent. The blank filters were also analyzed for the
                                                                       samples of historical ambient air quality data
cations and anions.
                                                                       are available, different statistical characteristics
A 0.495 cm2 punch from a quarter of each quartz filter                 can be determined and assigned to the pollutant
sample was used for the analysis of organic carbon                     concentrations. The raw air quality and meterological
(O.C.) and elemental carbon (E.C.) using a Thermal/                    data for 32 stations in Delhi was obtained from the
Optical Carbon Analyzer (DRI Model 2001A; Desert                       CPCB website and was subjected to statistical analysis
Research Institute, USA) following IMROVE_A protocol.                  to assess the impact of lockdown on the ambient
ASSESSMENT OF AIR QUALITY DURING LOCKDOWNS IN DELHI

air pollutant concentration over Delhi. Exploratory          revealed that the processed air quality data followed
data analysis was first carried out, which included           normal and log-normal distribution. The meteorological
computation of summary statistics, Box and Whisker,          parameters followed a log-normal while some of them
and time series plot for three periods                       did not follow any statistical distribution. Thus, to
                                                             assess the impact of lockdown due to the COVID-19
•      pre-lockdown (1st January – 24th March);              pandemic, a pairwise comparison between the 2019
•      lockdown (25th Mar-31st May); and                     and 2020 dataset were conducted for all three scenarios
                                                             (Pre-Lockdown, Lockdown, Unlock-1) using the paired t
•      post-lockdown/Unlock 1(1st Jun-30th Jun).
                                                             test for datasets which followed normal distribution.
The purpose of the Box and Whisker plot was to
                                                             Dataset which followed lognormal distribution were
preliminarily assess the skewness, variation, and
                                                             first transformed and then paired t test were performed
outlying observations in the data. The time-series plot
                                                             on them. Datasets following no distribution pattern,
gave an idea of temporal variation in air quality data
                                                             were subjected to Wilcoxon nonparametric test to
and observe any bending in the curve from the day the        assess if the change in datasets is significant or not.
lockdown was introduced. An exploratory analysis was         In addition, a two-sample F-test was also conducted
also carried out for wind speed (WS), mixing height          to assess the ratio of variances of both pollutants
(MH) and ventilation coefficient (VC=WS X MH), which         corresponding to 2019 and 2020, respectively. The
are critical meteorological parameters responsible for       Two-Sample f-Test tests was conducted to assess the
the horizontal and vertical spread of the pollutants and     change in variance for the data corresponding to two
also contributing to the mechanical turbulence and           years for both the pollutants. A comparison of variances
hence dispersion. VC, which is the product of mixing         of the pollutant concentrations in three time periods
depth and the average wind speed, is an atmospheric          (pre-lockdown, lockdown, and Unlock-1) during 2019
condition which gives an indication of pollution             and 2020 is made. During lockdown period, emission
dispersion potential, i.e., the ability of the atmosphere    source activity of the local sources was reduced and
to dilute and disperse the pollutants over a region.         therefore, a reduction in variance of ambient pollutant
Exploratory analysis was carried out to assess the           concentrations is expected w.r.t the same duration
effect of meteorology on concentration levels during         during 2019.
the lockdown.

The data were first assessed for normality by conducting     4.1 Exploratory Analysis:
a goodness-of-fit test. This test is required to decide the   Percentage change in 2020 with respect to 2019 for
appropriate test of significance – parametric tests are      PM2.5 and NOx concentration in Delhi is presented in
used for the raw or the transformed data that follows        Table 2a. The highest % reduction is observed during
a normal distribution, and non-parametric tests are          the Lockdown period and then in post-lockdown
applied on data not following a normal distribution.         (Unlock 1). Reduction in pollutants concentration was
This normality check was done by testing the null            also observed in the Pre-Lockdown period. A 43%
hypothesis (H0) that pollution data comes from a             reduction in PM2.5 during lockdowns shows the impacts
normal distribution against the alternative hypothesis       of restrictions on vehicular and industrial activity in the
(H1), that the data comes from some other distribution       region. Also, a 61% reduction in NOx, which is a primary
form. In the present study, the goodness–of–fit was          pollutant contributed by the vehicular sources, shows
evaluated using Anderson and Darling (A-D) test and          the impact of restricted vehicular movement in the city.
visually examining the probability plots (Kottegoda          An analysis of meteorological parameters such as wind
and Rosso, 2008). Also, to ascertain the normality of        speed, mixing height, and VC indicate a lower average
the data, coefficient of skewness and kurtosis were          value in 2020 compared to 2019 during the lockdowns
determine for each dataset. Analyzing the A-D test,          and Unlock 1 periods. This shows that concentrations
coefficient of skewness and kurtosis, datasets were          are found to be less despite adverse meteorological
subjected to different statistical test. The examination     conditions in 2020. Hence, reductions in PM2.5 and
| 16 |                       ASSESSMENT OF AIR QUALITY DURING LOCKDOWNS IN DELHI

NOx concentration levels are attributed primarily to          4.2 Box and Whisker Plots
reduced emissions during the lockdown and Unlock-1
                                                              The Box and Whiskers plots were made for each of the
periods. During the pre-lockdown period, VC was found
                                                              three categories for 2019 and 2020. These plots show
to be higher in 2020 implying more dispersion and
                                                              the whole range of pollutant concentrations in three
hence reduced ambient concentrations. Moreover, the
                                                              different lockdown categories in the two years. The
precipitation data shows higher rainfall in 2020 than
                                                              averages and the range of pollution concentrations
in 2019 during the pre-lockdown period, resulting in
                                                              went down during the lockdown period for both
more wet deposition and reduced particulate matter
                                                              pollutants. It can be seen that the interquartile range
concentrations. Meteorological conditions were more
                                                              (IQR) and the range are very close to each other in
conducive for dispersion in pre-lockdown period of
                                                              the lockdown and post-lockdown period for both the
2020 w.r.t. 2019, as indicated by higher VC for 2020.
                                                              pollutants, indicating significantly less variability in
Therefore, reduction in this period may be attributed to
                                                              the pollutant concentration. This may be attributed
better meteorology for pollutant dispersion However,
                                                              to a stricter observation of the lockdown resulting
during the lockdown and Unlock-1 periods, where
                                                              in restricted source activity and consequent limited
meteorology has been found to be adverse during
                                                              source emission variability. The reduced spread of
2020 and lower concentrations have been observed,
                                                              these ranges suggests that major source activities
the reduction essentially is attributed to reduction
                                                              contributing to pollution in the cities were cut down,
in source emissions. This gives adequate evidence
                                                              and the pollution concentrations went down to similar
of positive impact of lockdown resulting in reduced
                                                              background levels. The coefficient of skewness and
source activity causing reduced pollution levels.
                                                              Kurtosis were also calculated for different datasets and
In addition to this, variance has also been calculated        were not found close to zero, indicating the skewness in
to assess the variability in the data of PM2.5 and NOx        the datasets; which was also indicating with datasets
concentration in the three time periods for 2019 and          not following normal distributions. The time series plot
2020 (Table 2b). It is evident that variance was found        clearly shows that after the lockdown was announced
to be much less in 2020. The reduction in variance            (25th March 2020), a dip in concentration is observed
was more pronounced during lockdown and Unlock-1              for both PM2.5 and NOx.
phases. Low variability in data indicates towards
reduced contributions from local sources in 2020,             4.3 Tests of significance
which otherwise add to variability in the pollutant
                                                              To assess the statistical significance of the reductions
concentrations. The variance was ~10-times lower for
                                                              observed in Delhi, the following tests have been
NOx concentrations during lockdown period in 2020
                                                              performed.
w.r.t. 2019, which can be attributed to significant
reduction in vehicular activity.

Table 2a: % Change in 2020 with respect to 2019 concentrations and meteorological parameters
 %reduction w.r.t. 2019             PM 2.5           NOX                WS                MH              VC
 Pre-Lockdown                       -17              -12                -16               +61             +34
 Lockdown                           -43              -61                -15               -12             -26
 Unlock 1                           -27              -43                -34               -27             -52

Table 2b: Variances observed in PM2.5 and NOx concentrations in 2019 and 2020
                              PM2.5                                             NOx
                              2019                     2020                     2019               2020
 Pre-Lockdown                 6345                     3719                     1173               647
 Lockdown                     851                      352                      349                36
 Unlock 1                     467                      139.                     277                27
ASSESSMENT OF AIR QUALITY DURING LOCKDOWNS IN DELHI

                                               PM2.5                                                                                                                                NOX
                               Pre-2019 Pre-2020 Lockdown-2019                                                                                                      Pre-2019 Pre-2020 Lockdown-2019
                               Lockdown-2020 Unlock-2019 Unlock-2020                                                                                                Lockdown-2020 Unlock-2019 Unlock-2020
            400                                                                                                                              200
                                                                                                                                             180
            350
                                                                                                                                             160
            300                                                                                                                              140
            250                                                                                                                              120
    µg/m3

                                                                                                                                     µg/m3
            200                                                                                                                              100
            150                                                                                                                               80
                                                                                                                                              60
            100
                                                                                                                                              40
             50                                                                                                                               20
               0                                                                                                                               0

                                                                                                                   PM2.5
               400
               350
               300
               250
       µg/m3

               200
               150
               100
                50
                 0
                                                                           12-Feb
                                                                                    19-Feb
                                                                                             26-Feb

                                                                                                                                                         16-Apr
                                                                                                                                                                  23-Apr
                                                                                                                                                                           30-Apr
                                                                                                                                         2-Apr
                                                                                                                                                 9-Apr
                                                                                                      5-Mar
                                                                                                              12-Mar
                                                                                                                       19-Mar
                                                                                                                                26-Mar

                                                                                                                                                                                    7-May
                                                                                                                                                                                            14-May
                                                                                                                                                                                                     21-May
                                                                                                                                                                                                              28-May
                       1-Jan
                               8-Jan
                                        15-Jan
                                                 22-Jan
                                                          29-Jan
                                                                   5-Feb

                                                                                                                                                                                                                       4-Jun
                                                                                                                                                                                                                               11-Jun
                                                                                                                                                                                                                                        18-Jun
                                                                                                                                                                                                                                                 25-Jun
                                                                                                                            Date

                                                                                                                  2019                       2020

                                                                                                                        NOx
               200
               150
       µg/m3

               100
               50
                   0
                                                                           12-Feb
                                                                                    19-Feb
                                                                                             26-Feb

                                                                                                                                                                                                                               11-Jun
                                                                                                                                                                                                                                        18-Jun
                                                                                                                                                                                                                                                 25-Jun
                                        15-Jan
                                                 22-Jan
                                                          29-Jan

                                                                                                                                                         16-Apr
                                                                                                                                                                  23-Apr
                                                                                                                                                                           30-Apr

                                                                                                                                                                                                                       4-Jun
                                                                   5-Feb
                       1-Jan
                                8-Jan

                                                                                                                                         2-Apr
                                                                                                                                                 9-Apr

                                                                                                                                                                                            14-May
                                                                                                                                                                                                     21-May
                                                                                                                                                                                                              28-May
                                                                                                                                                                                    7-May
                                                                                                              12-Mar
                                                                                                                       19-Mar
                                                                                                                                26-Mar
                                                                                                      5-Mar

                                                                                                                            Date
                                                                                                                   2019                      2020

            Figure 3: Box and Whisker plots and daily average PM2.5 and NOx concentrations at 32 stations in Delhi
                                                     during Jan-Jun 2020

•     Test of normality – Anderson-Darling test was                                                                                      •               Parametric paired t-tests – 2 sample t-tests
      conducted on the 2020 and 2019 dataset of                                                                                                          were conducted on the dataset of 2019 and
      PM2.5 and NOx.                                                                                                                                     2020 to calculate p values and assess if the
| 18 |                          ASSESSMENT OF AIR QUALITY DURING LOCKDOWNS IN DELHI

         change is significant or not. Also, on dataset     Two sample F-test for variance was also conducted to
         which followed log-normal distribution, data       assess the variance of PM2.5 and NOx during three time
         was transformed to natural logarithm value,        periods. The one tail p- value of the F-test conducted
         and then paired t test was applied to find the     on all the above-mentioned dataset was less than 0.05
         p values.                                          (confidence level of 95%), indicating that variance for
•        Non-Parametric Wilcoxon test – This was            2019 was higher than 2020 data. All the statistical
         conducted on datasets which did not follow any     tests conducted above indicate that in lockdown and
         distribution., for calculation of p values.        unlock-1 scenarios, emission sources have decreased
                                                            and resulted in reduced ambient air pollution when
•        Two sample F-test was conducted to assess          compared to 2019 data. However in pre-lockdown
         whether the variances for pollution data for the   period during 2020, it cannot be confirmed that
         two years were same or different                   pollution has reduced due to emission reduction only,
To check the normality, a goodness-of-fit test (test        as meteorological conditions in the form of higher VC
of normality) was conducted on the 2019 and 2020            and precipitation have contributed towards better
dataset both for ambient air quality and wind speed         dispersion and wet deposition resulting to reducing
data. It was found that all the datasets had a normal       pollutant concentrations.
distribution, which suggested a parametric paired
t-test to be conducted on the dataset. The test was         Using the results of these tests, inferences were
done at 0.05 significance level. Thus, a p-value smaller    drawn for PM2.5 and NOx for Delhi. The city has shown a
than 0.05 indicate statistically significant change and     general reduction in pollutant concentration, which is
vice versa.                                                 statistically significant. A finding comes out that even
                                                            during the pre-lockdown phase, the PM2.5 in 2020 was
For the pre-lockdown period PM2.5, the p-value is less      significantly reduced compared to 2019 data. However,
than 0.05, which is indicative of the fact that PM2.5       the reduction may be attributed more to meteorological
was reduced in 2020 (before COVID-19 restrictions)          conditions resulting in dilution of pollution levels
significantly, mainly due to meteorological changes.        (higher VC and precipitation)). However, reduction in
However, NOx levels showed insignificant change             NOx is not significant during the pre-lockdown period,
during the pre-Lockdown period. During the lockdown         which shows that even though PM2.5 has reduced,
period, statistically significant reduction was found       NOx has not shown a similar reduction. During the
in the concentration levels of both the pollutants. In      lockdown period, a statistically significant reduction
addition, low p-value of winds speeds, mixing heights,      in the pollutant concentration was observed despite of
and VC datasets also suggests statistically significant     adverse meteorological conditions during this period
change during 2020 with respect to 2019 for the             in 2020, clearly indicating the favourable impact
three different periods. The fact that VC is reduced        of restricted source emission activity in Delhi and
significantly confirms that emission reduction played a     neighbouring areas.
significant role in reducing pollution during lockdowns,
even though meteorology was unfavourable.

Table 3: p values of paired 2 t-test

    p-value                       PM2.5          NOx               WS                MH              VC

    Pre-Lockdown                  0.0004         0.068             0.00              0.000           0.000

    Lockdown                      0.000          0.000             0.00              0.000           0.000

    Unlock 1                      0.000          0.000             0.00              0.000           0.000
ASSESSMENT OF AIR QUALITY DURING LOCKDOWNS IN DELHI

5. Special monitoring and                                                                                                                                                             24-hr average NAAQS of 60 µg/m3 prescribed by CPCB.
                                                                                                                                                                                      A similar finding was observed in the data collected
   chemical characterization                                                                                                                                                          from the nearest CPCB monitoring station. The PM2.5
                                                                                                                                                                                      levels at this location during the monitoring period
   of PM2.5 in Delhi                                                                                                                                                                  ranged between 27-137 µg/m3 with an average level of
Ambient PM2.5 monitoring was carried out at 3 locations                                                                                                                               67 µg/m3, whereas the corresponding levels at Lodhi
in Delhi- IHC, L.N., and P.N. The comparative results of                                                                                                                              Road monitored by CPCB went between 21-121 µg/m3,
PM2.5 concentrations in the 3 sites are presented in                                                                                                                                  averaging about 60 µg/m3.
subsequent sections.
                                                                                                                                                                                      The PM2.5 levels measured at the Laxmi Nagar location
                                                                                                                                                                                      were found to violate the prescribed standard 47% of
5.1 Ambient PM2.5 status of the                                                                                                                                                       the times during this period. The PM2.5 levels at this
    three selected locations                                                                                                                                                          location during the monitoring period varied between
The results of the ambient PM2.5 monitoring carried                                                                                                                                   35-122 µg/m3 with an average of 65 µg/m3. There were
out at the three locations are summarized below. The                                                                                                                                  no close CPCB stations to this site. Hence an average
PM2.5 levels at three sites were compared with the                                                                                                                                    of 4 sites in east Delhi, closest to the station, were
observations at nearest stations monitored by CPCB                                                                                                                                    taken. The average PM2.5 values of the four locations
under the National Air Monitoring Program (NAMP). All                                                                                                                                 in the eastern part of Delhi monitored by CPCB in the
the results were compared with the National Ambient                                                                                                                                   same period indicated a 31% times violation of the
Air Quality Standards (NAAQS) set by CPCB.                                                                                                                                            standard, and the levels ranged between 23-100 µg/
                                                                                                                                                                                      m3 with an average value of 53 µg/m3. This reduction in
The PM2.5 levels at Lodhi Road (L1) during the                                                                                                                                        the percentage violation, range and average values in
monitored period from April to June indicate that for                                                                                                                                 the CPCB data may be attributed to the averaging effect
60% of the monitored period levels were above the                                                                                                                                     (the values are average of four monitoring stations).

                                                                                             Observed conc. (TERI)                                                                     Observed conc. (CPCB)                                                                          NAAQS
                                 150
                                 140
                                 130
       PM2.5 concentration (µg/m3)

                                 120
                                 110
                                 100
                                  90
                                  80
                                  70
                                  60
                                  50
                                  40
                                  30
                                  20
                                  10
                                   0
                                       22.04.2020
                                                    24.04.2020
                                                                 26.04.2020
                                                                              28.04.2020
                                                                                           30.04.2020
                                                                                                        02.05.2020
                                                                                                                     04.05.2020
                                                                                                                                  06.05.2020
                                                                                                                                               16.05.2020
                                                                                                                                                            18.05.2020
                                                                                                                                                                         20.05.2020
                                                                                                                                                                                      22.05.2020
                                                                                                                                                                                                   24.05.2020
                                                                                                                                                                                                                26.05.2020
                                                                                                                                                                                                                             28.05.2020
                                                                                                                                                                                                                                          30.05.2020
                                                                                                                                                                                                                                                       01.06.2020
                                                                                                                                                                                                                                                                    03.06.2020
                                                                                                                                                                                                                                                                                 05.06.2020
                                                                                                                                                                                                                                                                                              07.06.2020
                                                                                                                                                                                                                                                                                                           09.06.2020
                                                                                                                                                                                                                                                                                                                        11.06.2020
                                                                                                                                                                                                                                                                                                                                     13.06.2020

                                                                                                                             Figure 4: PM2.5 levels at Lodhi Road
| 20 |                                                                                                 ASSESSMENT OF AIR QUALITY DURING LOCKDOWNS IN DELHI

                                                  150                                                             Observed conc. (TERI)                                                                           Observed conc. (CPCB)                                                                                                    NAAQS
                                                  140
                                                  130
                                                  120
                    PM2.5 concentration (µg/m3)

                                                  110
                                                  100
                                                   90
                                                   80
                                                   70
                                                   60
                                                   50
                                                   40
                                                   30
                                                   20
                                                   10
                                                    0
                                                          22.04.2020
                                                                        24.04.2020
                                                                                      26.04.2020
                                                                                                    28.04.2020
                                                                                                                 30.04.2020
                                                                                                                              02.05.2020
                                                                                                                                           04.05.2020
                                                                                                                                                        06.05.2020
                                                                                                                                                                     15.05.2020
                                                                                                                                                                                  17.05.2020
                                                                                                                                                                                                19.05.2020
                                                                                                                                                                                                              21.05.2020
                                                                                                                                                                                                                             23.05.2020
                                                                                                                                                                                                                                            25.05.2020
                                                                                                                                                                                                                                                            27.05.2020
                                                                                                                                                                                                                                                                            29.05.2020
                                                                                                                                                                                                                                                                                            31.05.2020
                                                                                                                                                                                                                                                                                                             02.06.2020
                                                                                                                                                                                                                                                                                                                              04.06.2020
                                                                                                                                                                                                                                                                                                                                                06.06.2020
                                                                                                                                                                                                                                                                                                                                                              08.06.2020
                                                                                                                                                                                                                                                                                                                                                                            10.06.2020
                                                                                                                                                                                                                                                                                                                                                                                          12.06.2020
                                                                                                                                            Figure 5: PM2.5 levels at Laxmi Nagar.
                                        *Observed concentration of CPCB is the average of PM2.5 levels at four locations in the east of Delhi such as Vivek
                                                                         Vihar, IHBAS, Anand Vihar, and Vivek Vihar.

The PM2.5 concentrations measured at the Patel Nagar                                                                                                                                                          location during the entire monitoring period ranged
location indicated that most of the time, the levels                                                                                                                                                          between 28-129 µg/m3, averaging to 54 µg/m3. The
were well within the prescribed limit except for a few                                                                                                                                                        data collected from the nearest site (Pusa Road) of
observations (~29% violation). The PM2.5 levels at this                                                                                                                                                       Patel Nagar operated by CPCB also indicated that the

                                        150                                                                         Observed conc. (TERI)                                                                          Observed conc. (CPCB)                                                                                                   NAAQS
                                        140
                                        130
                                        120
         PM2.5 concentration (µg/m3)

                                        110
                                        100
                                         90
                                         80
                                         70
                                         60
                                         50
                                         40
                                         30
                                         20
                                         10
                                          0
                                                        22.04.2020
                                                                       24.04.2020
                                                                                     26.04.2020
                                                                                                   28.04.2020
                                                                                                                 30.04.2020
                                                                                                                              02.05.2020
                                                                                                                                           04.05.2020
                                                                                                                                                        06.05.2020
                                                                                                                                                                     16.05.2020
                                                                                                                                                                                   18.05.2020
                                                                                                                                                                                                 20.05.2020
                                                                                                                                                                                                                22.05.2020
                                                                                                                                                                                                                               24.05.2020
                                                                                                                                                                                                                                               26.05.2020
                                                                                                                                                                                                                                                               28.05.2020
                                                                                                                                                                                                                                                                               30.05.2020
                                                                                                                                                                                                                                                                                                01.06.2020
                                                                                                                                                                                                                                                                                                                 03.06.2020
                                                                                                                                                                                                                                                                                                                                   05.06.2020
                                                                                                                                                                                                                                                                                                                                                     07.06.2020
                                                                                                                                                                                                                                                                                                                                                                   09.06.2020
                                                                                                                                                                                                                                                                                                                                                                                  11.06.2020
                                                                                                                                                                                                                                                                                                                                                                                                13.06.2020

                                                                                                                                            Figures 6: PM2.5 levels at Patel Nagar
ASSESSMENT OF AIR QUALITY DURING LOCKDOWNS IN DELHI

levels at this location for most of the monitored period                           species remained unidentified at Laxmi Nagar, IHC,
were well within the standard (~31% violation); the                                and Patel Nagar, respectively, which can be attributed
levels at this location ranged between 15-143 µg/m3                                to the rest of the organic matter attached to the organic
with an average of 48 µg/m3 over the entire monitoring                             carbon and oxides attached with the metals.
period,
                                                                                   5.2.2 Elements
5.2 Chemical speciation of PM2.5                                                   Mass distribution of elemental species showed that Si,
    at Delhi during the lockdown                                                   S, Cl, K and Fe was identified as the most dominating
                                                                                   elemental constituents in PM2.5 samples across the
5.2.1 Carbon                                                                       respective monitoring locations. Highest proportion of
During the monitoring period, mass distribution                                    Si with relative share of 29% was observed at Laxmi
of chemical species (elements, carbon, and ions)                                   Nagar, followed by 23% at IHC and 14% at Patel Nagar.
showed that total carbon was the most dominating                                   High concentrations of silica at Laxmi Nagar indicates
chemical constituent in PM2.5 samples at all the three                             towards a specific source of dust in the vicinity of
monitoring locations. A significantly higher proportion                            station. Across respective monitoring locations, the
of total carbon was observed across different areas,                               highest of S with relative abundance of 22% was
51% at IHC, followed by 41% at Laxmi Nagar and 31%                                 observed at IHC, followed by 19% at Laxmi Nagar and
at Patel Nagar. This shows the presence of significant                             16% at Patel Nagar. A specific source of coal (which has
combustion sources in the PM2.5 levels. Ions were                                  significant quantities of sulphur) is indicated near IHC
identified as the second most abundant species,                                    locations, above the general influence of regional scale
followed by elements. Among different monitoring                                   industrial source at all the sites. Similarly, significantly
locations, the highest ion relative contribution of 29%                            highest proportion of Cl, having relative share of 29%
was observed at Patel Nagar, followed by 18% at Laxmi                              was observed at Patel Nagar, followed by 15% and 14%
Nagar and 14% at IHC. Similarly, the highest elemental                             at IHC and Laxmi Nagar respectively. Highest share of
contribution of 21% was observed at Patel Nagar,                                   Fe and Na having relative abundance of 8% and 9%
followed by 16% at Laxmi Nagar and 11% at IHC. About                               respectively was identified at Patel Nagar monitoring
25%, 23%, and 19% of chemically characterized PM2.5                                site.

                                               100%
                                               90%        23%                                                19%
                 % Share of chemical species

                                                                                    25%
                                               80%
                                               70%
                                                                                                             31%
                                               60%
                                                                                    41%
                                               50%        51%
                                               40%
                                                                                                             29%
                                               30%
                                                                                    18%
                                               20%        14%
                                               10%                                  16%                      21%
                                                          11%
                                                0%
                                                          IHC                   Laxmi Nagar              Patel Nagar

                                                                Metals   Ions       total carbon    others
                                   Figure 7: Percentage share of elements, ions, carbon, and other species in PM2.5
                                  samples at IHC, Laxmi Nagar, and Patel Nagar monitoring locations in Delhi during
                                                                   April- June, 2020
| 22 |                                                      ASSESSMENT OF AIR QUALITY DURING LOCKDOWNS IN DELHI

                                 100%
                                    90%                           4%                               7%                          8%
                                                                  4%                               5%                          5%
                                    80%
           % Share of elements

                                                               16%                                13%                          10%
                                    70%
                                    60%                                                           14%
                                                               15%
                                                                                                                               29%
                                    50%
                                    40%                                                           19%
                                                               22%
                                    30%                                                                                        16%

                                    20%                                                           29%
                                                               23%                                                             14%
                                    10%
                                                                4%                              4%                              9%
                                            0%
                                                               IHC                          Laxmi Nagar                     Patel Nagar
                                            Na               Mg              Al             Si            P            S               Cl
                                            K                Ca              Sc             Ti            V            Cr              Mn
                                            Fe               Co              Ni             Cu            Zn           Ga              Ge
                                            As               Se              Br             Rb            Sr           Y               Zr
                                            Mo               Rh              Pd             Ag            Cd           Sn              Sb
                Figure 8: Percent share of different elements in overall elements concentrations in PM2.5 at 3 sites

5.2.3    Ions                                                                                    highest proportion of NH4+ having a relative share of
                                                                                                 42% was observed at Patel Nagar, followed by 18%
Mass distribution of ionic species showed SO42-, NH4,
                                                                                                 at IHC and 15% at Laxmi Nagar. This depicts a more
Cl-, NO3-, K+, Ca+2, and Na+ were observed as the most
                                                                                                 substantial influence of regional, scale secondary
dominating species in PM2.5 samples at all the three
                                                                                                 inorganics at Patel Nagar, which is upwind to the city
monitoring locations. NH4+ was identified as the most
                                                                                                 centre and expected to be influenced by regional
abundant species among the chemically characterized
                                                                                                 pollution. The highest proportion of K+ with a relative
cationic species, followed by K+, Ca+2, and Na+. The

                                            100%                                                   3%                          2%
                                                                   4%
                                                                   9%                              9%                          6%
                                            90%

                                            80%                                                    15%
                                                                   18%                                                         29%
                                            70%                                                    3%
                                                                   3%
                          % share of ions

                                            60%                                                                                2%

                                            50%
                                                                   44%                             52%
                                            40%                                                                                42%
                                            30%

                                            20%
                                                                   7%                                                          6%
                                                                                                   6%
                                            10%
                                                                   12%                             8%                          11%
                                             0%
                                                                   IHC                      Laxmi Nagar                  Patel Nagar

                                                 F-   CI-   NO2-       Br-   NO3-   PO4-3        SO4-2   Na+   NH4+    K+     Mg++        Ca++

                                             Figure 9: Percent share of different ions in overall ion concentrations in PM2.5 at 3 sites
ASSESSMENT OF AIR QUALITY DURING LOCKDOWNS IN DELHI

contribution of 9% was observed at IHC and Laxmi                 in various other multivariate receptor models. The
Nagar monitoring locations.                                      chemical mass balance equation used in the model

Moreover, among different chemically characterized               Xij=∑k=1
                                                                      p
                                                                          Gik . Fkj + eij
anionic species, SO4 -2 was identified as the most
                                                                 Where Xij is the concentration of species j measured on
abundant species, followed by Cl- and NO3-. This
                                                                 sample i, p is the number of factors contributing to the
indicates industrial sources emit SO2, which eventually
                                                                 samples, Fkj is the concentration of species j in factor
converts to sulphates after going through a series of
                                                                 profile k, Gik is the relative contribution of factor k to
chemical reactions. A significantly higher proportion
                                                                 sample i, and eij is the residual of the PMF model for
of SO4 -2 having a relative contribution of 52% was
                                                                 the j species measured on sample i.
observed at Laxmi Nagar, followed by 44% at IHC and
42% at Patel Nagar. Moreover, the higher proportion              The model attempts to adjust the values of Gik and
of Cl- and NO3- having a relative share of 12% and 7%,           Fkj until a minimum value of Q for a given p is found,
was witnessed at the IHC monitoring location.                    where Q is
                                                                                                          2
                                                                       n    m       Xij–∑k=1 Gik . Fkj
                                                                                         p

6. Assessment of source                                          Q=    ∑ ∑
                                                                      i=1 j=1
                                                                                            uij ]

   contributions using                                           where uij is the uncertainty of the jth species

   positive matrix                                               concentration in sample i, n is the number of samples,
                                                                 and m is the number of species.
   factorization                                                 EPA PMF carries out multiple iterations to identify
In this study, positive matrix factorization has been            the best possible factor contributions and profiles.
used to derive sources’ contributions towards                    The model searches for the factor profiles, starting
prevailing PM2.5 concentrations. EPA-PMF software                with a randomly generated factor profile, which then
has been used for this purpose, which has been                   gradually modified in different iterations using the
successfully used in several studies before. The basic           gradient approach to find the best-fit solution. Lowest
methodology used in the PMF analysis is based on                 Q value determines the best solution.
finding a solution to the mass balance equations as

                                  100%
                                   90%                                                              15%
                                           25%                   24%
                                   80%
              % share of carbon

                                   70%
                                   60%
                                   50%
                                   40%                                                              85%
                                           75%                   76%
                                   30%
                                   20%
                                   10%
                                    0%
                                           IHC                Laxmi Nagar                     Patel Nagar

                                                      OC                    EC

                Figure 10: Percent share of E.C. and O.C. in overall carbon concentrations in PM2.5 at 3 sites
| 24 |                      ASSESSMENT OF AIR QUALITY DURING LOCKDOWNS IN DELHI

Q (robust) and its variability across different runs       overall run and individual species, and finally, it was
act as a critical parameter for choosing the optimal       found to be less than 2 for all species. Additional
run from the multiple runs. Limited variation in the       modelling uncertainty was assumed to be 12% to
Q(full) values ensures more stability of the solution.     account for errors in uncertainty estimations. For
Variability of the PMF solution is estimated using the     different iterations, the species which were not
following two methods.                                     predicted well by the model were removed from the
                                                           analysis (categorized as Bad). Once the base runs
a) Bootstrap (B.S.) analysis: This is employed to assess
                                                           were completed, bootstraps (100) were performed,
   and detect whether a small set of observations
                                                           and the mapping of bootstrap factors to base factors
   influence the PMF solution disproportionately. B.S.
                                                           was found to be more than 80%. Finally, eight factors
   error intervals can determine the effects caused
                                                           could be identified, which could be attributed to
   by random errors and to some extent effects of
                                                           different sources contributing to the prevailing PM2.5
   rotational ambiguity (which could be caused
                                                           concentrations. Figure 11 shows the consistency
   due to existence of an infinite number of similar
                                                           observed in Q (R) values across the 20 runs performed
   solutions).
                                                           by the model, which shows the appropriateness and
b) Displacement (DISP) analysis: This is used to           consitentcy of the model results.
   understand the sensitivity of the selected solution
                                                           Figure 12 shows the observed and predicted values
   to small changes. DISP error intervals include
                                                           of PM2.5 concentrations by the model. Figure 13 shows
   effects of rotational ambiguity but do not include
                                                           time series reduction of PM2.5 concentration by the
   consequences of random errors in the data.
                                                           model.
The data from the three sites (IHC, L.N., and P.N.) were
compiled and was run using the EPA-PMF software.           6.1 Factor identification
In the PMF-EPA model, PM2.5 was designated as Total        In all, the model could distinguish and identify eight
species. The data were first analyzed by assessing         factors. The fingerprints of the eight identified factors
the Signal/Noise (S/N) ratios for different species        are shown in Figure 14.
and then categorized into ‘strong,’ ‘weak, and ‘bad’
categories (Annexure 1). After that, we evaluated the      The first factor is identified as an aged profile
time series of PM2.5 and other species and derived         resulting from long distance transport of emissions
useful inferences. It was found that concentrations of     due to agricultural residue burning and industries.
PM2.5 and EC1, and O.C. rise considerably in between       The profile shows high abundance of potassium, and
the monitoring period, which coincides with the period     sulphate, along with organic & elemental carbon,
of agricultural residue burning in the upwind regions of   and a significant proportion of chlorides. The factor
Punjab and Haryana.                                        also shows increase in contributions in some days
                                                           of monitoring which coincides with the period of
After that, correlations between species were              increased number of fires detected in the upwind
assessed. It was found that EC1 and EC2 don’t correlate    regions of Delhi. Post-harvesting of the wheat crop,
well, depicting that they come from different sources.     residues are burnt in upwind states of Delhi, and due
EC1 being at low temperature can come from biomass         to atmospheric transport, aerosols travel towards
burning, or industrial burnings, while EC2 can come        Delhi and contribute to PM2.5 concentration. Moreover,
from high-temperature vehicular combustions. The           there are several industries in the upwind districts and
PMF model runs have been performed with 12 sources         states of Delhi (Figure 2) and presence of sulphates in
initially but reduced down to 8 sources finally by         the profile points towards their contribution through
looking at bootstrap tests’ results. Several iterations    long range transport.
were done to bring Q(True) closer to Q(Robust), which
eventually came out to be the same. Simultaneously,        The second factor is identified as secondary inorganic
attempts were also made to reduce Q/Qexp for the           particulates, like ammonium, sulphate, and nitrate,
ASSESSMENT OF AIR QUALITY DURING LOCKDOWNS IN DELHI

Figure 11: Consistency of Q(r) and Q(True) values during several PMF runs for the three sites

          Figure 12: Predicted and observed concentrations of PM2.5 at three sites
                                   by the EPA-PMF Model
| 26 |                      ASSESSMENT OF AIR QUALITY DURING LOCKDOWNS IN DELHI

                          Figure 13: Time-series of predicted and observed values of PM2.5
                                          concentrations at 3 sites in Delhi

                          Figure 14: Fingerprints of eight identified factor profiles for Delhi

which show higher abundances. Reactions of gases              by slow oxidation of SO2 to SO4 -2 (Querol et al., 1998)
such as SO2, NOx, and NH3 form secondary inorganic            and are part of aged masses transported from long
aerosols. The reaction of H2SO4(g) (formed by SO2) and        distances (Manousakas et al., 2017). As the monitoring
HΝΟ3(g) (formed by NOx) with NH3 form ammonium                time is in summer seasons, sulfates are found to be
sulfates (NH4)2SO4 and ammonium nitrates NH4NO3               more in quantities than nitrates. Lower temperatures
(Stockwell et al., 2003; Squizzato et al., 2013).             provide favourable conditions for ammonium nitrate
Secondary particles are, in most cases, attributable to       formations (Stelson and Seinfeld et al., 1982).
long-range atmospheric transport. Sulfates are formed         Presence of sources of ammonium (through use of
ASSESSMENT OF AIR QUALITY DURING LOCKDOWNS IN DELHI

fertilizers and livestocks), sulphates and nitrates        form of soot) and organic particles. Diesel vehicles
(through combustive sources) in the upwind regions         are known to emit soot along with organic carbon
(Figure 2) ensures significant contributions to the mass   particles. While during the initial phase of lockdown,
of PM2.5 observed in Delhi.                                the vehicle movement was very much restricted, a
                                                           greater number of vehicles started plying towards
 Waste burning and biomass burning is identified
                                                           the end of April, when PM2.5 monitoring was going
as the crucial third factor contributing to PM2.5
                                                           on.. Also, the movement of diesel driven heavy-duty
concentrations in Delhi. In the nearby regions
                                                           trucks continued for the supply of essential goods
outside of Delhi, a significant number of households
                                                           during the lockdown period.
were estimated to be dependent on biomass for daily
cooking purposes (TERI&ARAI, 2016). Diapouli et al.        The sixth factor can be identified as soil dust, which
(2014) resolved profile of biomass burning mainly          shows the dominating presence of crustal minerals like
by the presence of high K and to a lesser extent by        Ca, Ti, Fe, etc. Summer season is known for high wind
presence of Cl in the factor. However, significant         speeds, and once it goes beyond a threshold, the soil
presence of chlorides also points towards possibility      particles get air-borne and add to the pollutant loads.
of municipal solid waste burning.
                                                           The seventh factor has been identified as silica dust,
The presence of high EC1, significant contributions        which clearly shows the high abundance of silica.
of sulphates and OC characterizes the fourth factor,       Silica is found in soil, construction material, sand,
which is identified as coal-based burning (power           concrete, masonry, rock, granite, and landscaping
plants or industries). Smaller quantities of Si,           materials. Silica particles are abundant in the dust
As and Fe are also found to be present. There are          generated by cutting, grinding, drilling, or handling
low-efficiency industrial processes (e.g., brick           these materials. In context of this study, it is
manufacturing), which emit significant quantities          specifically found abundant at one of the sites and
of EC. Also, due to the presence of sulfur in coal,        hence can be treated as a specific dust generation
sulfates can be attributed to these industries.            activity near the site.
Matwale et al. (2014) show the source profile of brick
manufacturing sectors, which shows an abundance            The eighth factor is characterized by Pb’s dominance,
of high EC fractions. The presence of vanadium and         followed by Zn and Br, which can be attributed to
silica (as coal ash) in small quantities also points       industrial lead smelting sources. Rai et al. (2020) also
towards industrial fuel burning. There is a limited        reported a Pb-rich profile contributing significantly
number of industries in Delhi, and most of them have       to Delhi’s PM concentrations. There are several
been reported to be shifted to cleaner gaseous fuels.      possibilities of a Pb-rich source, e.g., open waste/
However, outside of Delhi, there are about 5000 brick      plastic burning (Kumar et al., 2015; Kumar et al.,
kilns and and almost equivalent number of industries       2018), lead smelting (Jaiprakash et al., 2017; Patil et
and coal based power plants. While during the              al., 2013), lead recovery from used car batteries, brake
initial phase of the lockdown most industries were         wear (Bukowiecki et al., 2009) and waste incineration,
closed, but in the latter part of April, many of these     etc. Rai et al. (2020) also suggested that the northeast
industries started to function again (I.E., 2020). Delhi   part of Pakistan, Punjab, and Haryana could be the
does not have a coal-based power plant now and             potential source region of this factor profile.
most industries have moved to gas, but still, several
                                                           Daily contributions of eight-factor profiles towards
sources (coal based industries and power plants) in
                                                           PM2.5 concentrations are shown in Figure 15. Factor 1
the upwind of Delhi city (Figure 2) continue to emit
PM and SO2 and contribute to the elements and ions         (Agri residue burning and industries) contributions are
mentioned above in Delhi’s PM2.5 concentrations.           present at all sites and in a consistent manner show
                                                           an increase during the same days indicating towards
The fifth factor identified is the motor vehicle,          enhanced agricultural burning contributions during
which shows dominance of E.C. emissions (in the            those days. This period of enhanced contributions of
You can also read