Secular change in atmospheric Ar/N2 and its implications for ocean heat uptake and Brewer-Dobson circulation
←
→
Page content transcription
If your browser does not render page correctly, please read the page content below
Atmos. Chem. Phys., 21, 1357–1373, 2021
https://doi.org/10.5194/acp-21-1357-2021
© Author(s) 2021. This work is distributed under
the Creative Commons Attribution 4.0 License.

Secular change in atmospheric Ar/N2 and its implications for ocean
heat uptake and Brewer–Dobson circulation
Shigeyuki Ishidoya1 , Satoshi Sugawara2 , Yasunori Tohjima3 , Daisuke Goto4 , Kentaro Ishijima5 , Yosuke Niwa3 ,
Nobuyuki Aoki1 , and Shohei Murayama1
1 Environmental  Management Research Institute, National Institute of Advanced Industrial Science and Technology (AIST),
Tsukuba 305-8569, Japan
2 Faculty of Education, Miyagi University of Education, Sendai 980-0845, Japan
3 Center for Environmental Measurement and Analysis, National Institute for Environmental Studies,

Tsukuba 305-8506, Japan
4 Division for Research and Education, National Institute of Polar Research, Tokyo 190-8518, Japan
5 Department of Climate and Geochemistry Research, Meteorological Research Institute, Tsukuba 305-0052, Japan

Correspondence: Shigeyuki Ishidoya (s-ishidoya@aist.go.jp)

Received: 30 March 2020 – Discussion started: 4 May 2020
Revised: 4 December 2020 – Accepted: 13 December 2020 – Published: 1 February 2021

Abstract. Systematic measurements of the atmospheric             riod 2012–2019 were estimated from the corrected secular
Ar/N2 ratio have been made at ground-based stations in           trends of the Ar/N2 ratio for the weakened- and enhanced-
Japan and Antarctica since 2012. Clear seasonal cycles of the    BDC conditions, respectively. Both OHC increase rates from
Ar/N2 ratio with summertime maxima were found at middle-         the uncorrected- and weakened-BDC secular trends of the
to high-latitude stations, with seasonal amplitudes increasing   Ar/N2 ratio are consistent with 12.2 ± 1.2 ZJ yr−1 reported
with increasing latitude. Eight years of the observed Ar/N2      by ocean temperature measurements, while that from the
ratio at Tsukuba (TKB) and Hateruma (HAT), Japan, showed         enhanced-BDC is outside of the range of the uncertainties.
interannual variations in phase with the observed variations     Although the effect of the actual atmospheric circulation on
in the global ocean heat content (OHC). We calculated sec-       the Ar/N2 ratio is still unclear and longer-term observations
ularly increasing trends of 0.75 ± 0.30 and 0.89 ± 0.60 per      are needed to reduce uncertainty of the secular trend of the
meg per year from the Ar/N2 ratio observed at TKB and            surface Ar/N2 ratio, the analytical results obtained in the
HAT, respectively, although these trend values are influenced    present study imply that the surface Ar/N2 ratio is an impor-
by large interannual variations. In order to examine the pos-    tant tracer for detecting spatiotemporally integrated changes
sibility of the secular trend in the surface Ar/N2 ratio being   in OHC and BDC.
modified significantly by the gravitational separation in the
stratosphere, two-dimensional model simulations were car-
ried out by arbitrarily modifying the mass stream function
in the model to simulate either a weakening or an enhance-       1   Introduction
ment of the Brewer–Dobson circulation (BDC). The secular
trend of the Ar/N2 ratio at TKB, corrected for gravitational     The Ar/N2 ratio of air is a unique tracer for detecting
separation under the assumption of weakening (enhance-           changes in the spatiotemporally integrated air–sea heat flux
ment) of BDC simulated by the 2-D model, was 0.60 ± 0.30         or ocean heat content (OHC). This is because variations in
(0.88 ± 0.30) per meg per year. By using a conversion fac-       the Ar/N2 ratio at the Earth’s surface are driven by air–sea
tor of 3.5 × 10⁻²³ per meg per joule by assuming a one-box       Ar and N2 fluxes that reflect changes in the solubility of these
ocean with a temperature of 3.5 ◦ C, average OHC increase        gases in seawater (e.g., Keeling et al., 2004). The increase
rates of 17.1 ± 8.6 ZJ yr−1 and 25.1 ± 8.6 ZJ yr−1 for the pe-   in the global OHC is one of the most important parameters
                                                                 for evaluating Earth’s climate system (e.g., Trenberth and

Published by Copernicus Publications on behalf of the European Geosciences Union.
1358                                                                S. Ishidoya et al.: Secular change in atmospheric Ar/N2

Fasullo, 2010). The relative temperature dependence of the         ing a 2-D model. By using the simulated δ , we derived the
solubility of Ar is larger than that of N2 , so that the atmo-     secular trend of the Ar/N2 ratio corrected for gravitational
spheric Ar/N2 ratio increases with increasing ocean temper-        separation changes associated with the BDC change. Finally,
ature. Other noble gases behave in a similar way. Bereiter et      we estimated the global OHC change based on the corrected
al. (2018), for example, analyzed Kr/N2 and Xe/N2 ratios in        Ar/N2 ratio.
air trapped in ice cores and estimated that the mean global
ocean temperature increased by 2.57 ± 0.24 ◦ C over the last
glacial transition (20 000 to 10 000 years ago). In terms of       2   Experimental procedures
ocean heat content, the present-day global OHC increase is
evaluated from analyzing the ocean temperature measure-            Atmospheric Ar/N2 has been observed at Tsukuba (TKB;
ments using Argo floats (e.g., Cheng et al., 2019). Therefore,     36◦ N, 140◦ E), Japan, continuously since February 2012
precise measurements of the Ar/N2 ratio in air can be used         (Ishidoya and Murayama, 2014). Located on the roof of a
as an independent validation of the OHC estimation from the        laboratory building of the National Institute of Advanced In-
ocean data. However, long-term changes in the atmospheric          dustrial Science and Technology (AIST), sample air is taken
Ar/N2 ratio have not been reported so far due to difficulties      from an air intake by using a diaphragm pump with gas
in detecting a trend with sufficient accuracy, although a few      velocity higher than 5 ms−1 (4 mm i.d. and a flow rate of
past studies observed its seasonal variations (Keeling et al.,     4 L min−1 ) at the tip of the air intake to prevent thermally
2004; Blaine, 2005; Cassar et al., 2008; Ishidoya and Mu-          diffusive inlet fractionation (Sturm et al., 2006; Blaine et al.,
rayama, 2014).                                                     2006). The sample air is introduced into a 1 L stainless-steel
   We have reported in past studies that the Ar/N2 ratio de-       buffer tank after water vapor in the air is reduced by using an
creases with increasing altitude in the stratosphere due to        electric cooling unit at 2 ◦ C. The gas is then exhausted from
gravitational separation of the atmospheric constituents (e.g.,    the buffer tank at a flow rate of about 4 L min−1 . A small
Ishidoya et al., 2013; Sugawara et al., 2018). The magnitude       portion of this exhausted gas is introduced into a 3.2 mm
of gravitational separation is determined by a balance be-         (1/8 in.) o.d. stainless-steel tube, and any remaining water
tween mass-independent atmospheric transport, that is, ad-         vapor is removed using a cold trap at −90 ◦ C. Finally, the
vection and eddy diffusion, and mass-dependent molecular           remaining sample air is vented through an outlet path at a
diffusion in the atmosphere. This implies that gravitational       rate of about 10 mL min−1 , and only a minuscule amount of
separation will be influenced by the atmospheric circulation       it is transferred to the ion source (or waste line) of a mass
changes. Therefore, we can use the observed gravitational          spectrometer (Thermo Scientific Delta V) through an insu-
separation as an indicator of the Brewer–Dobson circula-           lated thin fused-silica capillary. As for the reference air, it
tion (BDC) in the stratosphere. There has been no study to         is always supplied from a high-pressure cylinder at a flow
evaluate the effect of gravitational separation changes in the     rate of about 4 mL min−1 , and a minuscule amount of it is
stratosphere on the concentrations and isotopic ratios of at-      introduced into the ion source (or waste line) of the mass
mospheric trace gases at the surface, since it has been be-        spectrometer through another fused-silica capillary. For the
lieved that the gravitational separation signal from the strato-   continuous measurements, alternate analyses of the sample
sphere is too small to be detected at the surface. Therefore,      and reference air are made repeatedly. The measurement time
in our previous studies, we simulated δ, which is an indi-         required to obtain one data value is 62 s, but we usually
cator of gravitational separation derived from the Ar/N2 ra-       use the 550-data averaged value as the reported Ar/N2 ra-
tio and stable isotopic ratios of N2 , O2 and Ar, using atmo-      tio obtained from the continuous observations (about 11 h
spheric transport models by assuming the surface δ to be zero      averaged value). We also measure stable isotopic ratios of
(Ishidoya et al., 2013; Sugawara et al., 2018; Belikov et al.,     N2 , O2 and Ar, and O2 /N2 ratio and CO2 mole fraction si-
2019). However, because long-term changes in the Ar/N2 ra-         multaneously, and use the 550-data averaged values for the
tio near the surface are expected to be extremely small, e.g.,     stable isotopic ratios and one data value without averaging
0.00026 % corresponding to a heat input of 100 ZJ (1 zeta-         for O2 /N2 ratio and CO2 mole fraction; these measurements
joule = 1021 J) into a 10 ◦ C ocean (Keeling et al., 2004), a      constitute the continuous observations. Details of the con-
very small secular change in the stratospheric gravitational       tinuous measurement system used are given in Ishidoya and
separation signal near the surface may modify the long-term        Murayama (2014).
change in the surface Ar/N2 ratio. If so, an evaluation of            We have also collected air samples at a rate of once per
gravitational separation of the whole atmosphere is needed         month at Hateruma Island (HAT; 24◦ N, 124◦ E) and Cape
for a precise estimate of the global OHC increase based on         Ochiishi (COI; 43◦ N, 146◦ E), Japan, since July 2012 and
long-term changes in the surface atmospheric Ar/N2 ratio.          October 2013, respectively, and at Syowa station (SYO;
   In this paper, we present results from an analysis of 8-year-   69◦ S, 40◦ E) since January 2016 for the analyses of the at-
long measurements of the atmospheric Ar/N2 ratio at the            mospheric Ar/N2 ratio. Each air sample is taken from an air
ground surface stations and propose δ as a new indicator          intake by using a diaphragm pump at a flow rate of about
of gravitational separation of the whole atmosphere by us-         5 L min−1 and filled into a 1 L stainless-steel flask whose in-

Atmos. Chem. Phys., 21, 1357–1373, 2021                                              https://doi.org/10.5194/acp-21-1357-2021
S. Ishidoya et al.: Secular change in atmospheric Ar/N2                                                                      1359

ner walls are silica-coated after removing water vapor using        ders. As shown in Fig. 1, variations in the annual average
a cold trap (−40 ◦ C at HAT and COI, and −80 ◦ C at SYO).           δ(Ar/N2 ) of our three secondary standards are within ±0.9–
Similar to our previous study (Ishidoya et al., 2016), the 1 L      ±2.2 per meg (±1.6 per meg, on average) and nearly stable
stainless-steel flasks are equipped with two metal-seal valves      for 8 years with respect to the primary standard. Therefore,
on each side to equalize the inner pressure to the pressure be-     we allowed an uncertainty of ±1.6 per meg for the annual
tween the two metal-seal valves to prevent a mass-dependent         average δ(Ar/N2 ) observed in the present study associated
fractionation due to small leak through the valve. During air       with the stability of the standard air, which corresponds to
sampling, the inner pressure of the flask is kept at an ab-         an uncertainty of ±0.28 per meg per year for the 8-year-long
solute pressure of 0.2 MPa using a back-pressure valve (To-         secular trend. We have also prepared high-precision gravi-
hjima et al., 2003). The sample air collected in the flasks         metric standard mixtures of Ar, O2 , N2 and CO2 , with stan-
are then sent to AIST and analyzed by using the same mass           dard uncertainties for the Ar and O2 molar fractions of 0.6
spectrometer as described above. The sample air is supplied         to 0.8 µmol mol−1 (Aoki et al., 2019). From the measure-
from the flask at a flow rate of about 4 mL min−1 through a         ments of the gravimetrically prepared standard mixtures by
cold trap (about −50 ◦ C), and a minuscule amount of it is          the mass spectrometer, it was confirmed that the span sen-
introduced into the ion source (or waste line) of the mass          sitivity of δ(Ar/N2 ) obtained from the mass spectrometer
spectrometer through a fused-silica capillary. It is noted that     agreed to within 0.2 % of the gravimetric values of the stan-
we also used 760 mL glass flasks with Viton O-ring seal             dard mixtures, in the range from −4500 to +1800 per meg
valves on each side for collecting air samples at HAT and           of δ(Ar/N2 ) against our primary standard air.
COI prior to September 2015 and January 2019, respectively.            In the present study, we use 1-week averaged values from
However, we found slight seasonally dependent differences           the continuous observation at Tsukuba after implementing
in the Ar/N2 and O2 /N2 ratios between the analytical re-           the following data selection procedure. First, the δ(Ar/N2 )
sults from the 1 L stainless-steel flasks and those from the        values with δ 15 N higher than 3.0 per meg were excluded
760 mL glass flasks. It is interesting to note that the O2 /N2      from the analyses. As mentioned above, the δ(Ar/N2 ) and
ratio from the 1 L stainless-steel flasks agrees well with the      δ 15 N values are already 11 h averaged values. We have found
O2 /N2 ratio reported by the National Institute for Environ-        these high-δ 15 N events accompanied by high-CO2 events, as
mental Studies (NIES) (e.g., Tohjima et al., 2019), consider-       well as occasionally with slightly high-δ(Ar/N2 ) events, es-
ing the difference in the span sensitivity of the O2 /N2 ratio      pecially in the winter, but they did not correlate with varia-
between the AIST and NIES (Aoki et al., 2021). Therefore,           tions in the isotopic ratio of O2 and Ar. Therefore, it appears
we have decided to adopt the Ar/N2 data obtained from the           that some unspecified interferences of mass 29 (possibly
1 L stainless-steel flasks and correct the data from the 760 mL     13 C16 O and/or fragments of hydrocarbons) rather than the

glass flasks based on the comparison of the Ar/N2 ratios            molecular–diffusive separation of 15 N14 N and 14 N14 N must
measured from the stainless-steel flasks and the glass flasks       have been superimposed on the observational results of δ 15 N
at HAT for the period of October 2015–January 2019. The             during these events. It is possible that these high-CO2 and
cause(s) of such an offset between the stainless-steel flasks       δ 15 N events occur under a stable atmospheric condition in the
and glass flasks has not been determined yet, but it may be         winter, so that simultaneously observed δ(Ar/N2 ) may also
related to the seasonal difference in the ambient temperature       be modified by local effects such as thermally diffusive sep-
during the time the flasks were shipped from the observa-           aration of Ar and N2 due to a temperature inversion near the
tional sites to our laboratory and its effect on the condition of   surface (Adachi et al., 2006). Therefore, the threshold value
Viton O-ring seal valves used in the glass flasks.                  of 3.0 per meg was determined to be reasonable, considering
   The Ar/N2 ratio is usually reported in per meg units as          that an average δ 15 N value of 1.1 ± 1.7 per meg was observed
follows.                                                            at HAT for the period of October 2015–January 2020, while
                                         !                       the observed CO2 mole fractions over the same period were
                   [nAr ] / nN2 sample                              much closer to the values of the background air than those
δ (Ar/N2 ) =                         − 1 × 10⁶             (1)
                  [nAr ] / nN2 standard                             observed at TKB. After the above data selection procedure,
                                                                    1-week averaged values of δ(Ar/N2 ) were calculated. The
Here, the subscripts “sample” and “standard” indicate the           measurement uncertainty of the 1-week averaged values of
sample air and the standard gas, respectively. Because Ar           the continuous observation was estimated to be about ±3 per
constitutes 9334 µmol mol−1 of air by volume (Aoki et               meg as a standard deviation from the best-fit curve shown
al., 2019), 5 per meg of δ(Ar/N2 ) is equivalent to about           in Fig. 2 discussed below, while that of the flask air sample
0.05 µmol mol−1 . In this study, δ(Ar/N2 ) of each air sample       measurements was estimated to be about ±7 per meg from
was determined against our primary standard air (cylinder no.       repeated analyses of the same air samples.
CRC00045) using the mass spectrometer Thermo Scientific
Delta V. Our air standards, which are classified into primary
and secondary, are dried ambient air or industrially purified
air-based CO2 standard filled in 48 L high-pressure cylin-

https://doi.org/10.5194/acp-21-1357-2021                                             Atmos. Chem. Phys., 21, 1357–1373, 2021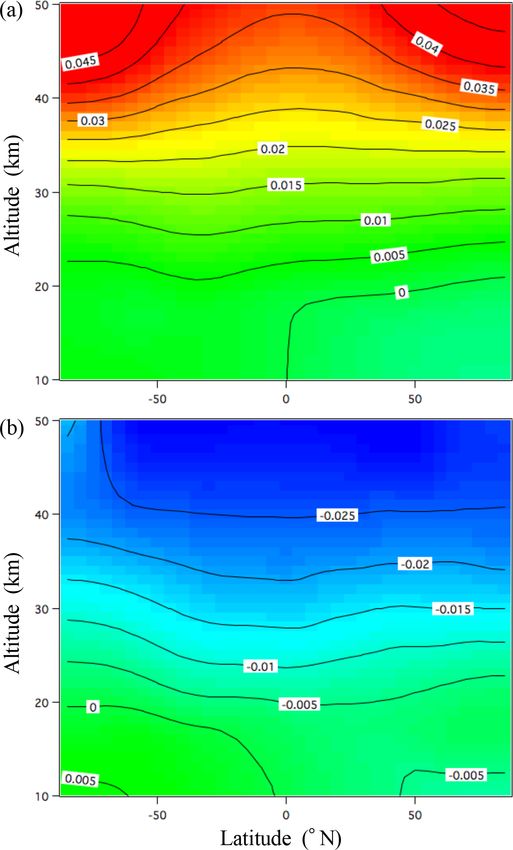
1360 S. Ishidoya et al.: Secular change in atmospheric Ar/N2
als obtained by subtracting the average seasonal cycle from
the data were interpolated linearly to calculate the daily val-
ues of δ(Ar/N2 ), which were then smoothed by a 26th-order
Butterworth filter with a cutoff period of 36 months to ob-
tain the interannual variation. The interannual variation was
then subtracted from the original data, and the average sea-
sonal cycle was determined again from the residuals. These
steps were repeated until we obtained an unchanging inter-
annual variation. In this study, we have defined an average
linear increasing–decreasing trend as the “secular trend” (as
in Fig. 5 discussed below).
As seen in Fig. 2, we can distinguish clear seasonal
δ(Ar/N2 ) cycles at COI, TKB, and SYO and some inter-
annual variations at TKB and HAT. Figure 3 shows the de-
trended values of δ(Ar/N2 ) and average seasonal δ(Ar/N2 )
cycles observed at all four sites. The seasonal maxima were
found in the summertime, which is expected since the sea
surface temperatures around the observational sites reach
seasonal maximum in the summertime, due to the larger
relative-temperature-dependent solubility of Ar compared to
that of N2 . The peak-to-peak amplitudes of the seasonal
δ(Ar/N2 ) cycles were 21 ± 10, 11 ± 4, 5 ± 10 and 32 ± 9
per meg at COI, TKB, HAT and SYO, respectively. The un-
certainties for the amplitudes indicate standard deviations of
the detrended values from the average seasonal cycle. The
uncertainties at COI, HAT and SYO were found to be not
only larger than that at TKB, but also ±7 per meg of the un-
certainty originated from the repeated analyses of the same
flask air sample. This would be due to the fact that the un-
certainty of each analysis value of the standard air (about ±5
per meg, black dots in Fig. 1) is superimposed on the uncer-
tainty of each analysis of the flask air sample and continuous
measurement. Therefore, a mean squared error expected for
the observational data from the flask air sample is about ±9
per meg, which is comparable to the uncertainties in the sea-
sonal amplitudes in Fig. 3. Corrections to the δ(Ar/N2 ) data
at HAT and COI prior to September 2015 and January 2019
Figure 1. (a) Each analysis value (black dots) and corresponding discussed above (corrections based on the comparison of the
annual average (blue circles) of δ(Ar/N2 ) of three secondary stan- δ(Ar/N2 ) values from the stainless-steel flasks and the glass
dards against the primary standard air. (b) Anomalies of δ(Ar/N2 ) flasks) could also be contributing to the uncertainties.
of the three secondary standards shown in panel (a). Similar increases in the seasonal δ(Ar/N2 ) cycle ampli-
tude with increasing latitude were also observed by Keeling
et al. (2004) and Cassar et al. (2008). Cassar et al. (2008)
3 Results and discussion also reported on the seasonal δ(Ar/N2 ) cycle at SYO with a
peak-to-peak amplitude of 21 ± 8 per meg. The amplitude at
3.1 Atmospheric δ(Ar/N2 ) observed at ground surface SYO found in this study is consistent with that found by Cas-
stations in Japan and Antarctica sar et al. (2008), within the quoted uncertainties. For La Jolla
(LJO; 33◦ N, 117◦ W), USA, located at a similar latitude to
Figure 2 shows atmospheric δ(Ar/N2 ) observed at COI, TKB, Keeling et al. (2004) and Blaine (2005) found a sea-
TKB, HAT and SYO. Best-fit curves to the data and long- sonal δ(Ar/N2 ) cycle with a peak-to-peak amplitude of about
term trends obtained using a digital filtering technique 10 per meg. This agrees with the amplitude at TKB observed
(Nakazawa et al., 1997) are also shown. Using this filter- in this study. Seasonal minima and maxima at SYO and LJO
ing technique, the average seasonal cycle of δ(Ar/N2 ) was reported by Cassar et al. (2008) and Keeling et al. (2004),
modeled by a fundamental sine–cosine and its first harmonic respectively, are in general agreement with those observed
with the respective periods of 12 and 6 months. The residu- at SYO and TKB in this study. On the other hand, the sea-
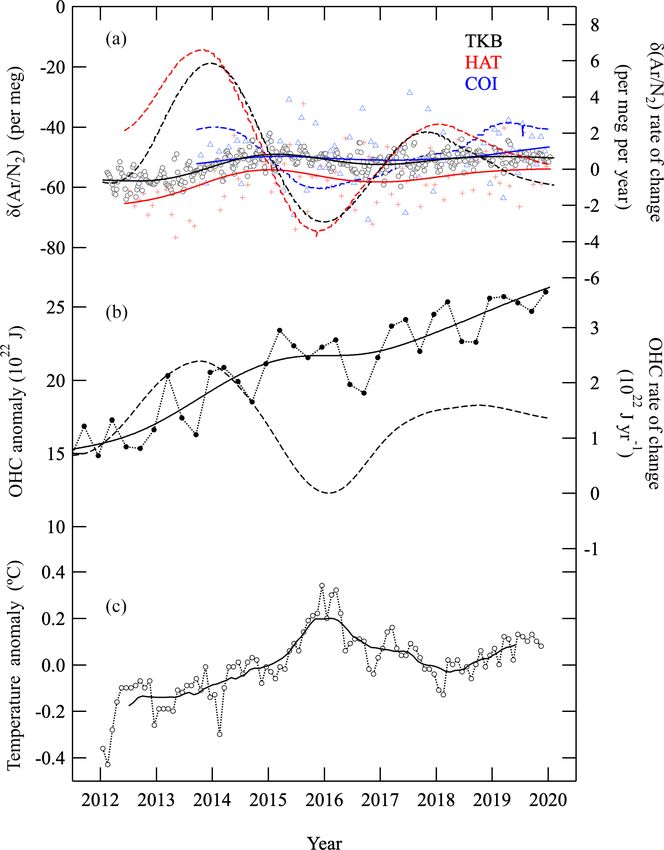
Atmos. Chem. Phys., 21, 1357–1373, 2021 https://doi.org/10.5194/acp-21-1357-2021S. Ishidoya et al.: Secular change in atmospheric Ar/N2 1361 Figure 2. Temporal variations of δ(Ar/N2 ) at Ochiishi (COI), Tsukuba (TKB), and Hateruma (HAT), Japan, and Syowa (SYO), Antarctica. Observed values are shown by open circles. Best-fit curves to the data (solid lines) and interannual variations (dashed lines) are also shown. sonal δ(Ar/N2 ) cycle at HAT was not so clear, but the av- from TKB and HAT since the observations at these sta- erage peak-to-peak amplitude may be slightly smaller than tions date back to 2012 and are longer than data from other the 14 ± 6 per meg observed at Kumukahi (20◦ N, 155◦ W), sites. Variations in the 0–2000 m global OHC are shown USA, located at a similar latitude to HAT (Keeling et al., (Fig. 4), reported by the National Oceanographic Data Cen- 2004). Similar and consistent results obtained by this and ter (NOAA) and National Centers for Environmental Infor- other studies give confidence in our ability to capture natural mation (NCEI) (updated from Levitus et al., 2012, https:// variations of δ(Ar/N2 ) in the atmosphere. www.nodc.noaa.gov/OC5/3M_HEAT_CONTENT/, last ac- Figure 4 shows variations in δ(Ar/N2 ) observed at COI, cess: 14 January 2020). The OHC values are shown as TKB and HAT, after subtracting the seasonal cycles and anomalies from the baseline value observed in mid-1980s. shorter-term variations of less than 36 months. For analy- In the figure we also plot interannual variation of the OHC ses of the interannual variation, we mainly used the data values obtained by using the same digital filtering technique https://doi.org/10.5194/acp-21-1357-2021 Atmos. Chem. Phys., 21, 1357–1373, 2021
1362                                                                  S. Ishidoya et al.: Secular change in atmospheric Ar/N2

                                                                     a more prominent secular increase. Moreover, the observed
                                                                     variations in the change rates of δ(Ar/N2 ) and OHC are quite
                                                                     similar to each other in phase, suggesting a strong correlation
                                                                     between the large-area air–sea heat flux and the interannual
                                                                     variations in δ(Ar/N2 ). The minima of the rate of change of
                                                                     δ(Ar/N2 ) and OHC appeared at the beginning of 2016 when
                                                                     a maximum in the surface temperature anomaly appeared.
                                                                     This correspondence is qualitatively reasonable since a de-
                                                                     crease in the OHC change rate indicates a decrease in the
                                                                     net ocean heat uptake, thus leading to an increase in surface
                                                                     temperature.
                                                                        As mentioned above, the ratio of interannual variation to
                                                                     secular increase is larger for δ(Ar/N2 ) than for OHC. To
                                                                     examine this difference, we estimated the interannual vari-
                                                                     ation of the atmospheric δ(Ar/N2 ) expected from the air–
                                                                     sea Ar and N2 fluxes caused by the interannual variation in
                                                                     the global OHC. We converted the change rate of OHC to
                                                                     that of δ(Ar/N2 ) by assuming a coefficient of 3.5 × 10⁻²³ or
                                                                     3.0 × 10⁻²³ per meg per joule, which was derived from the
                                                                     following equations (Keeling et al., 1993).

                                                                               dCeqAr Q̇
                                                                     FAr = −                                                     (2)
                                                                                dT CP
                                                                               dCeqN Q̇
                                                                                    2
                                                                     F N2   =−                                                   (3)
                                                                                 dT CP
                                                                     Here, FAr (FN2 ) is the net sea-to-air Ar (N2 ) flux in moles
                                                                     m−2 s−1 , dCeqAr /dT (dCeqN /dT ) is the temperature deriva-
                                                                                                  2
                                                                     tives of the solubility of Ar (N2 ) in mole m−3 K−1 (Weiss,
                                                                     1970), Q̇ is the net air-to-sea heat flux in J m−2 and CP is the
                                                                     heat capacity of seawater in J m−3 K−1 . In Eqs. (2) and (3),
                                                                     the assumption that surface waters fully equilibrate could
                                                                     lead to overestimation of the gas fluxes. As a first approxi-
                                                                     mation we modeled the global ocean as one box and assumed
                                                                     an average temperature of 3.5 or 7.5 ◦ C. The temperatures of
                                                                     3.5 and 7.5 ◦ C, corresponding to the respective coefficients of
                                                                     3.5 × 10⁻²³ (including deep water) and 3.0 × 10⁻²³ per meg
                                                                     per joule (not including deep water), were the average values
                                                                     of the ocean model shown in Fig. 1 of Bereiter et al. (2018)
                                                                     for the present-day ocean. We also assumed constant CP and
                                                                     salinity of 3.9 × 10⁶ J m−3 K−1 and 35 ‰, respectively. To
                                                                     convert FAr and FN2 to changes in atmospheric δ(Ar/N2 ), we
Figure 3. Detrended values of δ(Ar/N2 ) (open circles) and average
                                                                     employed 5.124 × 10²¹ g for the total atmospheric mass of
seasonal cycles of δ(Ar/N2 ) (solid lines) observed at COI, TKB,
HAT and SYO. Gray shaded areas denote standard deviations of the
                                                                     dry air (Trenberth, 1981), 28.97 g mol−1 for the mean molec-
detrended values from the average seasonal cycle at each site.       ular weight of dry air, 3.6 × 10¹⁴ m2 for the surface-ocean
                                                                     area of the Earth, and respective fractions of 0.00933 and
                                                                     0.7808 for Ar and N2 in the atmosphere.
                                                                        As a result, the interannual variation in the change rates of
used in Fig. 2 and globally averaged surface temperature             the global OHC was estimated to drive only 10 % of that of
anomalies (Japan Meteorological Agency, http://www.data.             the atmospheric δ(Ar/N2 ). This discrepancy would be due to
jma.go.jp/cpdinfo/temp/nov_wld.html, last access: 14 Jan-            the fact that the troposphere, and not only the ocean, does not
uary 2020). Rates of change of the interannual variations of         mix perfectly on a timescale of a year and that the surface-
δ(Ar/N2 ) and OHC are also shown. As can be seen from the            ocean temperature anomalies would be a large source of in-
figure, δ(Ar/N2 ) show significant interannual variations and        terannual variation on a yearly timescale for the observed
slight secular increasing trends while the global OHC shows          δ(Ar/N2 ) in the near-surface air. Therefore, in order to in-

Atmos. Chem. Phys., 21, 1357–1373, 2021                                                https://doi.org/10.5194/acp-21-1357-2021
S. Ishidoya et al.: Secular change in atmospheric Ar/N2 1363 Figure 4. (a) δ(Ar/N2 ) values at TKB (black open circles), HAT (red crosses) and COI (blue triangles), after subtracting seasonal cycles and shorter-term variations less than 36 months. Interannual variations of δ(Ar/N2 ) at TKB, HAT and COI are shown by black, red and blues solid lines, respectively. Rates of change of δ(Ar/N2 ) at TKB, HAT and COI are also shown by black, red and blue dashed lines, respectively. (b) 0–2000 m global ocean heat content (OHC) from NOAA/NCEI (filled circles), its long-term trend (solid line) and increase rate (dashed line). The baseline period for OHC is the mid-1980s. (c) Global average surface temperature anomalies. Monthly and their 12-month running mean values are shown by open circles and the solid line, respectively. terpret the relationship between the interannual variations of 9 years for the lighter and denser subtropical mode water, re- OHC and δ(Ar/N2 ) more quantitatively, we need to consider spectively; and 10–20, 20–30 and >60 years for the lighter, the local heat anomalies and atmospheric transport effects. middle and denser central mode water, respectively. There- In other words, a much longer-term δ(Ar/N2 ) variation is fore, it is expected that the secular trend of the δ(Ar/N2 ) val- less affected by the surface-ocean anomalies and atmospheric ues obtained during 2012–2019 (8 years) in the present study transport but will include the influence signature of the av- does not reflect the deep OHC change. erage temperature from the surface to the deeper part of the Figure 5 shows the δ(Ar/N2 ) values observed at TKB and ocean. In this regard, Suga et al. (2008) estimated the renewal HAT, along with their best-fit curves and interannual vari- time of permanent pycnocline water in the North Pacific to ations from Fig. 2. In the figure, we have also plotted the be 2–4 years for eastern subtropical mode water; 2 and 5– annual average values of δ(Ar/N2 ) obtained at these sites. https://doi.org/10.5194/acp-21-1357-2021 Atmos. Chem. Phys., 21, 1357–1373, 2021
1364                                                                  S. Ishidoya et al.: Secular change in atmospheric Ar/N2

The data are expressed as anomalies from the average value
for the observation period. From the figure, we can distin-
guish secularly increasing trends of δ(Ar/N2 ) at both of the
sites throughout the observation periods, with large inter-
annual variations superimposed on these trends. Therefore,
we applied another best-fit curve consisting of the funda-
mental and its first harmonics and a linear secular trend to
the observed data (black dotted lines) to extract the secular
trends as a component of the linear trend of the best-fit curve
(thick black solid lines). The secular trends were found to be
0.75 ± 0.30 and 0.89 ± 0.60 per meg per year at TKB and
HAT, respectively. The uncertainties for TKB (HAT) were
evaluated, taking into account the respective uncertainties of
±0.11 and ±0.28 per meg per year (±0.53 and ±0.29 per
meg per year) for the regression and the long-term stability
of the standard air. Comparable secular trends of 0.70 ± 0.33
per meg per year for TKB and 1.06 ± 0.61 per meg per year
for HAT were also obtained from the difference in the an-
nual average value between 2012 and 2019 for each station.
Although, it is possible that these changes observed over the
study period might not represent a long-term trend but are
part of a large interannual variation. Nevertheless, it would of
interest to see if it is possible to obtain a scientifically mean-
ingful OHC change based on the secular δ(Ar/N2 ) trend re-
ported earlier. Accordingly, we used the secular trend at TKB
(0.75 ± 0.30 per meg per year), because of the smaller uncer-
tainty than that obtained at HAT, to propose a method to es-
timate the global OHC or BDC change based on the surface
and the stratospheric secular trends of δ(Ar/N2 ). For this pur-
pose, we simulate the gravitational separation effect on the
δ(Ar/N2 ) in the whole atmosphere by using a 2-D model de-
scribed below in Sect. 3.2.

3.2    Simulation of gravitational separation and its effect
       on δ(Ar/N2 ) at ground surface
                                                                     Figure 5. Same observed values (blue dots), best-fit curves to the
                                                                     data (blue dotted lines) and interannual variations (blue solid lines)
As mentioned in the Introduction, we have reported observa-
                                                                     of δ(Ar/N2 ) at TKB (a) and HAT (b) as in Fig. 2. Data are ex-
tional results of gravitational separation in the stratosphere       pressed as anomalies from the average value for the observation
(Ishidoya et al., 2008, 2013, 2018; Sugawara et al., 2018).          period. Other best-fit curves consisting of the fundamental, its first
Those results showed that stratospheric δ(Ar/N2 ) also de-           harmonics and a linear secular trend to the observed data are also
creases rapidly with increasing altitude above the tropopause.       shown (black dotted lines). The components of the linear secular
Also, not only are there large year-to-year variations in            trend of the best-fit curve are shown by thick black solid lines. In
the difference between the stratospheric and tropospheric            order to address the uncertainty of the secular trend, uncertainties
δ(Ar/N2 ) values, but year-to-year variations in stratospheric       around the regression and the long-term stability of the standard air
δ(Ar/N2 ) are much larger than those observed in the tropo-          (±1.6 per meg, blue circles in Fig. 1b) have been taken into account.
sphere (Ishidoya et al., 2013, 2018). Therefore, we need to          Annual average values of δ(Ar/N2 ) at TKB and HAT (filled black
explore the possibility of tropospheric δ(Ar/N2 ) variations         circles) and the secular trend at each station calculated as the dif-
                                                                     ference between the 2012 and 2019 annual average values are also
caused by changes in the stratospheric gravitational separa-
                                                                     plotted (thin black solid lines). Error bars for the annual average
tion that influence the whole troposphere. We have compared          values at TKB and HAT are evaluated considering the uncertainty
the observed and simulated gravitational separation of atmo-         of each analysis value of the standard air (black dots in Fig. 1b) and
spheric major components above the tropopause in previous            the uncertainty associated with repeated analyses of the same air
studies (Ishidoya et al., 2013, 2018; Sugawara et al., 2018;         samples.
Belikov et al., 2019), but we did not consider gravitational
separation in the troposphere. Therefore, in this study we
updated the SOCRATES model (Huang et al., 1998) to cal-

Atmos. Chem. Phys., 21, 1357–1373, 2021                                                 https://doi.org/10.5194/acp-21-1357-2021
S. Ishidoya et al.: Secular change in atmospheric Ar/N2 1365
culate variations in Ar and N2 from the surface to 120 km, of gravitational separation on the δ value at the ground sur-
taking into account molecular diffusion processes generating face. In our 2-D model, we used the ratio of the total amount
gravitational separation. SOCRATES is a 2-D model with pa- (M) of each gas component in the model atmosphere as the
rameterized eddy diffusivity coefficients, tuned to produce a constant reference and defined a new δ value, δ , using the
realistic stratospheric age of air distribution. In the present following equation.
study we carry out sensitivity studies by arbitrarily modi- !
fying the mass stream function in the model. Here, we de- [nAr ] / nN2
scribe only those modifications we made to the model for δ(Ar/N2 ) = − 1 × 10⁶ (6)
MAr /MN2
the calculation of δ(Ar/N2 ). An additional description of the
SOCRATES model is presented in Appendix A. The total amount was calculated by integrating from the
First, our 2-D model was expanded to be able to calcu- ground surface to the altitude of 120 km. According to this
late explicitly any inert gas components and their isotopic definition, δ will be zero if there are neither molecular sep-
ratios and elemental ratios, including δ(Ar/N2 ). In our previ- arations nor sinks/sources in the entire atmosphere. In the
ous model studies, we used 44 CO2 and 45 CO2 to reproduce actual atmosphere, δ becomes negative in the stratosphere
gravitational separation for the sake of simplicity. However, due to gravitational separation but will be a small positive
it is now necessary to explicitly include the molecular diffu- value in the troposphere. A 50-year-long spin-up calculation
sion coefficients of all gas components in order to reproduce was carried out for δ(Ar/N2 ) under steady-state condition,
the molecular diffusion processes in the stratosphere more and we found that δ(Ar/N2 ) in the troposphere reached
accurately, because the molecular diffusion coefficient is de- a steady-state value of about 30 per meg. In other words,
pendent on the molecular mass. In this study, the molecular the tropospheric Ar/N2 ratio is enriched by about 30 per
diffusion coefficient of the gas component A in air (DA ) was meg relative to the homogenous atmosphere due to the at-
calculated using the following equation (Poling et al., 2001). mospheric gravitational separation. If the gravitational sepa-
ration is strengthened due to atmospheric circulation changes
1.43 × 10⁻⁴ T 1.75
DA = √ √ √ 2 (4) in the stratosphere, δ at the ground surface will slightly
p mA-air 3 σA + 3 σair increase. On the other hand, if the gravitational separation
is weakened in the stratosphere, δ at the ground surface
Here, T and p are the temperature (K) and pressure (hPa),
will decrease. Therefore, by using δ , it is possible to ex-
respectively. The reciprocal average of mA and mair , mA-air ,
amine how a change in the gravitational separation in the
is defined as follows.
stratosphere affects δ at the ground surface. The merid-
1 1 1 1 ional distribution of δ(Ar/N2 ) calculated using the updated
= + (5) SOCRATES model and its comparison with the stratospheric
mA-air 2 mA mair
δ(Ar/N2 ) observed in our previous studies are presented in
Here, mA and mair are the molecular masses of component A Appendix B.
and air, respectively. σA and σair are the diffusion volumes of Third, the age of air (AoA) is calculated using an ideal-
the component A and air, respectively. The diffusion volumes ized tracer. In our previous model calculations, the AoA was
of 40 Ar, 28 N2 and air are 16.2, 18.5 and 19.7, respectively calculated from the CO2 mole fraction. However, since the
(Poling et al., 2001). actual increase in CO2 mole fraction given at the ground sur-
Second, a new δ value has been defined and used for face is not a linear increase but includes non-linear trends and
δ(Ar/N2 ) in this study. Usually, the isotopic ratios or ele- interannual fluctuations, it is not possible to estimate the cor-
mental ratios of the atmospheric major compositions are ex- rect AoA from the simple lag time method (e.g., Waugh and
pressed as values relative to their ratios in the troposphere. Hall, 2002). Therefore, in this study, we introduced an inert
Therefore, it is common to treat the δ values at the ground idealized tracer that increases linearly at the ground surface
surface as zero. However, high-precision analyses have re- and calculated the AoA in the stratosphere from the mole
cently revealed that, as is the case in δ(Ar/N2 ), the δ val- fraction of this idealized tracer.
ues at the ground surface are not always constant, and they
have seasonal and interannual variations, as well as long- 3.3 Secular trends in the observed and simulated
term trends (Keeling et al., 2004; Cassar et al., 2008; Blaine, δ(Ar/N2 ) and their implication for changes in OHC
2005; Bent, 2014). The purpose of our analysis here is to and BDC
evaluate the effect of gravitational separation on the δ value
at the ground surface using the 2-D model. Therefore, it To examine how δ(Ar/N2 ) is influenced by changes in the
is no longer appropriate to assume that the δ value at the BDC, model simulations were made by arbitrarily chang-
ground surface is always zero. Observationally, small vari- ing the mean meridional circulation (MMC) represented by
ations at the ground surface can be detected by using specific mass stream function in the 2-D model so that AoA changed
gas cylinders as constant references. In a numerical model, by ±0.02 yr yr−1 at 35 km over the northern mid-latitudes.
a constant reference is also needed for evaluating the effects The simulated AoA values for the 35 km height are shown
https://doi.org/10.5194/acp-21-1357-2021 Atmos. Chem. Phys., 21, 1357–1373, 20211366 S. Ishidoya et al.: Secular change in atmospheric Ar/N2 in Fig. 6. Here the positive and negative rates correspond to the weakening and enhancement of the BDC simulations, re- spectively. These simulations with fixed horizontal mixing are not enough to represent the mechanism to drive the ob- served AoA change in the real atmosphere, but they do serve as a kind of sensitivity test. In this regard, we present the an- nual mean meridional distribution of the AoA trend for the weakened- and enhanced-BDC simulations in Appendix B. Based on some past studies, we have adopted a value of ±0.02 yr yr−1 as AoA trends for the BDC simulations: for example, Diallo et al. (2012) reported an increase in AoA of about 0.03 yr yr−1 in the middle stratosphere for the period 1989–2010 based on the ERA-Interim reanalysis data, while Fritsch et al. (2020) reported AoA unchanged within uncer- tainties over the northern mid-latitudes for the period 1975– 2016 based on the observations of CO2 and SF6 updated from Engel et al. (2009), and Waugh (2009) showed, based on results from chemistry–climate models, a negative AoA trend between −0.005 and −0.02 yr yr−1 for the time period and location considered by Engel et al. (2009). The secular AoA trends forced in our study fall within the range of these studies, although the observation periods do not overlap with each other. We regard these simulations to be a first step in in- vestigating the effect of gravitational separation of the whole atmosphere on δ(Ar/N2 ) at the surface. Secular changes in the simulated δ(Ar/N2 ) at the sur- face obtained from the weakened- and enhanced-BDC sim- ulation and those at 35 km are also shown in Fig. 6. As can be seen from the figure, clear inverse relationships are found between the secular trends of δ(Ar/N2 ) at the sur- Figure 6. Age of air (AoA) in the stratosphere at 35 km, δ(Ar/N2 ) face and those at 35 km. In the weakened-BDC simula- at the surface and δ(Ar/N2 ) at 35 km simulated by using the up- tion, δ(Ar/N2 ) changes secularly by 0.15 and −4.5 per dated SOCRATES 2-D model for weakened- and enhanced-BDC meg per year, respectively, at the surface and 35 km. In conditions (see text). Red solid and dashed lines denote secular the enhanced-BDC simulation, respective secular changes in trends of δ(Ar/N2 ) for the weakened- and enhanced-BDC simula- δ(Ar/N2 ) by −0.13 and 4.0 per meg per year at the sur- tions, respectively, obtained by applying linear regression analyses face and 35 km are found. As discussed above, atmospheric to the annual average data. δ(Ar/N2 ) is estimated to increase by 3.5 × 10⁻²³ per meg when 1 J of heat is added to a 3.5 ◦ C ocean water mass. Based on this relationship, when OHC increases by 93 ZJ driven only by the OHC change, is 0.60 ± 0.30 per meg per during 2012–2019, which is the global 0–2000 m OHC in- year. We can convert this increase rate to the global OHC crease from the NOAA/NCEI data, the increase rate in at- increase rate by assuming the abovementioned coefficient mospheric δ(Ar/N2 ) is estimated to be 0.46 per meg per of 3.5 (3.0) × 10−23 per meg per joule (hereafter referred year. Therefore, 0.15 (−0.13) per meg per year for the sur- to as the increase rate of “OHCArN2 ”). The obtained sec- face δ(Ar/N2 ) due to the weakening (enhancement) of the ular increase in OHCArN2 by 17.1 ± 8.6 (20.2 ± 10) ZJ yr−1 BDC is a non-negligible trend compared with the expected is shown in Fig. 7, together with that of the global 0– changes in atmospheric δ(Ar/N2 ) due to the global OHC in- 2000 m OHC reported by NOAA/NCEI (hereafter referred crease. to as “OHCoc ”). The increase rate of OHCArN2 is consis- Figure 7 shows the same annual average values and sec- tent with the OHCoc value of 12.2 ± 1.2 ZJ yr−1 within un- ular trend of atmospheric δ(Ar/N2 ) at TKB as in Fig. 5. certainties. Recently, by extracting a solubility-driven com- We calculated an increase rate of δ(Ar/N2 )cor by subtract- ponent of APO from their atmospheric O2 /N2 ratio and CO2 ing 0.15 per meg per year from the observed secular trend measurements and ocean model simulations, Resplandy et of 0.75 ± 0.30 per meg per year to remove the estimated ef- al. (2019) estimated the increase rate of the global OHC to be fects of δ(Ar/N2 ) increase obtained from the weakened- 12.9 ± 7.9 ZJ yr−1 for the period 1991–2016, which is con- BDC simulation. Thus, the derived secular increase rate of sistent, within the uncertainties, with the OHCoc during the δ(Ar/N2 )cor , which represents the increase rate of δ(Ar/N2 ) same period. The results of the present study and Resplandy Atmos. Chem. Phys., 21, 1357–1373, 2021 https://doi.org/10.5194/acp-21-1357-2021
S. Ishidoya et al.: Secular change in atmospheric Ar/N2                                                                      1367

et al. (2019) suggest the usefulness of atmospheric observa-       variation of surface δ(Ar/N2 ) is driven mainly by solubility
tions for independent confirmation of ocean heat uptake esti-      change in seawater and/or that the assumed ±10 % changes
mated from ocean temperature measurements.                         in the MMC intensity in our model are smaller than the ac-
   As described above, the increase rate in OHCArN2 obtained       tual interannual variation of the MMC. In addition, analytical
by using δ(Ar/N2 ) from the weakening BDC simulation              artifacts and the extremely difficult challenge of maintaining
agrees with the OHCoc estimate. On the other hand, the in-         stable standard air for δ(Ar/N2 ) could also be the cause(s)
crease rate in OHCArN2 of 25.1 ± 8.6 (29.6 ± 10) ZJ yr−1 ,         of the interannual variation. Therefore, further studies are
obtained by using δ(Ar/N2 ) from enhanced-BDC simula-             needed to achieve quantitative understanding of the discrep-
tion assuming the coefficient of 3.5 (3.0) × 10−23 per meg         ancy.
per joule, is significantly larger than the OHCoc estimate.           Consequently, if we regard OHCoc as representing “true”
In general, modeling studies have pointed to an accelerat-         global OHC, then we can estimate the secular trend and in-
ing BDC due to anthropogenic climate change (e.g., Austin          terannual variations in the BDC from δ(Ar/N2 ) observed at
and Li, 2006). However, the increase rate in OHCoc agrees          the surface. Conversely, if the simulated δ(Ar/N2 ) repre-
well with OHCArN2 based on the weakened-BDC simulation             sents true BDC changes, then we can validate OHCoc by
rather than on the enhanced-BDC simulation. In this regard,        using OHCArN2 . Therefore, the surface δ(Ar/N2 ) is found
several balloon-borne observations (Ray et al., 2014) and the      to be a unique tracer for detecting changes in a spatiotem-
ERA-Interim reanalysis data (Diallo et al., 2012) have sug-        porally integrated OHC and BDC. Not only precise ob-
gested aging of air in the northern-hemispheric mid-latitude       servations of δ(Ar/N2 ) over longer periods of time, but
mid-stratosphere, implying a slowdown in the deep northern-        also improvements in δ(Ar/N2 ) simulation using 3-D at-
hemispheric branch of the BDC. Garfinkel et al. (2017) ana-        mospheric transport models are important for future re-
lyzed a series of chemistry–climate model experiments con-         search advances in this field. For example, recently, Birner et
ducted for the period of January 1960 through 2014. They           al. (2020) simulated lower-stratospheric δ(Ar/N2 ) using the
found that structural changes in BDC have occurred in the          TOMCAT/SLIMCAT 3-D chemical transport model, which
BDC since 1980s; BDC accelerated in the lower strato-              has been updated to include gravitational fractionation of
sphere in the Northern Hemisphere and tropics but not in the       gases. Such activities will contribute significantly to under-
mid-stratosphere, and specifically since 1992, mean age in-        standing the mechanisms of spatiotemporal variations in the
creased by 0.12 years in the mid-stratosphere of the northern-     stratospheric and the surface δ(Ar/N2 ).
hemispheric mid-latitude, and tropical mass upwelling has
slowed down by 2 %. As discussed in our previous study
(Sugawara et al., 2018), gravitational separation of the strato-   4   Conclusions
spheric air is sensitive to changes in mean meridional circu-
lation rather than horizontal mixing. Therefore, it is thought     We have been carrying out systematic measurements of at-
that the increase in mean age in the mid-stratosphere in           mospheric δ(Ar/N2 ) at TKB and HAT since 2012 and at
the northern mid-latitude and the slowdown of tropical up-         COI and SYO since 2013 and 2016, respectively. Clear sea-
welling, suggested by the recent observational and modeling        sonal cycles of δ(Ar/N2 ) with summertime maximum were
studies, are consistent with our weakened-BDC simulation           found at TKB, COI and SYO, with peak-to-peak amplitudes
of the δ(Ar/N2 ) .                                                of 21 ± 10, 11 ± 4, 5 ± 10 and 32 ± 9 per meg at COI, TKB,
   We also carried out an additional simulation of                 HAT and SYO, respectively, which are in general agreement
δ(Ar/N2 ) , considering the interannual variation in the          with those observed at similar latitudinal sites by other inves-
BDC, to examine its effect on the large interannual varia-         tigators. The observed δ(Ar/N2 ) at TKB and HAT, after sub-
tions of the observed δ(Ar/N2 ) seen in Fig. 4. As the BDC         tracting seasonal cycles and shorter-term variations, showed
interannual variation, we simply assume a 10 % change in           significant interannual variations and slight, but detectable,
the MMC intensity with a 3-year cycle by changing the mass         secularly increasing trends. The observed interannual varia-
stream function in the 2-D model. Flury et al. (2013) re-          tions correlated positively with that of the global OHC, sug-
ported that the speeds of BDC towards the NH and SH show           gesting a strong correlation between large-area air–sea heat
interannual variabilities with amplitudes of about 21 % and        flux and the long-term change in δ(Ar/N2 ). However, the ra-
10 %, respectively, and that the amplitude of variability in       tio of interannual variation to secular increase is found to be
the ascent rate at the Equator is 21 %. Therefore, the 10%         much larger in δ(Ar/N2 ) than that in OHC, so further studies
change in the MMC in our simulation is not an unrealis-            are needed to interpret the discrepancy.
tic assumption. As a result, the increase rate of δ(Ar/N2 )          We improved the 2-D model we used in previous stud-
showed an interannual variation with a peak-to-peak ampli-         ies to calculate gravitational separation in order to evaluate
tude of ±0.4 per meg per year. This interannual variation is       its effect on the long-term change in the surface δ(Ar/N2 ).
non-negligible but still rather small compared to that found in    We simulated weakened and enhanced BDC by arbitrarily
the observed δ(Ar/N2 ), about ±4.5 per meg per year, as seen       changing the MMC (represented by mass stream function
from Fig. 4. Therefore, it is suggested that the interannual       in the model) and obtained effects of 0.15 and −0.13 per

https://doi.org/10.5194/acp-21-1357-2021                                            Atmos. Chem. Phys., 21, 1357–1373, 2021
1368                                                                       S. Ishidoya et al.: Secular change in atmospheric Ar/N2

Figure 7. (a) Same annual average values (gray filled circles) and secular trend (black solid line) of δ(Ar/N2 ) observed at TKB (from Fig. 5).
Thick blue and dashed blue lines denote the secular trends of δ(Ar/N2 )cor derived by subtracting the secular trends of δ(Ar/N2 ) expected
from weakened- and enhanced-BDC simulations, respectively, from the linear trend of δ(Ar/N2 ) at TKB. (b) Global OHC increase estimated
from the secular trends of δ(Ar/N2 )cor for weakened- and enhanced-BDC conditions (thick blue and dashed blue lines, respectively) using
a conversion factor of 3.5 × 10⁻²³ per meg per joule by assuming a one-box ocean with a temperature of 3.5 ◦ C. Light blue shade and
blue error bars denote the uncertainties of the OHC increases estimated from δ(Ar/N2 )cor for weakened- and enhanced-BDC conditions,
respectively. Red circles and the regression line denote the secular increase of 0–2000 m global OHC from NOAA/NCEI. (c) Same as in
panel (b) but for using a conversion factor of 3.0 × 10⁻²³ per meg per joule by assuming a one-box ocean with a temperature of 7.5 ◦ C.

Atmos. Chem. Phys., 21, 1357–1373, 2021                                                      https://doi.org/10.5194/acp-21-1357-2021
S. Ishidoya et al.: Secular change in atmospheric Ar/N2                                             1369

meg per year, respectively, on the secular trend of the surface
δ(Ar/N2 ). If we apply the correction for gravitational sep-
aration to the secular trend of δ(Ar/N2 ) observed at TKB,
then an average increase rate of 0.60 ± 0.30 per meg per
year for δ(Ar/N2 ) during 2012–2019 was obtained by as-
suming a weakening BDC. By using a conversion factor
of 3.5 (3.0) × 10−23 per meg per joule by crudely assum-
ing a one-box ocean with a temperature of 3.5 (7.5) ◦ C, we
obtained an increase rate in the global OHC of 17.1 ± 8.6
(20.2 ± 10) ZJ yr−1 for the 8-year period, which is consis-
tent with 12.2 ± 1.2 ZJ yr−1 reported by NOAA/NCEI from
the Argo float observations. On the other hand, the increase
rate in the global OHC, obtained from the secular trend of
δ(Ar/N2 ) at TKB under enhanced BDC, was found to be
significantly larger than that from the Argo float observa-
tions. These results indicate that the surface δ(Ar/N2 ) is a
unique tracer for spatiotemporally integrated OHC and BDC.
Although an increase in global OHC is well known as an es-
sential parameter to evaluate recent global warming, there is
no method yet to adequately measure OHC via ocean tem-
perature observations in the full-depth volume of the ocean.
Long-term precise observations of δ(Ar/N2 ) will meet this
demand after correction for gravitational separation of the
whole atmosphere.

https://doi.org/10.5194/acp-21-1357-2021                          Atmos. Chem. Phys., 21, 1357–1373, 2021
1370                                                                S. Ishidoya et al.: Secular change in atmospheric Ar/N2

Appendix A: Additional description of the SOCRATES
model

We performed numerical simulations using a two-
dimensional model of the middle atmosphere (SOCRATES)
developed by the National Center for Atmospheric Research
(NCAR) (Huang et al., 1998; Park et al., 1999; Khosravi
et al., 2002). Since details of our model calculation for
gravitational separation have already been described in
Ishidoya et al. (2013) and Sugawara et al. (2018), only a
brief description is given here. The model extends from the
surface to 120 km altitude with a 1 km vertical resolution and
from 85◦ S to 85◦ N latitude with a 5◦ latitudinal resolution.
The time step of this model can be varied to accommodate
chemical transport equations of various species. However,
in our study, we used a time step of 1 d, because Ar and N2        Figure B1. Annual mean meridional distribution of δ(Ar/N2 ) cal-
molecules have no chemical reaction and the time constant          culated using the updated SOCRATES model for the steady-state
of the molecular diffusion process is sufficiently longer than     condition. The values lower than −2500 per meg are shown in gray.
1 d. The meridional and vertical eddy diffusivity coefficients
(Kyy and Kzz ) are parameterized by including three types
of waves: planetary, gravity and tidal waves. The mass             are generally reproduced by the calculated δ(Ar/N2 ) , al-
transport processes caused by molecular diffusion were             though the fluctuations in the observed profiles are not sim-
originally taken into account only above the mesosphere            ulated. These fluctuations are also observed over Antarctica
in SOCRATES, since the molecular diffusion effect was              and could be attributed to the horizontal mixing of the strato-
thought to be negligibly small in the troposphere and              spheric air over the region (Ishidoya et al., 2018); their oc-
stratosphere, compared with the eddy diffusion effect. But         currences at low and middle latitudes are still not well un-
since our study needed to include the effect of molecular          derstood. Overall, however, we are satisfied with the perfor-
diffusion in the lower atmosphere, however small compared          mance of the updated SOCRATES model in reproducing the
to eddy diffusion, we simply lowered its vertical domain to        average vertical gradient of the δ(Ar/N2 ) profiles from the
the surface for the calculation of molecular diffusion. The        surface to the stratosphere.
molecular diffusion theory included in SOCRATES is based              Figure B3 shows the annual mean meridional distribu-
on Banks and Kockarts (1973).                                      tion of the AoA secular trend calculated using the updated
                                                                   SOCRATES model for weakened- and enhanced-BDC sim-
                                                                   ulations. The simulations were made by arbitrarily chang-
                                                                   ing the mass stream function in the model so that AoA
Appendix B: Performance of the updated SOCRATES
                                                                   changed by +0.02 (weakened BDC) or −0.02 (enhanced
model
                                                                   BDC) yr yr−1 at 35 km over the northern mid-latitudes. The
The annual mean meridional distribution of the δ(Ar/N2 )          AoA trends are larger in the middle stratosphere than those
value calculated using the updated SOCRATES model is               in the lower stratosphere for the weakened-BDC simulation.
shown in Fig. B1. The model shows that the vertical                This altitudinal increase in the AoA trend is consistent with
δ(Ar/N2 ) gradient increases with increasing height, espe-        that derived from the ERA-Interim (Diallo et al., 2012); how-
cially at high latitude, which is consistent with the meridional   ever, the updated SOCRATES model cannot reproduce the
distributions reported by Ishidoya et al. (2013) and Sugawara      negative AoA trend in the lower stratosphere found in Fig. 13
et al. (2018) calculated using the original SOCRATES model.        of Diallo et al. (2012). Ray et al. (2014) also reported an in-
The basic structure of the vertical–meridional δ(Ar/N2 )          crease and decrease in AoA in the middle and lower strato-
distribution can be interpreted as a result of a balance           sphere, respectively. Therefore, simulations of the BDC sec-
between the mass-dependent molecular diffusions and the            ular trend using the updated SOCRATES model do not fully
mass-independent transport processes. Figure B2 shows the          represent the details of the meridional distribution in the real
vertical δ(Ar/N2 ) profiles observed over Sanriku (39◦ N,          atmosphere. Further studies using 3-D models for validating
142◦ E), Japan, on 4 June 2007 (Ishidoya et al., 2013) and         the δ(Ar/N2 ) secular trend discussed in the present study
Biak (1◦ S, 136◦ E), Indonesia, on 22–28 February 2015             are needed.
(Sugawara et al., 2018). The vertical δ(Ar/N2 ) profiles cal-
culated by the updated SOCRATES model for the same sea-
sons are also shown. As seen from the figure, the average
vertical gradients of the observed vertical δ(Ar/N2 ) profiles

Atmos. Chem. Phys., 21, 1357–1373, 2021                                              https://doi.org/10.5194/acp-21-1357-2021
You can also read