ARTICLE IN PRESS Influence of Reduced Saliva Production on Phonation in Patients With Ectodermal Dysplasia
←
→
Page content transcription
If your browser does not render page correctly, please read the page content below
ARTICLE IN PRESS
Influence of Reduced Saliva Production on Phonation in
Patients With Ectodermal Dysplasia
Marion Semmler, Stefan Kniesburges, Franziska Pelka, Maria Ensthaler, Olaf Wendler, and
Anne Schu€ tzenberger, Erlangen, Germany

        SUMMARY: Objective. Patients with ectodermal dysplasia (ED) suffer from an inherited disorder in the devel-
        opment of the ectodermal structures. Besides the main symptoms, i.e. significantly reduced formation/expression
        of teeth, hair and sweat glands, a decreased saliva production is objectively accounted. In addition to difficulties
        with chewing/swallowing, ED patients frequently report on the subjective impression of rough and hoarse voices.
        A correlation between the reduced production of saliva and an affliction of the voice has not yet been investigated
        objectively for this rare disease.
        Methods. Following an established measurement protocol, a study has been conducted on 31 patients with ED
        and 47 controls (no ED, healthy voice). Additionally, the vocal fold oscillations were recorded by high-speed vid-
        eoendoscopy (HSV@4 kHz). The glottal area waveform was determined by segmentation and objective glottal
        dynamic parameters were calculated. The generated acoustic signal was evaluated by objective and subjective
        measures. The individual impairment was documented by a standardized questionnaire (VHI). Additionally, the
        amount of generated saliva was measured for a defined period of time.
        Results. ED patients displayed a significantly reduced saliva production compared to the control group. Fur-
        thermore, the auditory-perceptual evaluation yielded significantly higher ratings for breathiness and hoarseness
        in the voices of male ED patients compared to male controls. The majority of male ED patients (67%) indicated
        at least minor impairment in the self-evaluation. Objective acoustic measures like Jitter and Shimmer confirmed
        the decreased acoustic quality in male ED patients, whereas none of the investigated HSV parameters showed sig-
        nificant differences between the test groups. Statistical analysis did not confirm a statistically significant correla-
        tion between reduced voice quality and amount of saliva.
        Conclusions. An objective impairment of the acoustic outcome was demonstrated for male ED patients. How-
        ever, the vocal folds dynamics in HSV recordings seem unaffected.
        Key words: Ectodermal Dysplasia−Standardized Voice Evaluation−Saliva Production−Evidence-based Medi-
        cine.

                       INTRODUCTION                                                 development of the ectodermal structures.13,14 The most fre-
Communication is a major part of human interaction.1 An                             quent form of ED is an X-linked recessive inheritance,
impairment of the voice is directly linked to a limitation of                       which is why males are typically more strongly affected
social interaction and may even affect the perceived quality                        than females.15 Alongside the main symptoms, i.e. signifi-
of life for concerned individuals.2,3 Despite the immanent                          cantly reduced formation and expression of teeth, hair and
relevance of the human voice, the phonation process is not                          sweat glands, a decreased saliva production is objectively
yet fully understood.4,5 The airflow from the lungs and the                          accounted.16 Besides difficulties with chewing and swallow-
oscillating vocal folds in the larynx form the primary signal                       ing, ED patients frequently report on the subjective impres-
of voice in a complex fluid-structure-acoustic interaction.6−9                       sion of rough and hoarse voices.17 An objective and
Lately, the influence of hydration on the viscosity of the                           differentiated analysis with standardized voice-related diag-
laryngeal mucus, as well as in salivary flow and viscosity                           nostic tools has not yet been done for this rare disease.
have increasingly been recognized as essential players in                           Except for individual case studies, most studies rely on the
allowing adequate vibration of the vocal folds and vocal                            patient’s self-evaluation or expert opinions commenting
tract structures, respectively.10−12                                                on dryness of the mouth and voice only in general without
   The rare disease of ectodermal dysplasia (ED) offers                             further details.16,17
a unique opportunity to investigate this correlation.                                  In order to fill this gap, we designed this study on 31
Patients with ED suffer from an inherited disorder in the                           ED patients and 47 controls based on the established multi-
                                                                                    dimensional protocol by the European Laryngological
  Accepted for publication June 2, 2021.
  From the Division of Phoniatrics and Pediatric Audiology at the Department of
                                                                                    Society for functional voice assessment.18 The individual
Otorhinolaryngology Head & Neck Surgery, University Hospital Erlangen, Medical      impairment was documented by a standardized question-
School, Erlangen, Germany.
  Address correspondence and reprint requests to Marion Semmler, Division of
                                                                                    naire (VHI).19 The generated acoustic signal was evaluated
Phoniatrics and Pediatric Audiology at the Department of Otorhinolaryngology        by objective parameters, auditory-perceptive measures
Head & Neck Surgery, University Hospital Erlangen, Medical School, Erlangen, Ger-
many. E-mail: marion.semmler@uk-erlangen.de
                                                                                    for roughness, breathiness, hoarseness (RBH) and by
  Journal of Voice, Vol. &&, No. &&, pp. &&−&&                                      the performance in the phonetogram.20,21 The visual inspec-
  0892-1997
  © 2021 The Voice Foundation. Published by Elsevier Inc. All rights reserved.
                                                                                    tion of the vocal folds by videoendoscopy was comple-
  https://doi.org/10.1016/j.jvoice.2021.06.016                                      mented with high-speed video (HSV) recordings and
ARTICLE IN PRESS
2                                                                                  Journal of Voice, Vol. &&, No. &&, 2021

computer-calculated glottal dynamic parameters.22,23 By           TABLE 1.
this, an impairment of the voice iin ED patients could be         Age Distribution of All Subjects in This Study.
analyzed objectively. More specifically, the differences
between males and females were revealed and the different         Group           EDm         Cm          EDf         Cf
                                                                  Age (yrs)       N = 18      N = 26      N = 13      N = 21
involvement of the vocal fold dynamics and the acoustic
outcome could be discussed in detail.                             Median          40.0        24.0        35.5        24.0
   Moreover, the production of saliva was measured in all         Minimum         19          20          28          19
participants of the study for a defined period of time             Maximum         65          36          62          63
(5 minutes of saliva measurement after 5 minutes chewing
of neutral gum). This enabled a systematic investigation of
correlations between the reduced amount of saliva and the        handicap index (VHI) documenting the individual voice-
different factors involved in voice production (vocal fold       related impairment.19
oscillation dynamics, acoustic signal, performance in phone-        The acoustic quality was evaluated by SLPs on the basis
togram etc) which offers new possibilities to conduct funda-     of the phonetogram, recording the maximally achieveable
mental research on the phonation process.                        pitch and intensity range20,21 and with an auditory-percep-
   Besides the general relevance of gaining further              tive evaluation of roughness, breathiness and hoarseness
overall knowledge on the role of laryngeal mucus and             (RBH) on a standardized German reading text (“Der Nord-
saliva in phonation, we are convinced that this work will        wind und die Sonne”). This was done using the software
be even more significant for personally affected ED               tool Lingwaves by Wevosys (Baunach, Germany) with
patients. We obtained a reliable confirmation of an               default settings. The acoustic evaluation was completed by
objective impairment of the voice in ED patients and             a recording of sustained phonation of the vowel /a/ for com-
thereby achieve recognition of their subjective impression       puter-based analysis, which is further specified in the follow-
of a hoarse voice. This will be highly valuable for opti-        ing paragraph.
mal patient care and focused therapy for the rare disease           For structural and functional assessment, the vocal fold
ED. A profound knowledge of the underlying correla-              oscillations were recorded by high-speed videoendoscopy
tions might even trigger further developments regarding          (HSV). The imaging unit comprised a rigid PENTAX Medi-
synthetic mucus and saliva.24                                    cal (Montvale, NJ) laryngoscope (70° optic) which was con-
                                                                 nected to the Photron FASTCAM MC2 high-speed camera
                                                                 via Precision Optics Corporation (Gardner, MA) zoom cou-
                        METHODS
                                                                 pler. The high-speed videos were recorded with 512 £ 256
Study participants                                               Px at 4 kHz.
In total, 31 patients with a diagnosed form of the rare dis-        In addition to the voice-related diagnostic techniques, the
ease ectodermal dysplasia (ED) were investigated at the          amount of generated saliva was measured. All participants
annual meeting of the largest German support group for           were asked to refrain from eating 2 hours prior to the mea-
ED, “Ektodermale Dysplasie e.V.” in 2018. 18 male                surement. The subjects were given a neutral paraffin pellet
patients (EDm) and 13 female patients (EDf) participated.        (Ivoclar Vivadent, Schaan, Liechtenstein) to chew for
At this occasion 11 children were recorded, as well, but not     5 minutes in order to stimulate salivation. Subsequently, all
included in the present study because of their large diversity   generated saliva was then collected by spitting into a cup for
in age/gender and unclear status of voice break. The healthy     further 5 minutes and weighed.
control group (no ED and no current or previous voice
pathologies) contained 26 male test subjects (Cm) and 21         Data processing and analysis
female test subjects (Cf), who were recruited at the Frie-       To increase the reliability of the auditory-perceptive evalua-
drich-Alexander University Erlangen-N€   urnberg. The age of     tion, the assessment of roughness, breathiness and hoarse-
the control group covers a similar range to ED patients          ness was performed by three trained SLPs on anonymized
from 19 to 65 years, even so the medians differ by 10-           and blinded data sets. The results were averaged over the
15 years between the gender-specific subgroups. The age dis-      three raters and mean values were used in the subsequent
tribution with median, minimum and maximum values in             statistical analysis.
every subgroup is given in Table 1. All measurements in this        The objective acoustic parameters were determined with a
study are covered by a votum of the local ethics commission      well-established software tool, known as Glottis Analysis
(ref. N° 61_18B).                                                Tools (GAT), that was developed in-house.23,25,26 A
                                                                 sequence of 5 seconds in the acoustic signal was analyzed in
Data acquisition and measurement protocol                        each recording, which fulfills established recommendations
This study followed the recommendations of the measure-          of using at least 100 cycles.27 The GAT software provides
ment protocol established by the European Laryngological         an automated cycle-based determination of the fundamental
Society (ELS) for a functional assessment of voice patho-        frequency f0 and calculation of commonly used parameters
logies.18 This multimodal diagnostic scheme included a           reflecting the acoustic signal quality, i.e. Jitter, Shimmer,
standardized questionnaire for self-evaluation, i.e. voice       and cepstral peak prominence (CPP).28,29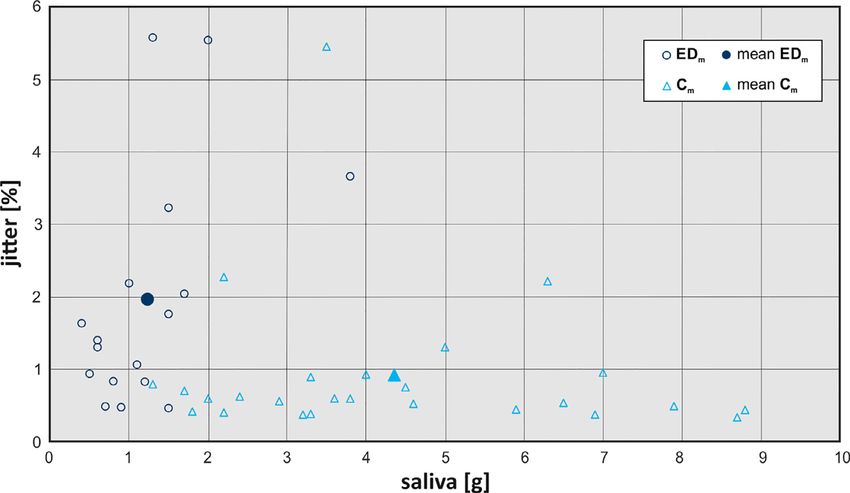
ARTICLE IN PRESS
Marion Semmler, et al           Influence of Reduced Saliva Production                                                          3

   The automated analysis of the vocal fold dynamics was           TABLE 2.
performed on a signal sequence of 25 consecutive oscillation       Available Data Sets Per Group That are Suitable for Eval-
cycles in each HSV recording. For the glottal area wave-           uation and Comparison.
form (GAW), a minimum signal length of 20 cycles is rec-
                                                                   Group                           # EDm    # Cm   # EDf   #Cf
ommended for parameter stability.30 The GAT software
                                                                   Measurement
enables an automatic segmentation of the glottal area wave-
form, cycle detection and calculation of glottal dynamic           Saliva measurement              18       26     13      21
parameters.24−26 The characteristic features for healthy           Voice handicap index            18       26     13      21
phonation are represented in the chosen parameters: glottal        Phonetogram                     18       26     13      21
                                                                   Auditory-perceptive             17       26     12      20
gap index (GGI)31 and closing quotient (CQ)32 reflect clo-
                                                                    evaluation
sure of the vocal folds, amplitude periodicity (AP)33 and          Objective audio parameters      17       26     13      21
time periodicity (TP)33 quantify the regularity of the com-         on /a/
plete GAW oscillation, while the phase asymmetry index             Objective HSV parameters        16       23     11      19
(PAI)33 and the amplitude symmetry index (ASI)34 measure            on /i/
temporal and spatial differences between the behavior of
left and right vocal folds.
   Statistical tests were employed to reveal significant differ-
ences between ED patients and controls. Considering the             For visualization and intuitive comparison, a series of
gender-specific expression of the disease, all comparisions        box-whisker-plots was generated displaying the median val-
and tests were performed separately within the male (EDm          ues as well as the interquartile ranges (IQR) limited by the
 Cm) and within the female subgroup (EDf  Cf). A              lower and upper quartiles, eg in Figure 1. The whiskers indi-
Shapiro-Wilk test with a significance level of P = 0.05 was        cate the highest and lowest values within 1.5 IQR. In order
applied to test the two subgroups (Nm = 44, Nf = 34) for          to reflect the complete range of data points, the outliers
normal distribution. Accounting for small-sized subgroups,        (>1.5 IQR) were included as circles and extreme outliers
which were mostly not normally distributed, the non-              (>3 IQR) as stars. Statistically significant differences within
parametric Mann-Whitney U test for comparison of two              each gender were indicated by brackets (P< 0.05). For the
groups was applied with a significance level of P = 0.05 in        sake of completeness, the box-whisker-plots of parameter
order to find statistically significant differences between         groups that display no statistically significant differences
(EDm  Cm) and (EDf  Cf). All statistics were per-             between patients with ED and controls are provided in the
formed using SPSS version 24 (IBM, Armonk, NY).                   Supplementary Materials (Figure S1-S2).
Detailed results are provided in the Supplementary Materi-
als in Table S1 and Table S2.
                                                                  Saliva production
                                                                  The mean values of the measured weight of saliva for all
                                                                  subgroups are shown in Table 3. The Mann-Whitney U test
                          RESULTS
                                                                  in the male group showed that the difference between the
The total number of 78 data sets did not enter the statistical
                                                                  mean saliva weight of 1.2 § 0.8 g for EDm and 4.4 § 2.2g
analysis in its entirety. In the auditory-perceptive evalua-
                                                                  for Cm was statistically significant (Z = 5.063, P < 0.001).
tion, three recordings of the reading text had to be excluded
                                                                  The small difference between EDf (2.5 § 1.3g) and Cf (3.4
due to their speaker’s foreign accents inhibiting an unbiased
                                                                  § 2.1g) was not statistically significant.
assessment. One acoustic recording for calculation of objec-
                                                                     The distribution of saliva over the test groups is illus-
tive parameters had to be excluded for environmental back-
                                                                  trated in Figure 1 (left). The interquartile ranges (IQR) and
ground noise. Finally, the largest losses were registered
                                                                  whiskers of the control groups Cm and Cf were considerably
among the HSV recordings, where nine recordings did not
                                                                  larger than for EDm and EDf. Despite the reduced median
meet the necessary quality or length for further processing,
                                                                  and range of saliva in EDf compared to Cf, the data lies
which is typically due to the gagging reflex or fogging. A
                                                                  within the IQR of Cf reflecting the results of Mann-Whitney
detailed account of the analyzed data sets in each subgroup
                                                                  U test.
is given in Table 2.
   An overview on the mean values and standard deviations
of all evaluated parameters is presented in Table 3. The indi-    Self-evaluation by VHI
vidual parameters are grouped under the corresponding             In the group comparison of male test subjects (Table 3), a
measurements. The investigated subgroups in the columns           statistically significant increase in the mean values of VHI
were sorted for separate comparison of males (left: EDm         for EDm (28.8 § 22.7) compared to Cm (5.1 § 5.9) was
Cm) and females (right: EDf  Cf). The pairs of mean val-        found (Mann-Whitney U: Z = 4.676, P < 0.001). The
ues with statistically significant difference according to the     enlarged whiskers and outliers (VHI = 93) in the boxplot
Mann-Whitney U test were highlighted by red cells. Further        illustration in Figure 1 (right) attest to the widely extended
details on the test results of the statistical analysis can be    data distribution covering almost the complete scale to the
found in the Supplementary Materials (Table S2).                  maximum of VHI at 120.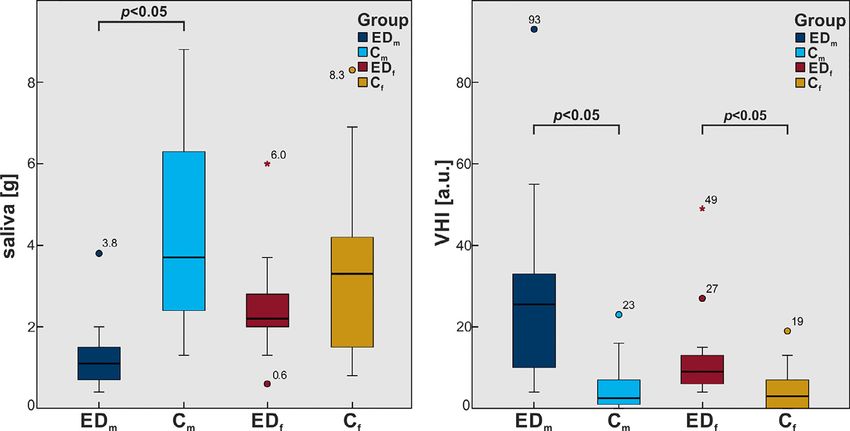
ARTICLE IN PRESS
4                                                                                            Journal of Voice, Vol. &&, No. &&, 2021

 TABLE 3.
 Mean Values and Standard Deviations of all Investigated Parameters Averaged for all Test Groups. Statistically Signifi-
 cant Differences (P < 0.05 in Mann-Whitney U test) Between ED Patients and Controls are Highlighted in Bold Style.
                                           EDm                        Cm                        EDf                        Cf
 Parameter (unit)                          mean § std                 mean § std                mean § std                 mean § std
 Saliva (g)                            1.2 § 0.8                      4.4 § 2.2                 2.5 § 1.3                  3.4 § 2.1
 Patient’s self-evaluation
 VHI (a.u.)                            28.8 § 22.7                    5.1 § 5.9                 13.1 § 12.3                4.4 § 5.0
 Phonetogram
 Lowest f0 (Hz)                        87.3 § 10.4                    86.1 § 12.0               131.5 § 34.4               135.4 § 19.6
 Highest f0 (Hz)                       384.8 § 100.7                  503.6 § 167.6             673.2 § 208.7              745.7 § 309.8
 Pitch range (Hz)                      297.6 § 103.5                  419.2 § 166.6             541.7 § 206.3              610.2 § 308.6
 Lowest SPL (dB)                       52.2 § 7.6                     53.1 § 7.1                52.8 § 5.4                 49.2 § 5.8
 Highest SPL (dB)                      92.2 § 9.6                     94.0 § 7.0                89.5 § 8.8                 90.7 § 10.1
 Intensity range (dB)                  40.1 § 13.0                    40.9 § 8.7                36.8 § 11.0                41.4 § 13.6
 Auditory-perceptive evaluation
 Roughness R (a.u.)                    0.78 § 0.64                    0.50 § 0.45               0.50 § 0.54                0.23 § 0.29
 Breathiness B (a.u.)                  0.55 § 0.55                    0.14 § 0.21               0.25 § 0.25                0.22 § 0.29
 Hoarseness H (a.u.)                   1.00 § 0.62                    0.54 § 0.44               0.56 § 0.50                0.37 § 0.34
 Objective audio parameters on /a/ (5 sec)
 CPP (dB)                              29.4 § 3.8                     31.3 § 2.8                33.4 § 5.0                 32.8 § 2.9
 Shimmer (%)                           16.9 § 15.4                    10.3 § 11.2               18.5 § 27.6                10.1 § 6.4
 Jitter (%)                            2.0 § 1.6                      0.9 § 1.1                 1.9 § 1.4                  1.4 § 0.7
 Objective HSV parameters on /i/ (25 cycles)
 Closing Quotient (a.u.)               0.36 § 0.10                    0.34 § 0.10               0.39 § 0.12                0.46 § 0.08
 Glottal Gap Index (a.u.)              0.05 § 0.09                    0.03 § 0.06               0.08 § 0.16                0.08 § 0.09
 Amp. Periodicity (a.u.)               0.98 § 0.01                    0.98 § 0.01               0.98 § 0.01                0.98 § 0.01
 Time Periodicity (a.u.)               0.97 § 0.01                    0.96 § 0.02               0.96 § 0.02                0.96 § 0.02
 Phase Asymm. Index (a.u.)             0.03 § 0.04                    0.01 § 0.03               0.03 § 0.04                0.03 § 0.04
 Amp. Symm. Index (a.u.)               0.91 § 0.04                    0.91 § 0.04               0.92 § 0.04                0.92 § 0.06

   In the female test group, there was a statistically                   Z = 3.173, P = 0.002). It is notable that this was the
significant difference in the mean values of subjective                   only significant difference in the comparison of female
self-evaluation by VHI questionnaire between 13.1 §                      participants in the investigated parameters of this study
12.3 for EDf and 4.4 § 5.0 for Cf (Mann-Whitney U:                       (Table 3).

FIGURE 1. Boxplot of saliva (left) and VHI (right) for all four test groups. Statistically significant difference within each gender group is
indicated by brackets (P < 0.05).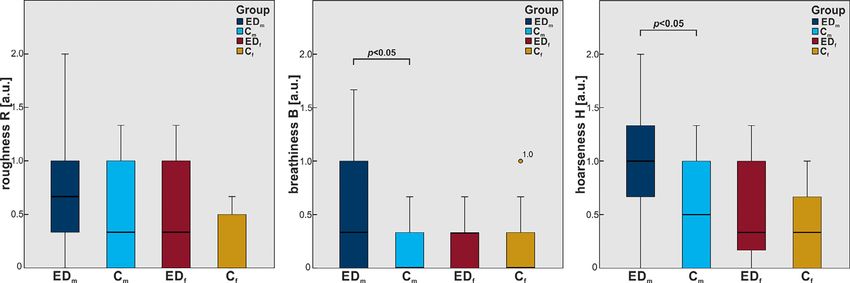
ARTICLE IN PRESS
Marion Semmler, et al             Influence of Reduced Saliva Production                                                                 5

Auditory-perceptive measures                                            EDm (297.6 § 103.5 Hz) and Cm (419.2 § 166.6 Hz) was
The professional assessment of the standardized reading                 statistically significant (Z = -2.292, P = 0.022) but not
passage determined increased mean values in all auditory-               between EDf and Cf.
perceptive measures for both ED groups with respect to                     In addition to the range of frequencies, the maximum
their control group (Table 3). However, only breathiness                range of attainable intensity was ascertained by the low-
and hoarseness in the comparison of EDm to Cm proved to                 est and highest sound pressure level (SPL). The resulting
be statistically significant in the Mann-Whitney U test                  mean values are remarkably homogeneous over all four
(breathiness: Z = 2.727, P = x003D 0.006; hoarseness:                   test groups (Table 3). The lowest SPL over all four test
Z = 2.356, P = x003D 0.018). The roughness values of                    groups was around 50 dB, the highest SPL was around
EDm were slightly increased with respect to Cm, but yielded             90 dB and the resulting intensity range at 40 dB. The
no significant P-values.                                                 mean values of lowest SPL, highest SPL and intensity
   All boxplots in Figure 2 illustrate that the covered range           range differed by less than 2 dB between the male groups
of values is widest for the experimental group EDm. For the             EDm and Cm and less than 5 dB between the female
female test group EDf, the boxplots of roughness and                    groups EDf and Cf. None of the comparisons displayed
hoarseness showed small widening of the covered ranges                  statistical significance. The corresponding boxplots of
compared to Cf. However, this trend did not prove to be sta-            the intensity ranges along with further details on the
tistically significant.                                                  statistic tests are given in the Supplementary Materials
                                                                        (Figure S1).

Phonetogram                                                             Objective acoustic parameters
As part of the phonetogram the lowest and highest achiev-               The acoustic parameters are calculated on the basis of sus-
able frequencies and the resulting pitch range of each                  tained phonation of the vowel /a/. In contrast to the phone-
test subject as measured by a trained SLP are given                     togram, the acoustic signal is recorded at comfortable pitch
in Table 3. Naturally, the male (f0,min  87 Hz) and female             and loudness. The fundamental frequency is determined
(f0,min  133 Hz) test groups were clearly separated. How-              with the GAT software by minimum-based cycle detec-
ever, within each gender group, the mean values of the                  tion. The mean values for each test group are given in
lowest obtainable frequency differed by less than 5 Hz                  Table 4. The mean values in the male subgroups differ
between ED patients and controls, which was equally                     only marginally by 4 Hz while the female subgroups dis-
reflected in the non-significant statistics and in the box-               play 30 Hz difference in the fundamental frequency of
plot with medians, see Figure 3 (left). The Mann-Whit-                  the acoustic recording.
ney U test on the mean values showed, that the difference                  The mean values of the objective acoustic parameters
in the highest possible frequency between males’ groups                 CPP, Shimmer and Jitter for all subgroups are shown in
EDm (384.8 § 100.7 Hz) and Cm (503.6 § 167.6 Hz) was                    Table 3. The mean values of CPP were slightly higher for
statistically significant (Z = -2.244, P = 0.025). The differ-           the female subgroups around 33 dB than for the male sub-
ence between the females EDf (673.2 § 208.7 Hz) and Cf                  groups around 30 dB. The differences between ED patients
(745.7 § 309.8 Hz) was not statistically significant                     and controls were not statistically significant, which was
(Z = 0.408, P = 0.683). The boxplot depiction on                        also reflected in the rather homogeneous distribution in the
medians and quartiles was less clear for this distribution,             boxplots of Figure 4 (left).
see Figure 3 (middle). As a result of lowest and highest                   The mean Shimmer values were larger in both ED groups
achievable frequency, the difference in pitch range between             (ca. 17%) compared to their controls (ca. 10%) in Table 3.

FIGURE 2. Boxplot of roughness, breathiness and hoarseness for all four test groups. Statistically significant difference within each gender
group is indicated by brackets (P < 0.05).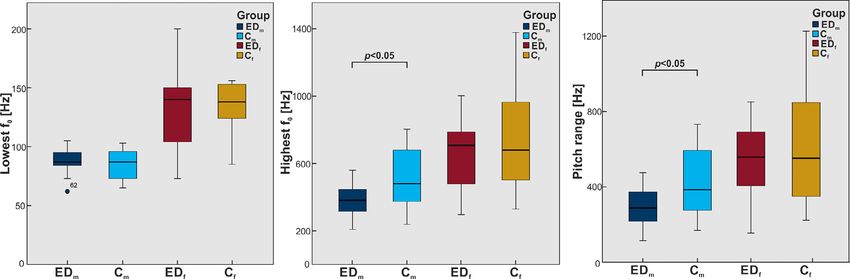
ARTICLE IN PRESS
6                                                                                            Journal of Voice, Vol. &&, No. &&, 2021

FIGURE 3. Boxplot of achieved frequencies in phonetogram: lowest f0, highest f0 and pitch range for all four test groups. Statistically sig-
nificant difference within each gender group is indicated by brackets (P < 0.05).

Despite relatively large standard deviations in both male                   Objective HSV parameters were calculated for three dif-
subgroups (see Figure 4 [middle]), the differences between               ferent characteristics, namely closure, periodicity and sym-
the mean Shimmer values of EDm (16.9 § 15.4%) and Cm                     metry, Table 3. Mean values and standard deviations of
(10.3 § 11.2%) were statistically significant according to the            all investigated parameters averaged for all test groups. Sta-
Mann-Whitney U test (Z = -2.385, P = 0.017). Apart from                  tistically significant differences (P < 0.05 in Mann-Whitney
one extreme outlier in EDf, the distribution of the female               U test) between ED patients and controls are highlighted in
Shimmer values displayed a smaller variation and no statis-              red cells. Apart from the two closure values CQ and GGI,
tical significance was found.                                             the determined mean values were almost identical over all
   In Figure 4 (right), the Jitter values behaved similarly              subgroups: AP = 0.98, TP  0.96, PAI  0.03, ASI  0.91.
but more pronounced than the Shimmer values. As                          The only noticeable deviation occurred between the clo-
shown in Table 3, the mean values in the ED groups                       sure parameters of males and females, however indepen-
were both larger than the corresponding control group.                   dent from the experimental group (ED or C). Females
The differences between the mean Jitter values of EDm                    displayed slightly larger closing quotients and higher
(2.0 § 1.6%) and Cm (0.9 § 1.1%) were statistically sig-                 glottal gap indices (CQ  0.43, GGI = 0.08) than males
nificant according to the Mann-Whitney U test                             (CQ  0.35, GGI = 0.04). According to the Mann-Whit-
(Z = 3.055, P = 0.002), whereas the differences in the                   ney U test, none of the objective HSV parameters proved
female subgroups were not statistically significant.                      to be statistically different between the experimental
                                                                         groups (ED or C). More details on the statistics and the
                                                                         boxplot for all HSV parameters are provided in the Sup-
Objective HSV parameters                                                 plementary Materials (Figure S2).
The HSV parameters were calculated on the basis of sus-
tained phonation of the vowel /i/. Just as for the computed
acoustic parameters, the HSV was recorded at comfortable                                        DISCUSSION
pitch and loudness. The fundamental frequency was deter-                 The findings on the reduced salivation concur with other
mined with the GAT software by maximum-based cycle                       studies on patients with ED, showing significantly reduced
detection. The mean values for each test group are given in              saliva in EDm compared to Cm.16,35 The generated
Table 4. The mean values in the male subgroups were about                amount of saliva was reduced for EDf compared to Cf,
100 Hz smaller than in the female recordings. Both ED                    as well, but the effect was not statistically significant.
groups were 25 30 Hz below their gender-specific control                  This is in line with literature reporting on microsymp-
groups.                                                                  toms in female ED patients.15,36

 TABLE 4.
 Fundamental Frequency Determined by Cycle Detection on Sustained Phonation of /a/ in Acoustic Signal and of /i/ in HSV
 Recordings. Mean Values and Standard Deviations are Calculated Separatedly for Each of the Four Test Group.
 Group                            EDm                           Cm                            EDf                           Cf
 Parameter                        mean § std                    mean § std                    mean § std                    mean § std
 /a/: f0,audio (Hz)               126.5 § 18.8                  122.7 § 29.6                  239.5 § 51.5                  209.6 § 33.4
 /i/: f0,HSV (Hz)                 170.5 § 43.0                  196.4 § 79.1                  260.8 § 44.1                  292.4 § 63.5
ARTICLE IN PRESS
Marion Semmler, et al Influence of Reduced Saliva Production 7
FIGURE 4. Boxplot of objective acoustic parameters calculated on sustained phonation of vowel /a/: CPP, Shimmer and Jitter for all four
test groups. Statistically significant difference within each gender group is indicated by brackets (P < 0.05).
The different elements of the ELS protocol enabled an displayed the highest H values in this distribution,
objective and differentiated assessment of the voice in ED whereas the highest VHI values occurred with best SLP
patients compared to vocally healthy controls. ratings for hoarseness (VHI = 93; H = 0.3).
The phonetogram showed that only the highest achiev-
able frequency was affected in male ED patients, but not
Clinical parameters the lowest frequency. Normative values for f0,max in healthy
The VHI questionnaire documented functional, physical males are inconsistent in literature ranging from around
and emotional aspects resulting from the impaired voice in 300 Hz38 to over 600 Hz.39 Even though the highest f0 was
daily life on a scale 0-120. The determined mean values of significantly lower in EDm compared to Cm, the obtained
both ED groups compared to their gender-specific control pitch range is not pathological.38 It has been shown that the
groups were significantly increased. 67% of the male ED observed decrease of the highest reachable frequency is also
patients and 23% of the female ED patients stated at typical for functional dysphonia.39
least “minor” impairment of the voice (VHI > 14) com-
pared to less than 8% in Cm and 2% in Cf.37 In the EDm
group, even four cases with “high degrees” of voice Objective acoustic parameters
impairment (VHI > 50) occurred. It is noteworthy, that Based on a 5 sec sequence of sustained phonation (/a/), three
this was the only parameter in the ELS protocol that objective acoustic parameters were calculated, i.e. CPP,
was tested statistically significant between EDf and Cf, Shimmer und Jitter. The mean CPP values of around 30 dB
even though the expression of ED symptoms is typically for all groups were higher than the typically reported nor-
greatly reduced in females.36 mative range of healthy adults, which could be attributed to
In the auditory-perceptive evaluation, only the parame- different recording techniques.40 The statistical test and
ters breathiness and consequently hoarseness were affected graphic evaluation displayed no clear trends between ED
in the male ED group, confirming earlier studies.17 With patients and control. As a measure of the harmonic content,
less than 30% of EDm displaying more than H = 1 (minor the parameter seemed to be unaffected by this disease. As
limitations) and no cases of H>2 (severe limitation), the per- opposed to this, the Jitter and Shimmer quantifying the vari-
ceived voice quality was not drastically affected but the ability of the periodic length and amplitude in the acoustic
effect was still statistically significant. signal were significantly increased for EDm compared to
In order to put the self-evaluation via VHI questionnaire Cm. The increased values of Jitter and Shimmer indicated
and the external assessment on the RBH scale by trained lower regularity of the signal for EDm and by this lower
SLPs into perspective, a scatter plot with the data of all acoustic quality. Curiously, the decreased regularity is usu-
test subjects and the mean values over all subgroups is pro- ally accompanied by increased values for roughness in the
vided in Figure 5. Both control groups were mainly located perceptive evaluation, which did not prove to be statistically
around VHI = 5 and up to H = 1. The EDf group was significant in this study.
only slightly shifted towards higher VHI values (13.1) From the results of the phonetogram with significantly
covering a larger area than Cf up to VHI = 49. The decreased f0,max for the EDm group, it could be assumed
mean value and distribution of EDm was distinctly that the acoustic parameters might be dependent on the fun-
shifted towards higher values of VHI and hoarseness. It damental frequency, which would distort the statistical
is remarkable that some test subjects (VHI < 30; H = 2) effects due to collinearities. In order to exclude this kind
with the subjective impression of a minor impairment of bias on the acoustic parameters, the fundamentalARTICLE IN PRESS
8 Journal of Voice, Vol. &&, No. &&, 2021
FIGURE 5. Distribution of hoarseness over VHI for four test groups. Mean values calculated separately over each test group are indicated
by corresponding filled marker points.
frequencies of all acoustic recordings were evaluated which reflect the essential properties of vocal fold dynamics being
yielded no significant difference, as shown in Table 4. closure, symmetry and periodicity. However, none of the
In addition to the Mann-Whitney U tests between two determined parameters showed statistically significant dif-
subgroups, an investigation on the influence of saliva on the ferences between EDs and controls. All parameters lay
parameters with statistically significant differences between within the normative range of healthy adults.41,42 Only, the
EDm and Cm would be highly desirable. Further statistical GGI was slightly increased for the female subgroups com-
tests on the underlying correlations are thought to provide a pared to the male subgroups, which is known in physiologi-
deeper understanding of the role of saliva (and vocal fold cal phonation of women and children.43−45 Moreover, even
hydration in general) on the phonation process. However, though not statistically significant, the GGI was slightly
due to small samples sizes and insufficient homogeneity in increased for EDm (0.05 § 0.09) to Cm (0.03 § 0.06), which
the subgroups, we refrained from further tests like AN(C) might be associated to the increased breathiness in the EDm
OVA or mixed models, until further data is recorded. subgroup.46
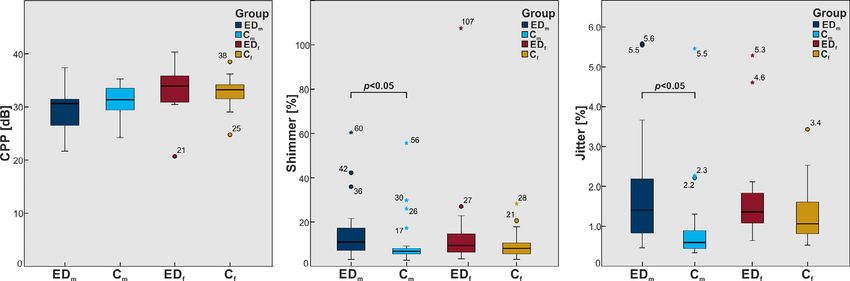
As a preliminary measure, a graphic evaluation of the In line with literature, the evident decrease of saliva pro-
parameters with prominent differences between the data duction in ED patients (Table 3, Figure 1) insinuated a simi-
sets of EDm and Cm was chosen. Representatively, the dis- lar reduction of the laryngeal mucus.35,16 Furthermore, it
tribution of Jitter% over saliva in Figure 6 allows a compari- was reported in numerous studies, that the hydration level
son of male ED patients and male controls. Further of the vocal folds affects the glottal dynamics.47,48 There-
distributions of breathiness, hoarseness and f0,max from the fore, it is remarkable that despite the decreased salivation in
phonetogram is provided in the Supplementary Materials ED patients and despite the undeniable impairment of the
(Figure S3-S5). acoustic outcome, there was no statistically significant effect
In Figure 6, the two data sets EDm and Cm are clearly on the vocal fold dynamics quantified by the HSV parame-
separated along the x-axis displaying the measured weight ters in this study.
of saliva. Moreover, the offset of the EDm group and its Nevertheless, there could still be a significant difference in
mean value towards higher Jitter values is obvious, as well. male ED patients on the laryngeal level, which is simply not
However, there was no indication within either subgroup reflected in the chosen HSV parameters. These differences
that smaller amounts of saliva generally result in higher Jit- between male ED patients and controls could possibly arise
ter values. Based on the graphic evaluation, it was not con- from the interaction at the boundary layer between airflow
clusive that the reduced salivation causes the reduced voice and mucosal tissue surface. In the future, this should not
quality. Other properties than the sheer weight of the saliva, only be further investigated in the larynx but in the complete
like viscosity or rheology,11 may contribute to the phona- vocal tract.
tory process and the acoustic outcome.
LIMITATIONS / OUTLOOK
Objective HSV parameters A common drawback in studies on rare diseases like ecto-
Based on the endoscopic HSV recordings of sustained pho- dermal dysplasia is the limited number of participants,
nation of /i/, objective HSV parameters were calculated to which hampers the application of advanced statisticalARTICLE IN PRESS
Marion Semmler, et al Influence of Reduced Saliva Production 9
FIGURE 6. Distribution of Jitter% over saliva for male test groups. Mean values calculated separately over each test group are indicated
by corresponding filled marker points.
models. Furthermore, in this preliminary study, the genetic besides the saliva from the oral cavity. However, the laryn-
expression of the ED patients could not be considered. It geal mucus is practically inaccessible without sedation of
will be insightful to analyze if and how the different forms the patients,11 which limits the availability severely. There-
of ED are possibly affected in different ways. fore, further research on the general correlation of saliva
Future studies should incorporate further details on the and laryngeal mucus would be desirable even outside the
vocal tract by considering accompanying symptoms like the context of ectodermal dysplasia.
dental status and dryness of the oral cavity. Several con-
ditions involving mucous glands like Sj€ ogren’s syndrome
CONCLUSIONS
exhibit a proneness to gastrointestinal problems and lar-
The standardized ELS protocol for the functional assess-
yngopharyngeal reflux, which could equally influence the
ment of the voice comprised subjective and objective evalua-
voice quality.49−51
tions of the phonation process, which were complemented
The high-speed videos were recorded in black/white
by blinded ratings and statistical methods. Overall, this
images, which allows for automated computer-based analy-
study demonstrated an unambiguous impairment of the
sis but only limited evaluation of inflammation, laryngitis,
acoustic outcome in male patients with ectodermal dyspla-
dryness etc. A second endoscopy with colored imaging
sia (ED) but no affliction of the vocal fold dynamics in
would have exceeded the timeframe of this study. Further-
the HSV recordings. The impairment of the voice might
more, we deliberately concentrated on reliable measures
seem subordinate compared to other symptoms of ED.
and decided to evaluate the HSV recordings by objective
However, since the voice contributes significantly to the per-
parameters only. However, we plan to extend the objective
ceived quality of life3,54−56 it should be considered seriously
analysis to saliva and laryngeal mucus. In addition to the
within the diagnostic and therapeutic process. Further
mere weight of the generated saliva, future studies are
investigations are required to determine the role of hydra-
planned to incorporate the composition (i.e. enzymes, pro-
tion within the fluid-structure-acoustic interaction of the
teins, etc) and consistency (i.e. elasticity, viscosity, etc) of
phonation process.
the collected saliva. In order to ensure comparability of the
data sets, the conditions of the saliva measurement should
be further restricted with regard to drinking, teeth brushing Acknowledgments
and smoking prior to the measurements.52 Even the time of This project was done in context of and partially supported
the day should be considered as it might influence the saliva by Deutsche Forschungsgemeinschaft (DFG) under grant
production.53 DO1247/6-2 (no. 281313362). We thank all members of
In order to gain further knowledge on the functional the support group “Ektodermale Dysplasie e.V.” for their
interaction in the larynx and the effect of hydration, it cooperation and participation in this study. We further
would be preferable to investigate the laryngeal mucus thank the board members and especially their chairwomanARTICLE IN PRESS
10 Journal of Voice, Vol. &&, No. &&, 2021
Andrea Burk for the organization and invitation to the 24. D€ ollinger M, Gr€
ohn F, Berry D, et al. Preliminary results on the influ-
annual meeting. ence of engineered artificial mucus layer on phonation. J Speech Lang
Hear Res. 2014;57:S637–S647.
25. Maryn Y, Verguts M, Demarsin H, et al. Intersegmenter variability in
high-speed laryngoscopy-based glottal area waveform measures.
REFERENCES Laryngoscope. 2019;130:E654–E661.
1. Cummins F. Voice, (inter-)subjectivity, and real time recurrent interac- 26. Kist A., G omez P., Dubrovskiy D., et al. A deep learning enhanced
tion. Front Psychol. 2014;5:760. novel software tool for laryngeal dynamics analysis. J Speech Lang
2. Ruben RJ. Redefining the survival of the fittest: communication disor- Hear R. doi: https://10.1044/2021_jslhr-20-00498.
ders in the 21st century. Laryngoscope. 2000;110:241–245. 27. Karnell MP, Hall KD, Landahl KL. Comparison of fundamental fre-
3. Spina AL, Maunsell R, Sandalo K, et al. Correlation between quency and perturbation measurements among three analysis systems.
voice and life quality and occupation. Braz J Otorhinolaryngol. J Voice. 1995;9:383–393.
2009;75:275–279. 28. Bielamowicz S, Kreiman J, Gerratt BR, et al. Comparison of voice
4. Ullas G, McClelland L, Jones NS. Medically unexplained symptoms analysis systems for perturbation measurement. J Speech Hear Res.
and somatisation in ENT. J Laryngol Otol. 2013;127:452–457. 1996;39:126–134.
5. Roy N. Functional dysphonia. Curr Opin Otolaryngol Head Neck 29. Hillenbrand J, Houde RA. Acoustic correlates of breathy vocal qual-
Surg. 2003;11:144–148. ity: dysphonic voices and continuous speech. J Speech Hear Res.
6. Titze IR. Nonlinear source-filter coupling in phonation: Theory. J 1996;39:311–321.
Acoust Soc Am. 2008;123:2733–2749. 30. Schlegel P, Semmler M, Kunduk M, et al. Influence of analyzed
7. Van Den Berg J. Myoelastic-aerodynamic theory of voice production. sequence length on parameters in laryngeal high-speed videoendo-
J Speech Lang Hear Res. 1958;1:227–244. scopy. Appl Sci. 2018;8:2666.
8. Becker S, Kniesburges S, M€ uller S, et al. Flow-structure-acoustic inter- 31. Patel R, Dubrovskiy D, D€ollinger M. Characterizing vibratory kine-
action in a human voice model. J Acoust Soc Am. 2009;125:1351– matics in children and adults with high-speed digital imaging. J Speech
1361. Lang Hear Res. 2014;57:S674–S686.
9. Kniesburges S, Lodermeyer A, Becker S, et al. The mechanisms of sub- 32. Holmberg EB, Hillman RE, Perkell JS. Glottal airflow and
harmonic tone generation in a synthetic larynx model. J Acoust Soc transglottal air pressure measurements for male and female
Am. 2016;139:3182–3192. speakers in soft, normal, and loud voice. J Acoust Soc Am.
10. Bonilha HS, White L, Kuckhahn K, et al. Vocal fold mucus aggre- 1989;85:1787.
gation in persons with voice disorders. J Commun Disord. 33. Qiu Q, Schutte HK, Gu L, et al. An automatic method to quantify the
2012;45:304–311. vibration properties of human vocal folds via videokymography. Folia
11. Peters G, Wendler O, B€ ohringer SD, et al. Human laryngeal Phoniatr Logop. 2003;55:128–136.
mucus from the vocal folds: rheological characterization by parti- 34. Wang SG, Park HJ, Lee BJ, et al. A new videokymography system for
cle tracking microrheology and oscillatory shear rheology. Appl evaluation of the vibration pattern of entire vocal folds. Auris Nasus
Sci-Basel. 2021;11:3011. Larynx. 2016;43:315–321.
12. Bansil R, Turner B. The biology of mucus: Composition, synthesis and 35. Siegel MB, Potsic WP. Ectodermal dysplasia: the otolaryngologic
organization. Adv Drug Deliv Rev. 2018;124:3–15. manifestations and management. Int J Pediatr Otorhinolaryngol.
13. Loth M, Waibel M, Albrecht G. Christ-siemens-touraine-syndrom.. 1990;19:265–271.
Hautarzt. 1998;49:505–508. 36. Frank R, G€ utz U, Strenge S, et al. Hypohidrotische ektodermale dys-
14. Machtens E, Weyhrother HG, Brands T, et al. Klinische aspekte der plasie. Monatsschr Kinderheilkd. 1998;146:590–593.
ektodermalen dysplasie. Z Kinderheilk. 1972;112:265–280. 37. Gugatschka M, Rechenmacher J, Chibidziura J, et al. Vergleichbarkeit
15. Fete M, Hermann J, Behrens J, et al. X-linked hypohidrotic ectoder- und umrechnung von stimmst€ orungsindex (SSI) und voice handicap
mal dysplasia (XLHED): clinical and diagnostic insights from an inter- index (VHI). Laryngorhinootologie. 2007;86:785–788.
national patient registry. Am J Med Genet A. 2014;164A:2437–2442. 38. Friedrich G, Dejonckere PH. The voice evaluation protocol of the
16. Bergendal B, McAllister A, Stecksén-Blicks C. Orofacial dysfunction European Laryngological Society (ELS)−first results of a multicenter
in ectodermal dysplasias measured using the nordic orofacial test- study. Laryngorhinootologie. 2005;84:744–752.
screening protocol. Acta Odontol Scand. 2009;67:377–381. 39. Schlegel P, Kist AM, Semmler M, et al. Determination of
17. Peterson-Falzone SJ, Caldarelli DD, Landahl KL. Abnormal clinical parameters sensitive to functional voice disorders apply-
laryngeal vocal quality in ectodermal dysplasia. Arch Otolaryngol. ing boosted decision stumps. IEEE J Transl Eng Health Med.
1981;107:300–304. 2020;8:1–11.
18. Dejonckere PH, Bradley P, Clemente P, et al. A basic protocol for 40. Hillenbrand J, Houde RA. Acoustic correlates of breathy vocal qual-
functional assessment of voice pathology, especially for investigating ity: dysphonic voices and continuous speech. J Speech Hear Res.
the efficacy of (phonosurgical) treatments and evaluating new assess- 1996;39:311–321.
ment techniques. Guideline elaborated by the committee on phoniat- 41. Sch€ utzenberger A, Kunduk M, D€ ollinger M, et al. Laryngeal high-
rics of the european laryngological society (ELS),. Laryngology. speed videoendoscopy: sensitivity of objective parameters towards
2000;258:77–82. recording frame rate. Biomed Res Int. 2016;2016: 4575437.
19. Jacobson Barbara H., Johnson Alex, Grywalski Cynthia, et al. The 42. Schlegel P, Kunduk M, Stingl M, et al. Influence of spatial camera res-
voice handicap index (VHI). 6, 66−70 (1997). olution in high-speed videoendoscopy on laryngeal parameters. Plos
20. Heylen LG, Wuyts FL, Mertens FW, et al. Phonetography in voice One. 2019;14: e0215168.
diagnoses. Acta Otorhinolaryngol Belg. 1996;50:299–308. 43. Patel RR, Dixon A, Richmond AM, et al. Pediatric high speed digital
21. Sulter AM, Wit HP, Schutte HK, et al. A structured approach to voice imaging of vocal fold vibration: a normative pilot study of glottal clo-
range profile (Phonetogram) analysis. J Speech, Lang Hear Res. sure and phase closure characteristics. Int J Pediatr Otorhinolaryngol.
1994;37:1076–1085. 2012;76:954–959.
22. Mehta DD, Deliyski DD, Quatieri TF, et al. Automated measurement 44. S€odersten M, Hertegard S, Hammarberg B. Glottal closure, transglot-
of vocal fold vibratory asymmetry from highspeed videoendoscopy tal airflow, and voice quality in healthy middle-aged women. J Voice.
recordings. J Speech Lang Hear Res. 2011;54:47–54. 1995;9:182–197.
23. D€ollinger M, Dubrovskiy D, Patel R. Spatiotemporal analysis of 45. Rasp O, Lohscheller J, D€ ollinger M, et al. The pitch raise paradigm: a
vocal fold vibrations between children and adults. Laryngoscope. new task for real-time endoscopy of non-stationary phonation. Folia
2012;122:2511–2518. Phoniatr Logo. 2006;58:175–185.ARTICLE IN PRESS
Marion Semmler, et al Influence of Reduced Saliva Production 11
46. S€
odersten M, Lindestad PA. Glottal closure and perceived breathiness 52. Chen EY, Sun A, Chen CS, et al. Nicotine alters mucin rheologi-
during phonation in normally speaking subjects. J Speech Lang Hear cal properties. Am J Physiol Lung Cell Mol Physiol. 2014;307:
Res. 1990;33:601–611. L149–L157.
47. Ayache S, Ouaknine M, Dejonkere P, et al. Experimental study of the 53. Nishio T, Bando H, Bamba H, et al. Circadian gene expression in the
effects of surface mucus viscosity on the glottic cycle. J Voice. murine larynx. Auris Nasus Larynx. 2008;35:539–544.
2004;18:107–115. 54. Schneider S, Plank C, Eysholdt U, et al. Voice function and
48. Leydon C, Sivasankar M, Falciglia DL, et al. Vocal fold surface voice-related quality of life in the elderly. Gerontology. 2011;57:
hydration: a review. J Voice. 2009;23:658–665. 109–114.
49. Pierce JL, Tanner K, Merrill RM, et al. Voice disorders in Sj€
ogren's 55. Hogikyan ND, Sethuraman G. G. Validation of an instrument
syndrome: prevalence and related risk factors. Laryngoscope. to measure voice-related quality of life (V-RQOL). J Voice.
2015;125:1385–1392. 1999;13:557–569.
50. Chang CS, Liao CM, Muo CH, et al. Increased risk of concurrent 56. Ribas TM, Penteado RZ, Garcia-Zapata MTA. Quality of life related
gastroesophageal reflux disease among patients with Sj€ ogren's syn- with the voice of teachers: exploratory systematic review of literature-
drome: a nationwide population-based study. Eur J Intern Med. Quality of life related with the voice of teachers: exploratory systematic
2016;31:73–78. review of literature. Rev CEFAC. 2014;16:294–306.
51. Carroll TL. Reflux and the voice: getting smarter about lar-
yngopharyngeal reflux. Otolaryngol Clin North Am. 2019;52:
723–733.You can also read