The "Non-Musk Effect" at Twitter
←
→
Page content transcription
If your browser does not render page correctly, please read the page content below
The “Non-Musk Effect” at Twitter
                     Dmitry Zinoviev, Arkapravo Sarkar, Pelin Bicen
                            Suffolk University, Boston, MA, USA

                                               April 2023

                                                 Abstract
          Elon Musk has long been known to significantly impact Wall Street through his contro-
      versial statements and actions, particularly through his own use of social media. An innovator
      and visionary entrepreneur, Musk is often considered a poster boy for all entrepreneurs world-
      wide. It is, thus, interesting to examine the effect that Musk might have on Main Street, i.e.,
      on the social media activity of other entrepreneurs. In this research, we study and quantify this
      “Musk Effect,” i.e., the impact of Musk’s recent and highly publicized acquisition of Twitter
      on the tweeting activity of entrepreneurs. Using a dataset consisting of 9.94 million actual
      tweets from 47,190 self-declared entrepreneurs from seven English-speaking countries (US,
      Australia, New Zealand, UK, Canada, South Africa, and Ireland) spanning 71 weeks and en-
      compassing the entire period from the rumor that Musk may buy Twitter till the completion of
      the acquisition, we find that only about 2.5% of the entrepreneurs display a significant change
      in their tweeting behavior over the time.
          We believe that our study is one of the first works to examine the effect of Musk’s acquisi-
      tion of Twitter on the actual tweeting behavior of Twitter users (entrepreneurs). By quantifying
      the impact of the Musk Effect on Main Street, we provide a comparison with the effect Musk’s
      actions have on Wall Street. Finally, our systematic identification of the characteristics of
      entrepreneurs most affected by the Musk Effect has practical implications for academics and
      practitioners alike.

         Keywords: leadership; Elon Musk; twitter; complex network analysis; topic modeling

1    Introduction
Elon Musk, the CEO of Tesla and SpaceX, is known for his quirky personality and controversial
statements. His actions have often caused significant movements in the stock market, especially in
the tech industry. However, the impact of Musk’s behavior and actions on social media, specifically
on other entrepreneurs, has yet to be studied extensively. This research seeks to fill this gap by
examining the “Musk Effect” on the Twitter activity of self-declared entrepreneurs.
    The timeline surrounding Musk’s recent and highly publicized acquisition of Twitter is worth
noting. On November 29, 2021, Jack Dorsey stepped down as Twitter CEO. Shortly after, on
January 31, 2022, Musk began purchasing Twitter stock. On April 14, 2022, Musk made an

                                                     1
2 DATA ACQUISITION
unsolicited and nonbinding offer to purchase the company, which caused significant speculation
and buzz on social media platforms. However, on July 8, 2022, Musk announced his intention
to terminate the proposed acquisition, causing a stir in the financial markets. Finally, on October
27, 2022, Musk and Twitter closed the deal, bringing his vision of a decentralized social media
platform to life.
Against this backdrop, our study quantifies the “Musk Effect” on the tweeting activity of en-
trepreneurs from seven English-speaking countries (US, Australia, New Zealand, UK, Canada,
South Africa, and Ireland) for 71 weeks. For this study, we downloaded and created a dataset of
9.9 million tweets from more than 47,000 self-declared entrepreneurs. We performed a detailed
analysis of all the tweets, including the account details like username, account age, number of
lists, posts, followers, following, and any hashtags and mentions associated with every tweet. Us-
ing trajectory cluster analysis, we could classify the entrepreneurs into eight broad non-overlapping
groups (clusters). Using hashtag-based analysis, we extracted the popular conversation topics from
these entrepreneurs’ tweets. Further, with the entrepreneurs’ following information, i.e., based on
whom each of our entrepreneurs follows on Twitter, we could estimate and plot the political lean-
ing of these entrepreneurs. Finally, we used multivariate logistic regression to determine some
identifying characteristics that could be attributed to each of the entrepreneur clusters that emerged
from our analysis.
The rest of the paper is structured as follows. The second section details the steps in our data
acquisition methodology and our final sample selection criterion. The third section presents a
comprehensive data analysis, including a detailed description of the user classification methodol-
ogy and political leaning estimation. The fourth section discusses the regression analysis and the
related findings for each cluster of entrepreneurs, and the final section concludes the paper.
In the remainder of this paper, vertical dashed lines in the figures represent the following events:
• January 31, 2022: Elon Musk began purchasing Twitter stock (in some figures).
• April 14, 2022: Elon Musk made an offer to Twitter to purchase the company.
• July 8, 2022: Elon Musk announced his intention to terminate the acquisition.
• October 27, 2022: Elon Musk and Twitter closed the deal.
2 Data Acquisition
Our dataset comprises 9,943,721 tweets posted by 47,189 unique users for 71 weeks, commencing
October 1, 2022, and concluding on February 8, 2023. The users were randomly selected from the
live Twitter stream based on two criteria. Firstly, they must originate from an officially English-
speaking country (the USA, Great Britain, Canada, Ireland, New Zealand, or Australia) or South
Africa. Secondly, their Twitter profile descriptions must contain at least one of the following key-
words, either verbatim or as a hashtag: “entrepreneur,” “owner,” “founder,” “co-founder,” “busi-
ness owner,” “CEO,” “co-owner,” “representative,” “consultant,” “assistant,” “analyst,” “officer,”
“partner,” “developer,” “head,” “coordinator,” “specialist,” “executive,” “manager,” “managing di-
rector,” “chief executive,” “director,” and “VP” [8]. We collected each user’s identifier, name, and
username, along with basic public statistics such as account age and the number of lists, posts,
22 DATA ACQUISITION
Figure 1: Cumulative distribution of the dates of the first recorded tweet. See Section 1 for the
explanation of the vertical dashed lines. Notably, we possess complete timelines for the accounts
recorded on or after March 25, 2022, corresponding to 78% of the dataset, as indicated by the black
arrows.
followers, and following. Furthermore, we recorded whether their accounts had URLs and were
verified. For every tweet in the dataset, we have collected its unique identifier as well as the unique
identifier of its author. Furthermore, we have recorded the date of posting and the original text,
including all mentions (“@”) and hashtags (“#”).
In our study, we utilized a series of simple heuristics based on gendered names, usernames, pro-
nouns, family roles, and occupations to identify the users’ genders, where feasible. Subsequently,
we employed gendered accounts to train a logistic regression algorithm for predicting the gender
of remaining users. Our model exhibited a precision of 99.3%, thus rendering us confident in our
acceptance of the predicted genders [8].
Due to the limited availability of tweets (at most 3,000 most recent tweets per account, includ-
ing retweets), we could only obtain partial timelines for some highly active users, with most posts
made in the last weeks of the observation period. This disparity created a distorted perception of
increasing posting frequency over time. Since we aimed to employ weekly posting frequency to
gauge Twitter’s response to Musk’s acquisition, such bias was untenable.
To examine and mitigate this bias, we plotted the cumulative distribution of the dates of the first
recorded tweet (Figure 1). For instance, as illustrated by the black arrows in the figure, accounts
with complete and uninterrupted timelines originating on or before March 25, 2022, well before
any overt acquisition-related Musk activity, constituted 78% of all harvested accounts, as shown
by the black arrows in the figure. Consequently, if we sacrificed 22% of the dataset, we could
33 DATA ANALYSIS
assure timeline uniformity. We could expand the timeline at the expense of the number of users or
include more active users at the cost of a shorter timeline, as suggested by the chart. As previously
mentioned, we ultimately opted for a subset of 78% of users whose timelines began on or before
March 25, 2022. The chosen observation window encompassed the entire Twitter acquisition saga,
including its prelude.
The truncated dataset contains 4,034,007 (40.5%) tweets posted by 36,828 (78%) unique users
throughout 46 (65%) weeks. Of the users, 2,712 did not post anything during the measurement pe-
riod. As a result, the number of users subjected to further analysis is 34,116 (72%). To summarize
the composition of the dataset, Table 1 provides the number of unique users per country of tweet
origin.
3 Data Analysis
3.1 Analyzing Tweet and Hashtag Frequencies
Figure 2 presents the mean tweeting frequency, measured as the number of tweets per week per
person for each country of origin, and the mean tweeting frequency for the entire dataset. The
noticeable and consistent decline in tweeting frequency across all countries on the right side of
the chart is attributed to the Christmas/New Year holiday season, with the decline being less pro-
nounced in South Africa.
Additionally, the frequencies display an almost continuous decline between April and early
July, which will be explored further in Section 3.2 upon introducing Figure 4.
This study examines the user perception of Elon Musk’s online persona on Twitter. Users
have the option to refer to Mr. Musk through either the mention “@elonmusk” or the hashtag
“#elonmusk.” The latter option is considered indirect, as it does not immediately notify Mr. Musk
of the tweet’s contents; it is primarily intended to contribute to the trending activity on the site’s
homepage and attract the attention of other subscribers [3, 4].
On the other hand, a mention option is a direct form of communication that immediately alerts
Mr. Musk or his designated account handler of the mention. As such, it may be viewed as a more
personal approach to garner the direct recipient’s attention.
Figure 3 illustrates that the entrepreneurs exhibited a high frequency of mentions and hashtags
twice. The first instance occurred in late April to early May, shortly after Mr. Musk’s offer to pur-
chase Twitter. The second instance occurred from late October to early November, following the
finalization of the acquisition. Based on Figure 3, the initial surge in activity was brief, lasting only
one week, and featured both mentions and hashtags being used equally excessively. In contrast,
the second surge lasted approximately two months. It was primarily driven by direct mentions,
which could be because the news of the completed acquisition was more personally significant to
Table 1: Number of unique users per country in the truncated dataset
Country Count Country Count Country Count Country Count
AU 3,732 CA 5,453 IE 2,866 NZ 812
UK 4,561 US 13,918 ZA 5,486
43.2 Classifying the Users 3 DATA ANALYSIS
Country
AU
CA
3.0 IE
NZ
UK
# of tweets/week/person
US
2.5 ZA
2.0
1.5
Apr May Jun Jul Aug Sep Oct Nov Dec Jan Feb
2023
Figure 2: Tweeting frequency, per country, over time. The red line shows the mean tweeting
frequency.
the users we observed, leading to more direct and personal responses.
It should be noted that the legal dispute in July 2022, in which Elon Musk declared his intention
to terminate the acquisition, did not elicit a significant response in terms of the hashtag and mention
frequencies. Specifically, there was no observable change in the frequency of mentions, and the
increase in hashtag usage was minimal.
3.2 Classifying the Users
Our goal is to identify subgroups of users that exerted different reactions to the acquisition process.
We pursued the trajectory clustering approach proposed in [1] to achieve this. Although the ag-
gregate tweeting activity over the observation period was remarkably stable, both on average and
by country (excluding the dip during the holiday season and the gradual decline in the first half
of 2022), we believe that there might be hidden patterns in the tweeting behavior of subgroups of
users that are relevant to our investigation. Therefore, by applying trajectory clustering, we aim to
identify groups of users with similar tweeting patterns and analyze their reactions.
We computed a tweeting trajectory for each observed user by quantifying their tweeting fre-
53.2 Classifying the Users 3 DATA ANALYSIS
@elonmusk 160
#elonmusk
600 140
500 120
100
@elonmusk/week
#elonmusk/week
400
80
300 60
200 40
20
100
0
0
Apr May Jun Jul Aug Sep Oct Nov Dec Jan Feb
2023
Figure 3: Mentions of Elon Musk (@elonmusk) and the namesake hashtags (#elonmusk) over
time.
quencies at, a week and two weeks prior to, a week and two weeks after, and between the notable
events (depicted as the “dashed lines”)1 . Thus, each trajectory was represented as a 15-dimensional
vector of real numbers. The averaging of the intervals between the acquisition events aimed to
eliminate any sensitive response to unrelated episodes, such as national elections.
We further applied the k-means clustering algorithm [9] to divide the vectors into eight distinct
and non-overlapping groups—clusters. Each vector in a cluster is closer (based on the Euclidean
distance) to the vectors in the same cluster than those in any other cluster. The centroid, the
arithmetic mean of all vectors in a cluster, is representative of that cluster. We call all users whose
tweeting frequency trajectories belong to the same cluster, a group. Figure 4 shows the centroids
of the eight groups obtained through this process, arranged in descending order of group size.
We selected the number of groups to be eight to ensure that the centroids of each group were
not too similar and to separate users with abnormal behavior into distinct groups. Selecting any
other number of groups would have violated one of these requirements.
1 Specifically,
we used the following dates: 2022-03-31, 2022-04-07, 2022-04-14, 2022-04-21, 2022-04-28, 2022-
06-25, ’022-07-01, 2022-07-08, 2022-07-15, 2022-07-22, 2022-10-13, 2022-10-20, 2022-10-27, 2022-11-03, 2022-
11-10, and 2023-01-29.
63.2 Classifying the Users 3 DATA ANALYSIS
40 2
8
1
5
30 7
3
#tweets/week/person
4
6
20
10
0
2-03 2-05 2- 07 2- 09 2- 11 3- 01
202 202 202 202 202 202
Figure 4: Tweeting frequency per group over time. The groups are arranged in descending order
of size. The point values represent the mean tweeting frequencies during the previous observation
period.
Five of the eight groups consist of users with a stable tweeting history who were not signif-
icantly affected by the company acquisition events. The centroids of these groups differ only in
terms of activity levels but are otherwise close to straight horizontal lines in ascending order: 2,
8, 1, 5, and 3. Interestingly, there is an inverse correlation between group size and activity level,
suggesting that most Twitter users are passive observers or re-tweeters.
Groups 7 and 6, where the latter is the smallest, consisting only of 0.6% of the dataset, exhibited
reduced activity between the announcement of the intention to acquire Twitter and the attempted
withdrawal from the deal. These groups are primarily responsible for the linear decline observed
on the left side of Figure 2.
Lastly, the users in group number 4 demonstrate a significant increase in activity in anticipation
of and immediately after the closure of the acquisition deal, despite initially being aligned with (and
potentially members of) group number 5. This group, although the second smallest (1.9%), is the
most vocal responder to the corporate leadership change.
73.3 Extracting Hashtag-Based Conversation Topics 3 DATA ANALYSIS
#canada #music #ukraine
#realestate #photography #twitch
#marketing #jobs #leadership
#education #podcast #ai
0.12
0.10
Topic frequency
0.08
0.06
0.04
0.02
0.00
Apr May Jun Jul Aug Sep Oct Nov Dec Jan Feb
2023
Figure 5: Hashtag-based conversation topic frequencies over time.
3.3 Extracting Hashtag-Based Conversation Topics
Grouping the users into groups revealed a structural response of the entrepreneurs on Twitter to the
takeover. On the contrary, topic analysis via hashtags addresses their semantic response, if any.
We utilized complex network analysis on a network of hashtags to identify the topics being
discussed [13]. The network consisted of nodes representing the 3,000 most frequently used hash-
tags (#ai, #leadership, #business, #twitch, #bitcoin, #marketing, #crypto, #motivation, #realestate,
#technology, etc.)
An edge was created between two nodes if the corresponding hashtags were used in the same
tweet at least once, and the weight of the edge was proportional to the number of simultaneous
occurrences, normalized to the unit range. The resulting network had 2,428 distinct hashtags (in-
cluding #elonmusk) and 92,304 edges of various weights, and we removed edges between hashtags
that co-occurred only once or twice. The ten strongest edges in the network were (#ai, #machine-
learning), (#realestate, #realtor), (#inspiration, #motivation), (#fashion, #style), (#digitalmarket-
ing, #marketing), (#twitch, #twitchstreamer), (#ai, #technology), (#business, #marketing), (#bit-
coin, #crypto), and (#tech, #technology).
We employed the Louvain community detection method [2] to identify groups of tightly con-
83.4 Estimating Political Leaning 3 DATA ANALYSIS
nected network nodes representing hashtag-based conversation topics. This method produced sev-
eral dozen topics, from which we selected the twelve most productive topics for further analysis, as
shown in Figure 5. Each topic in the figure is labeled with its most frequently used hashtag, which
may not fully reflect its contents. Therefore, we provided additional cues in Table 2 by listing more
hashtags associated with each topic.
Table 2: The first six most frequent hashtags in the twelve most productive conversation topics.
Both topics and hashtags within topics are listed in decreasing order of frequency.
#ai #bitcoin; #crypto; #technology; #cybersecurity; #auspol
#leadership #business; #motivation; #love; #covid19; #mentalhealth
#twitch #tiktok; #gaming; #twitchstreamer; #gamedev; #youtube
#ukraine #investing; #southafrica; #gold; #energy; #inflation
#podcast #writingcommunity; #fifaworldcup; #peace; #books; #amwriting
#jobs #job; #career; #hiring; #recruitment; #hr
#photography #travel; #christmas; #nature; #runningwithtumisole; #ireland
#music #shopmycloset; #poshmark; #fashion; #eurovision; #loveisland
#education #edtech; #edchat; #cdnpoli; #inclusion; #diversity
#marketing #socialmedia; #digitalmarketing; #twitter; #contentmarketing; . . . #elonmusk
#realestate #realtor; #homesforsale; #property; #toronto; #florida
#canada #australia; #women; #london; #nyc; #newyork
Most topics depicted in Figure 5 exhibit notably stable dynamics except for three topics.
Specifically, the surge in the #podcast and #ai topics can be readily attributed to the FIFA World
Cup 2022 and the cryptocurrency exchange FTX implosion. Even though the underlying reason
for the growth of the #leadership topic remains uncertain, it cannot be linked to any Twitter ac-
quisition event. It implies that there was no observable conversation topic on the entrepreneurs’
Twitter accounts that reflected or was affected by the takeover.
3.4 Estimating Political Leaning
The research question remaining to be investigated concerns the potential influence of political
leaning on entrepreneurs’ reactions to the change of ownership. A subnetwork of the entrepreneurs
as Twitter followers was extracted to examine this. It is assumed that if a user follows another user,
they share some views with the followed user [4] and may lean politically in the corresponding
direction.
However, constructing a one-dimensional political spectrum scale compatible with the liberal-
conservative scale in the USA is a challenging task due to the international nature of the dataset.
Creating such a scale necessitates a profound and multifaceted understanding of local politics,
which the authors lack. Therefore, they have opted to use the existing North American liberal-
conservative scale as a universal yardstick, acknowledging the potential for accusations of Ameri-
centrism while fully recognizing that the scale may not fully capture local nuances.
For each user in the dataset, we collected a list of up to 1,000 users they follow. The number
was limited by the recent changes in Twitter’s API policies that severely restrict the followee lists’
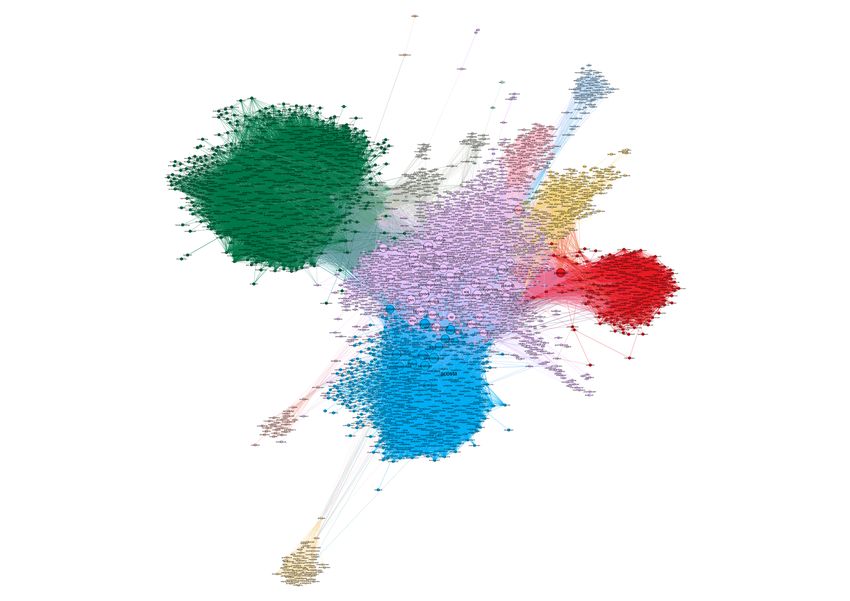
download speed. A bipartite, directed, unweighted network was constructed with entrepreneurs
93.4 Estimating Political Leaning 3 DATA ANALYSIS
as one set of nodes and their followees as the other set (referred to as “opinion leaders,” for lack
of a better term). If multiple entrepreneurs followed the same two opinion leaders, a new edge
was created connecting the leaders, thereby building a new projected network of co-followed [10]
(Figure 6).
Some opinion leaders in the projected network are co-followed by liberal and conservative
users because of their prominence. For example, a strong co-following edge was discovered be-
tween @joebiden and @realdonaldtrump, with the former signaling liberal-leaning and the latter
indicating conservative-leaning. Since connected leaders may appear on the same followees list,
they cancel out each other’s contribution by sending controversial signals. The closeness central-
ity of the leaders’ nodes can be used to estimate the propensity for true political signaling [7].
If a leader is close, in terms of the number of connecting edges, to the other leaders, they are at
the center of the political cloud and do not cause much leaning in either direction. Conversely, a
node with lower closeness centrality is away from the center and is politically biased. The leaders
with the highest closeness centrality2 , namely, @elonmusk, @joebiden, @barackobama, @po-
tus, @kamalaharris, @realdonaldtrump, @aoc, @vp, @billgates, @nytimes, @michelleobama,
2 Such that for the user i, the closeness centrality xi > µ (x) + 3σ (x).
Figure 6: The network of Twitter accounts based on co-following, with major network commu-
nities detected: “liberal” (blue), “neutral” (magenta), “conservative” (red), “techno” (yellow and
pink), and “South African” (green).
103.4 Estimating Political Leaning 3 DATA ANALYSIS
@trevornoah, @whitehouse, @cnn, and @nasa, and their incident network edges were eliminated.
The resulting network is sparser, has higher modularity, and has a crisper community structure [11].
Upon applying the Louvain community detection algorithm [2], we identified 14 groups of
2,491 opinion leaders, including highly politically polarized communities [5]. The findings are
summarized in Table 3.
Table 3: The top opinion leaders in each cluster. Both clusters and leaders within clusters are listed
in the decreasing order of the number of followers.
# Size Summary Top members
1 555,672 Neutral @spacex, @bbcbreaking, @gretathunberg, @vancityreynolds,
@twitter, @cnnbrk, @hillaryclinton, @bbcworld, @tesla
2 286,231 ZA @cyrilramaphosa, @iamsteveharvey, @julius s malema,
@news24, @enca, @realblackcoffee, @presidencyza
3 244,022 Liberal @zelenskyyua, @flotus, @drbiden, @sarahcpr,
@speakerpelosi, @theamandagorman, @projectlincoln
4 168,054 Entertainm’t @rihanna, @kingjames, @drake, @kevinhart4real, @espn,
@sportscenter, @kimkardashian, @snoopdogg, @iamcardib
5 168,054 Conservative @potus45, @joerogan, @jordanbpeterson, @flotus45,
@foxnews, @benshapiro, @cobratate, @donaldjtrumpjr
6 122,086 Tech/Crypto @jack, @garyvee, @coinbase, @vitalikbuterin, @chamath,
@cz binance, @lexfridman, @naval, @binance, @sahilbloom
7 79,380 Social media @mrbeast, @twitch, @playstation, @xbox, @pulte, @discord,
@steam, @nintendoamerica, @elgato, @rockstargames
8 48,193 Soccer @fabrizioromano, @cristiano, @premierleague, @f1,
@lewishamilton, @championsleague, @manutd
9 28,617 AU @albomp, @abcnews, @danielandrewsmp, @senatorwong,
@latingle, @normanswan, @mrkrudd, @turnbullmalcolm
10 22,332 IE @donie, @rtenews, @leovaradkar, @simonharristd,
@irishtimes, @drtonyholohan, @gavreilly, @dublinairport
11 15,196 Business @siriouslysusan, @cynthialive, @benlandis,
@murraynewlands, @shwood, @johnrampton, @digitaltrends
12 2,344 Tennis @rogerfederer, @djokernole, @wimbledon, @rafaelnadal
13 2,320 Education @edutopia, @googleforedu, @usedgov, @mindshiftkqed,
@educationweek
14 1,464 Military @usnavy, @usairforce, @usmc, @usarmy
Of particular interest are clusters #1 (the biggest and largely politically neutral, despite the
presence of notable political figures), #3 (the “liberal” cluster), and #5 (the “conservative” cluster).
As a result, we can calculate the number of opinion leaders on lists #3 and #5 that each entrepreneur
in the dataset follows and interpret the difference between the two as an indicator of their political
leaning.
Figure 7 displays a histogram of the political leaning for all included entrepreneurs, revealing a
symmetrical distribution with the mean and median leaning close to 0. The shape of the distribution
suggests that, within the context of the proposed political leaning estimation framework, Twitter
114 DISCUSSION
104
103
102
101
100
0.6 0.4 0.2 0.0 0.2 0.4 0.6 0.8
Leaning
Figure 7: Estimated political leaning of ∼45,500 users (“liberals” on the left, “conservatives” on
the right).
as a whole is politically neutral, at least within the sample of entrepreneurs.
4 Discussion
We employed a logistic regression model to identify the factors that explain the entrepreneurs’
association with the groups. Due to missing gender descriptions, only 32,654 users were included
in the regression analysis. The results of this analysis are presented in Tables 4 and 5.
The first insight from Table 4 is that except Group 2, all other groups have relatively newer
Twitter accounts, which shows that they have not been on Twitter that long. We remind the readers
that Group 2 is the biggest of all the groups and constitutes about 57.5% of all the entrepreneurs
in our study. With that in mind, it will be interesting to not only examine how some of the smaller
groups are similar to and different from this majority group in terms of their characteristics but
also observe what makes these smaller groups similar to and different from each other.
Interestingly, we find that Group 1 and Group 8 have similar traits on several dimensions:
• Entrepreneurs who belong to both of these groups are not from South Africa;
• They provide fairly long bio descriptions, including their personal website URL, that shows
that they want to be known and want people to land on their webpage for more information
about themselves and what they do;
124 DISCUSSION
Table 4: Group sizes and logistic regression coefficients
Groups: 2 8 1 5 7 3 4 6
(Size, %) 57.4 18.6 7.7 7.5 3.3 3.0 1.9 0.6
Male? -0.02 -0.01 0.07 -0.06 0.01 0.12+ 0.10 0.31+
Leaning 0.27 0.00 -0.45 0.07 -0.22 -0.21 0.76 -0.37
From CA? -0.11∗ 0.03 0.03 0.06 0.23+ 0.14 0.21 -0.26
From IE? 0.09+ 0.00 0.01 -0.18+ -0.30+ 0.10 -0.15 -0.46
From NZ? -0.10 0.14 -0.09 -0.26 0.20 0.37+ 0.38 -0.48
From UK? -0.08 0.10+ 0.07 -0.01 -0.35∗ 0.26∗ 0.20 -1.16∗∗
From US? -0.16∗∗∗ 0.03 -0.02 0.19∗ 0.25∗ 0.13 0.26+ -0.33
From ZA? 0.25∗∗∗ -0.21∗∗∗ -0.26∗∗ -0.16 -0.08 -0.19 0.14 0.09
Account age 0.09∗∗∗ -0.03∗∗∗ -0.04∗∗∗ -0.04∗∗∗ -0.10∗∗∗ -0.11∗∗∗ -0.1∗∗∗ -0.2∗∗∗
Descr. length -0.57∗∗∗ 0.31∗∗∗ 0.40∗∗∗ 0.33∗∗∗ 0.40∗∗ 0.63∗∗∗ 0.62∗∗ -0.20
Has URL? -0.47∗∗∗ 0.18∗∗∗ 0.30∗∗∗ 0.41∗∗∗ 0.37∗∗∗ 0.51∗∗∗ 0.30∗∗∗ 0.29+
log(#followers) -0.26∗∗∗ 0.20∗∗∗ 0.2∗∗∗ -0.09 0.08 0.23∗∗ 0.07 0.39∗∗
log(#following) 0.37∗∗∗ -0.09∗ -0.16∗∗ -0.31∗∗∗ -0.08 -0.41∗∗∗ -0.27∗∗ -0.50∗∗
log(#listed) -0.03 -0.05 0.05 0.06 -0.19∗∗ 0.14+ 0.06 0.04
log(#tweets) -1.25∗∗∗ 0.34∗∗∗ 0.55∗∗∗ 1.23∗∗∗ 1.18∗∗∗ 1.48∗∗∗ 1.28∗∗∗ 1.57∗∗∗
Verified? -0.26∗∗ -0.04 -0.01 0.15 0.24 -0.06 0.36+ -0.73
• They both have strong followers but entrepreneurs belonging to either of these groups do not
necessarily follow a high number of accounts themselves (as captured by the “Following”
count from their respective Twitter profiles); and,
• They both have a relatively high frequency of tweets.
Based on the above set of common characteristics, we believe that entrepreneurs belonging
to Groups 1 and 8 may best be considered opinion providers who use Twitter for the interest of
self/business promotion. In other words, these enterpreneurs’ Twitter presence seems to be largely
business-driven.
Entrepreneurs in Group 3 have many traits similar to those in Groups 1 and 8, except for where
they are from. They, too, have relatively newer Twitter accounts, long bio descriptions including
personal URLs, strong followers but not necessarily following many accounts themselves, and a
high frequency of tweets. What separates Group 3 from Groups 1 and 8 is that they are primarily
located in the UK and New Zealand. Also, this group has significantly more male entrepreneurs.
Next, looking at Group 6, we see that this group also has a strong male presence with a high
number of tweets with a short description and without URLs, and consists of a disproportion-
ately lower number of people from the UK. Its members have relatively newer account on Twitter
and strong followers but do not necessarily follow a high number of accounts themselves. These
features indicate that those entrepreneurs provide opinions to their followers but not necessar-
ily want to be known or interested in people knowing who they are or what they do. This trait
of entrepreneurs in Group 6 is similar to those in Groups 1, 3, and 8, who are more into being
known/promoting themselves and their businesses. What mainly separates these groups are mostly
where they are located. We call them the self-promoters.
134 DISCUSSION
Continuing to examine our regression results further, we see that Groups 4, 5, and 7 stand
out a different spectrum. While being similar to each other and some of the earlier groups in
terms of having relatively newer Twitter with long bio descriptions, including their personal URL
and high tweet frequency, enterpreneurs who are part of this group neither have many followers
and follow many other Twitter accounts themselves nor necessarily have many followers (i.e., the
estimated coefficients were statistically insignificant). We decided to label them as the wannabe
self-promoters—entrepreneurs who are on their path to becoming self-promoters one day, but do
not have the critical mass of followers qualifying them as self-promoters. Also, we notice that
entrepreneurs from Groups 4, 5, and 7 mostly seem to originate from the US.
Finally, let us examine Group 2—our most populous group of entrepreneurs. Besides accom-
modating an overwhelming majority of our entrepreneurs (57.5%) in our study, this group has a
set of starkly distinct features that collectively help entrepreneurs in this group stand out from all
the other groups.
For example, the entrepreneurs belonging to Group 2 have relatively older Twitter accounts, a
relatively shorter bio descriptions with no URL (indicating that these entrepreneurs are possibly
not keen on self/business promotional activities), and do not have a high number of followers.
However, they follow a relatively high number of accounts and have the distinctive trait of not
tweeting much! In other words, entrepreneurs in our most populous group are on Twitter mostly
to silently read and observe. This group also constists of a significantly large proportion of en-
trepreneurs who do not have a verified account, i.e., they do not have the blue check associated
with their Twitter accounts3 . That means these people are not interested in being publicly known
by promoting the authenticity of their Twitter accounts. We call them the silent observers.
Overall, entrepreneurs in Groups 1, 3, 6, and 8, whom we broadly label as the self-promoters,
are regularly on Twitter to be known and use the platform for self/business interests. Twitter is
mostly a marketing tool for them to connect with their target audience and find new audiences.
Collectively, they comprise about 29.9% of the sample we studied. We label the entrepreneurs
belonging to Groups 4, 5, and 7 as the wannabes and believe they have the same intention as the
self-promoters but are not quite there yet. They make up about 13.3% of the sample that we studied.
Interestingly, entrepreneurs belonging to only Group 4 seem to own a relatively higher proportion
of blue-check verified Twitter accounts. About 43.2% of the entrepreneurs we studied use the
Twitter platform for self-promotion or want to be linked/known for who they are and what they do,
while a larger number (57.5%) of entrepreneurs use Twitter just to read and observe silently.
Next, in Table 5, we report the summary statistics of our entrepreneurs by further grouping
them (i.e., forming groups of groups) based on the broad similarity of their tweeting trajectories
(see Figure 4).
Entrepreneurs in Group 4, the wannabe self-promoters, easily stand out and seem to have the
most distinct change in their tweet trajectoryin response to Elon Musk’s official acquisition of
Twitter (November 2022). We find that, just before the acquisition deal was closed, their tweet
frequency increased significantly, continued increasing for a little but post-acquisition, had a flat
trajectory for a very short while after closing, and then declined sharply thereafter. In sharp contrast
to the overall muted sentiments from entrepreneurs belonging to most other groups in response to
the official acquisition event, this group showed the most visible reaction to Musk’s acquisition of
Twitter.
3 The blue verified badge on Twitter lets people know that an account of public interest is authentic.
145 CONCLUSION
Table 5: Average statistics by groups with similar tweeting trajectories
Groups: A=1+2+3+5+8 B=6+7 C=4 Student’s t-test
Male? 0.66 0.65 0.66 ns
Leaning -0.001 -0.002 0.001 ns
Account age 9.04 9.27 9.51 A6=B∗∗∗ , A6=C∗∗∗
Descr. length 0.70 0.74 0.77 A6=B∗∗∗ , A6=C∗∗∗ , B6=C∗∗∗
Has URL? 0.55 0.64 0.75 A6=B∗∗∗ , A6=C∗∗∗ , B6=C∗∗∗
log(#followers) 2.61 2.83 3.09 A6=B∗∗∗ , A6=C∗∗∗ , B6=C∗∗∗
log(#following) 2.71 2.80 2.86 A6=B∗∗∗ , A6=C∗∗∗ , B6=C∗∗
log(#listed) 0.77 0.95 1.21 A6=B∗∗∗ , A6=C∗∗∗ , B6=C∗∗∗
log(#tweets) 3.28 3.54 3.86 A6=B∗∗∗ , A6=C∗∗∗ , B6=C∗∗∗
Verified? 0.02 0.03 0.05 A6=B∗∗∗ , A6=C∗∗∗ , B6=C∗∗
Knowing they are wannabes and want to self-promote and tweet with high frequency, their
strong reaction (positive or negative) makes sense. Groups 6 and 7 (also wannabes), both with a
desire to have strong followers, had high tweet frequency when Musk announced his intention to
buy Twitter (May 2022). However, their tweeting frequency declined sharply after that and went
almost flat when Musk announced his intention to withdraw from the deal (July 2022). Both had
a significantly noticeable instantaneous reaction to the final official acquisition, which eventually
became flat. For all the other remaining groups (1, 2, 3, 5 and 8), the tweeting trajectory is very
similar over our entire observation period. Though these groups vary significantly from each other
in terms of their frequencies of tweeting, their overall reaction to Musk buying Twitter is quite the
same—and can be considered very muted at best!
In our study, we observe and analyze the tweeting behavior of more than 32,000 entrepreneurs
who seem to sort them into eight distinct groups based on their motives, intentions, and usage of
the Twitter platform. Surprisingly, we do not find any significant difference between the groups
in terms of their political affiliation (left-wing or right-wing). When we look at their behavioral
tendencies, we see that some are closer to one another: Groups 1, 3, and 8 as the self-promoters;
Groups 4, 5, 6, and 7 as the wannabes; and Group 2 as silent observers. Irrespective of their
diverse intentions and motives to be on Twitter and their varying frequency of platform usage, they
all have similar reactions to Elon Musk’s acquisition of Twitter, i.e., no reaction—which we thus
call a “Non-Musk Effect.” We believe that the instantaneous reaction that we observe in only a
few of the groups (Groups 4, 6, and 7), also conform with the behavior pattern of the other groups,
as all of their tweeting trajectories went flat very soon. In the Twitterverse, entrepreneurs quickly
returned to their world or never left it in most cases, even as Musk’s antics vis-à-vis the Twitter
acquisition deal had caught the popular press and technology world in a frenzy!
5 Conclusion
After months of speculation and drama on buying or not buying Twitter, the widely popular social
media app was finally sold to Tesla CEO Elon Musk in a deal of $44 billion in November 2022.
While the purchase gave Musk control of another giant company, many people have had mixed
feelings about what that means for the future of Twitter. Media reaction was extensive during the
15REFERENCES
negotiation deals, during the purchase, and even after the purchase. Survey companies’ extensive
surveys also showed a split in thoughts on what this deal may mean. One survey of over 2,000
Americans by Preply.com found that 2 in 3 people did not want Musk to take control of Twit-
ter [12]. In another survey by platform OnePulse, 55.4% of 1,000 Americans believe Musk has his
interests in mind about buying Twitter [6].
Since taking over, the turmoil within Twitter has only got more escalated. Musk has cut Twit-
ter’s staff by more than two-thirds and engaged in an aggressive campaign of cost-cutting targeting
Twitter’s workplace and infrastructure, reorienting the company around what he regards as his star
team of engineers. Before taking over, Musk had heaped criticism on his predecessors’ approach to
content moderation, casting them as a pro-censorship regime stifling free speech. Meanwhile, his
team has rolled out a system of different-colored verification check marks to distinguish between
government, business, and other verified accounts.
With all that turmoil since October 2022, did the Twitter users care that much about Musk’s
take over as the mass media portrayed? This research seeks to fill this gap by examining the “Musk
Effect” on the Twitter activity of self-declared entrepreneurs. It quantifies the “Musk Effect” on
the tweeting activity of entrepreneurs from seven English-speaking countries (US, Australia, New
Zealand, UK, Canada, South Africa, and Ireland) for 71 weeks. We downloaded and created a
dataset of 9.9 million tweets from more than 47,000 self-declared entrepreneurs. We used trajec-
tory cluster analysis to classify the entrepreneurs who led to eight broad non-overlapping groups.
Hashtag-based analysis based on extracting popular conversation topics from these entrepreneurs’
tweets showed that there was no observable conversation topic on the entrepreneurs’ Twitter ac-
counts that reflected or was affected by Musk’s Twitter takeover. Most topics were trending during
the acquisition, such as AI, cryptocurrency exchange, FTX implosion, etc. We also showed that
political leaning does not significantly affect users’ attitudes toward the Twitter acquisition process.
Results further revealed that less than 4% of entrepreneurs react to Musk’s acquisition news,
which is signaled by these accounts’ tweet frequency. That means the media reaction to Twitter’s
acquisition by Musk was not necessarily aligned with main street’s reaction. People, in our case,
entrepreneurs, did not care that much about Musk’s ownership of Twitter. Most entrepreneurs,
around 57.5%, use the platform to read and observe. 12.6% of them are there to promote their
business or for self-promotion. Only less than 1% are on Twitter to influence without any personal
linkage.
All in all, if there was an effect of Musk’s acquisition of Twitter among entrepreneurs, it was a
non-Musk effect!
6 Acknowledgments
The authors are grateful to Bari Bendell for the participation in the dataset definition.
References
[1] A NDRIENKO , G., A NDRIENKO , N., R INZIVILLO , S., NANNI , M., P EDRESCHI , D., AND
G IANNOTTI , F. Interactive Visual Clustering of Large Collections of Trajectories. In Proc.
16REFERENCES REFERENCES
IEEE Symp. on Visual Analytics Science and Technology (Atlantic City, NJ USA, Oct. 2009),
IEEE, pp. 3–10.
[2] B LONDEL , V., G UILLAUME , J.-L., L AMBIOTTE , R., AND L EFEBVRE , E. Fast Unfolding
of Communities in Large Networks. J. of Statistical Mechanics: Theory and Experiment, 10
(2008), 1000.
[3] B RUNS , A., AND M OE , H. Structural layers of communication on Twitter. Twitter and
society [Digital Formations, Volume 89]: (2014), 15–28.
[4] B URGESS , J., AND BAYM , N. Twitter. A biography. New York University Press, 2020.
[5] C ONOVER , M., R ATKIEWICZ , J., F RANCISCO , M., G ONÇALVES , B., M ENCZER , F., AND
F LAMMINI , A. Political polarization on Twitter. In Proc. of the Int. AAAI Conf. on Web and
Social Media (2011), vol. 5, pp. 89–96.
[6] Elon Musk—Twitter takeover offer.
https://client.onepulse.com/share/pulse/qFfTZo92K2W2N2LhipBs?client=true, 2023. Ac-
cessed on: April 13, 2023.
[7] F REEMAN , L. Centrality in Social Networks: Conceptual Clarification. Social Networks 1
(1979), 215–239.
[8] H ANIK , K., B ENDELL , B., S ULLIVAN , D., AND Z INOVIEV, D. How gender shapes role-
based entrepreneurial self-presentation on Twitter. In preparation, 2023.
[9] J IN , X., AND H AN , J. K-Means Clustering. Springer US, Boston, MA, 2010, pp. 563–564.
[10] N EAL , Z. The backbone of bipartite projections: Inferring relationships from co-authorship,
co-sponsorship, co-attendance and other co-behaviors. Social Networks 39 (2014), 84–97.
[11] N EWMAN , M. Modularity and community structure in networks. Proceedings of the National
Academy of Sciences of the United States of America 103, 23 (2006), 8577–8696.
[12] Z AJECHOWSKI , M. Survey: Is free speech under attack? https://preply.com/en/blog/twitter-
free-speech-survey/, Apr. 2022. Accessed on: April 13, 2023.
[13] Z INOVIEV, D. Complex Network Analysis in Python. Pragmatic Bookshelf, 2018.
17You can also read