Annual Investor Presentation - February 9, 2023
←
→
Page content transcription
If your browser does not render page correctly, please read the page content below
Annual Investor Presentation
        February 9, 2023
Disclaimer
All information provided herein is for informational purposes only and should not be deemed as a recommendation to buy or sell any security mentioned. Pershing Square Capital
Management, L.P. (“Pershing Square”) believes this presentation contains a balanced presentation of the performance of the portfolio it manages, including a general summary of certain
portfolio holdings that have both over and under performed our expectations.

This presentation contains information and analyses relating to all of the publicly disclosed positions over 50 basis points in the portfolio of Pershing Square Holdings, Ltd. (“PSH” or the
“Company”) during 2022. Pershing Square may currently or in the future buy, sell, cover or otherwise change the form of its investments discussed in this presentation for any reason.
Pershing Square hereby disclaims any duty to provide any updates or changes to the information contained herein including, without limitation, the manner or type of any Pershing
Square investment.

Past performance is not necessarily indicative of future results. All investments involve risk including the loss of principal. It should not be assumed that any of the transactions or
investments discussed herein were or will prove to be profitable, or that the investment recommendations or decisions we make in the future will be profitable or will equal the investment
performance of the investments discussed herein. Specific companies or investments shown in this presentation are meant to demonstrate Pershing Square’s active investment style
and the types of industries and instruments in which we invest and are not selected based on past performance.

The analyses and conclusions of Pershing Square contained in this presentation are based on publicly available information. Pershing Square recognizes that there may be confidential
or otherwise non-public information in the possession of the companies discussed in the presentation and others that could lead these companies to disagree with Pershing Square’s
conclusions. The analyses provided include certain statements, assumptions, estimates and projections prepared with respect to, among other things, the historical and anticipated
operating performance of the companies. Such statements, assumptions, estimates, and projections reflect various assumptions by Pershing Square concerning anticipated results that
are inherently subject to significant economic, competitive, legal, regulatory, and other uncertainties and contingencies and have been included solely for illustrative purposes. No
representations, express or implied, are made as to the accuracy or completeness of such statements, assumptions, estimates or projections or with respect to any other materials
herein. Any forward-looking statement contained in this presentation is subject to various risks and uncertainties. See also “Forward-Looking Statements” in Additional Disclaimers and
Notes to Performance Results at the end of this presentation. All trademarks included in this presentation are the property of their respective owners. This document may not be
distributed without the express written consent of Pershing Square and does not constitute an offer to sell or the solicitation of an offer to purchase any security or investment product.
This presentation is expressly qualified in its entirety by reference to PSH’s prospectus which includes discussions of certain specific risk factors, tax considerations, fees and other
matters, and its other governing documents.

SEE ADDITIONAL DISCLAIMERS AND NOTES TO PERFORMANCE RESULTS AT THE END OF THIS PRESENTATION FOR ADDITIONAL IMPORTANT INFORMATION

                                                                                                                                                                                                2
Agenda

   Chairman’s Introduction

   2022 PSH Performance Review

   Business & Organizational Update

   Portfolio Update

   Q&A

Chairman’s Introduction
Board of Directors of PSH
All directors are independent of the Manager other than Nicholas Botta
Board Director                                 Summary Experience
                                               ‾   Director, Caledonia Investments plc and BlueRiver Acquisition Corp.
                 Anne Farlow
                                               ‾   Former Director, Investec Asset Management
                 Independent Director
                 Chairman of the Board         ‾   Former Partner, Providence Equity Partners, Electra Private Equity Partners, and JF Electra Ltd
                                               ‾   Morgan Stanley (New York), Bain and Company (London)

                                               ‾   Director, U.K. Office for Budget Responsibility, Chair, JP Morgan Asia Growth and Income plc, Director, TwentyFour
                 Bronwyn Curtis, OBE
                                                   Income Fund Ltd, Mercator Media, Scottish American Investment Co, and BH Macro Ltd
                 Senior Independent Director
                                               ‾   Former Governor, London School of Economics
                                               ‾   Former Head of Global Research, HSBC and Former Head of European Broadcast, Bloomberg LP
                                               ‾   Nomura International, Deutsche Bank
                                               ‾   President, the Investment Manager
                 Nicholas Botta
                                               ‾   Former CFO, the Investment Manager
                 Director
                                               ‾   Former CFO, Gotham Partners
                                               ‾   Former Senior Auditor, Deloitte & Touche
                                               ‾   Chairman of the Board, SW7 Holdings Ltd, St John Ambulance, and Butterfield Bank Jersey Ltd
                 Andrew Henton
                                               ‾   Director TaDaweb S.A., Longview Partners (Guernsey) Ltd, and Close Brothers Asset Management (Guernsey) Ltd
                 Independent Director
                                               ‾   Former Chairman of the Board, Boussard & Gavaudan Holding Ltd
                                               ‾   Former Director of St John Ambulance, Guernsey
                                               ‾   Co-Founder and Managing Partner, Helios Investment Partners
                 Tope Lawani
                                               ‾   Co-CEO and Director, Helios Fairfax Partners Corp (TSX:HFPC)
                 Independent Director
                                               ‾   Director, Helios Towers plc, NBA Africa, Thunes, and Starsight Energy
                                               ‾   Member, MIT Corporation (Massachusetts Institute of Technology’s board of trustees)
                                               ‾   Harvard Law School Dean’s Advisory Board
                                               ‾   Chairman of the Board, Bremont Watch Company
                 Rupert Morley
                                               ‾   Trustee and Chairman of investment advisory group, Comic Relief
                 Independent Director
                                               ‾   Former Chairman and CEO of Rococo Chocolates, Former CEO of Sterling Relocation and Propertyfinder.co.uk
                                               ‾   Former Director of Thistle Hotels, English Welsh & Scottish Railways, and Graham-Field Health Products

                                               ‾   Co-Founder and CEO, Social Finance, Inc.
                 Tracy Palandjian
                                               ‾   Vice Chair, U.S. Impact Investing and the Global Steering Group on Impact Investing
                 Independent Director
                                               ‾   Independent Director, Affiliated Managers Group (NYSE:AMG)
                                               ‾   Member, Harvard Corporation
                                               ‾   Former Managing Director, The Parthenon Group
                                                                                                                                                                        5
PSH Board Process
Quarterly meetings; additional meetings as needed
Review and monitor
Investment performance and portfolio
Operational risk management
Investor relations
Share price performance
Expenses
Regulatory matters
Board Committees (membership limited to independent directors
except for risk and nomination committees)
Audit Committee
Management Engagement Committee
Nomination Committee
Remuneration Committee
Risk Committee
Additional matters
6PSH Board Additional Matters Considered in 2022
2022 bond redemption and debt strategy
Strategies for addressing discount to NAV
Share buybacks
Dividend policy
ESG considerations
Pershing Square Tontine Holdings, Ltd. (NYSE:PSTH)
Netflix investment
Hedging strategy
7Overview of 2022 Performance
In 2022, PSH’s NAV declined (8.8%) and total shareholder return was (14.6%)
Annualized Returns
Market Indices HFRX Indices
PSH S&P FTSE MSCI Equity
Period NAV Share Price 500 100 (1) World Activist (2) Hedge (2)
2022 (8.8%) (14.6%) (18.1%) (6.5%) (17.7%) (2.2%) (3.2%)
3-Year 25.3% 23.5% 7.6% 0.0% 5.4% 11.4% 4.3%
5-Year 25.1% 21.9% 9.4% 1.0% 6.7% 8.2% 2.6%
10-Year 12.0% N/A(3) 12.5% 3.2% 9.4% 8.3% 3.3%
PSH’s discount to NAV widened by 4.9% from 28.3% in the beginning of 2022 to
33.2% as of December 31, 2022
Note: PSH share price performance reflects public shares traded on Euronext Amsterdam (PSH:NA) and includes dividend reinvestment. All index returns include dividend reinvestment. Past performance is not necessarily indicative of future
results. All investments involve the possibility of profit and the risk of loss, including the loss of principal. Please see the additional disclaimers and notes to performance results at the end of this presentation.
(1) FTSE 100 index reflects USD-denominated returns for consistency with PSH share price and other indices.
(2) HFRX Equity Hedge Index and HFRX Activist Index are constructed and maintained by Hedge Fund Research, Inc. HFRX Equity Hedge Index includes funds that maintain long and short positions in primarily equity and equity derivative
securities and employ a broad range of fundamental and quantitative techniques in their investment process. HFRX Activist Index includes funds with activist strategies and 50%+ of portfolio in activist situations.
(3) Public shares of PSH commenced trading on Euronext Amsterdam N.V. on October 13, 2014. The annualized return of PSH share price including dividend reinvestment between October 13, 2014 and December 31, 2022 was 4.8%. 82022 Corporate Actions: Bond Redemption
PSH redeemed the remaining $631 million balance of its 2022 bonds on
June 15, 2022
PSH Capital Structure - December 31, 2022
($ in mm) 12/31/2022
Total Capital $12,215
Coupon Maturity Issue Date
(1)
Weighted average
2027 Bonds (Public Offering) | €500mm EUR $535 1.375% Oct-2027 Oct-2021
cost of capital: 3.09%
2030 Bonds (Public Offering) 500 3.250% Nov-2030 Nov-2020
2031 Bonds (Public Offering) 700 3.250% Oct-2031 Oct-2021
Weighted average
2032 Bonds (Private Placement) 200 3.000% Jul-2032 Aug-2020
maturity: 9.1 years
2039 Bonds (Private Placement) 400 4.950% Jul-2039 Jul-2019
Total Debt $2,335
Total Indebtedness to Total Capital 19.1%
Net Asset Value (Total Capital less Total Debt) $9,880
PSH’s long-term debt management strategy is to manage leverage over time by increasing NAV
through strong performance and laddering its maturities through new issuances
Note: Total Capital and the ratio of Total Debt to Total Capital are calculated in accordance with the PSH Bonds’ Indentures. Total Capital is defined as Net Asset Value plus Total Debt and is net of accrued performance fee.
(1) Assumes a 1.07x EUR/USD exchange rate. 9Total Debt to Total Capital Ratio Over Time
Regardless of market or portfolio volatility, PSH has continuously
maintained conservative leverage levels and investment grade ratings
Total Debt to Total Capital Ratio | 6/30/2015 to 12/31/2022: 10/4/21: Redeemed
10/1/21: Issued $700mm of $369mm of 5.500%
3.250%, 10-Year Unsecured Unsecured Bonds
7/25/19: Private
6/26/15: Issued Bonds Due 2031 and €500mm Due 2022
24.0%
placement of
$1,000mm of 5.500%, of 1.375%, 6-Year
$400mm of 4.950%,
7-Year Unsecured EUR-Denominated Unsecured
20-Year Unsecured
Bonds Due 2022 Bonds Due 2027
22.0% Bonds Due 2039
20.0%
19.1%(1)
18.0%
6/15/22: Redeemed
$631mm balance of
16.0%
5.500% Unsecured
Bonds Due 2022
8/26/20: Private placement of 11/2/20: Issued $500mm of 3.250%,
14.0%
$200mm of 3.000%, 12-Year 10-Year Unsecured Bonds Due 2030
Unsecured Bonds Due 2032
12.0%
Jun-15 Dec-15 Jun-16 Dec-16 Jun-17 Dec-17 Jun-18 Dec-18 Jun-19 Dec-19 Jun-20 Dec-20 Jun-21 Dec-21 Jun-22 Dec-22
Total Debt as % of Total Capital
Note: Total Capital and the ratio of Total Debt to Total Capital are calculated in accordance with the PSH Bonds’ Indentures. Total Capital is defined as Net Asset Value plus Total Debt and is net of accrued performance fee.
(1) Assumes a 1.07x EUR/USD exchange rate for €500mm EUR-denominated bonds. 10Long-Term Debt Financing Strategy
Our ability to access low-cost, investment grade, long-term debt is an
important competitive advantage for PSH
PSH has attractive credit characteristics
Simple, transparent and highly liquid investment portfolio
Significant asset coverage: PSH debt is covered ~5.2x by total assets(1)
Underlying portfolio companies are diversified across industries and have relatively
low commodity exposure and cyclical risk
Proven investment strategy with a long-term track record
Facilitates opportunistic issuances
Laddered maturities from 2027 to 2039 are well matched with PSH’s
long-term investment horizon
No margin leverage
No mark-to-market covenants
(1) Total Assets is defined as Net Asset Value plus Total Debt as of 12/31/2022. 11Strategies to Address the Discount
Strong investment performance
Compound annual net returns above 25% for the last five years(1)
Global marketing efforts outside of the United States
Inclusion of PSH in the FTSE 100 index in December 2020
AIC reclassification from Hedge Funds to US Equity
Retained Frostrow for increased UK distribution
Corporate actions
Premium listing in London in May 2017 to broaden investor base and increase liquidity
Share buybacks from 2017 through 2022 repurchased 59.1 million shares for $1.1 billion at an
average discount to NAV of 28.1% and reduced shares outstanding by 25%(2)
Share purchases by PSCM affiliates; now own 26% of shares outstanding(3)
Initiated quarterly dividend of $0.10 per share in Q1 2019 and revised dividend policy in Q2 2022
whereby dividends will increase with NAV. Quarterly dividend for 2023 is $0.1307 per share
The board continues to believe that the most powerful driver of long-term
shareholder returns will be continued strong absolute and relative NAV performance
Past performance is not necessarily indicative of future results. All investments involve the possibility of profit and the risk of loss, including the loss of principal. Please see the additional disclaimers and notes to performance results at the end
of this presentation.
(1) The 1-year, 5-year, and 10-year compound annual net returns for PSH were (8.8%), 25.1%, and 12.0%, respectively. See slide 8 for further details.
(2) Reflects public shares outstanding as of April 30, 2017.
(3) Ownership percentage based on current shares outstanding. Includes Pershing Square employees and affiliates and charitable entities associated with Pershing Square employees or Pershing Square affiliates. 12PSH and ESG
PSH is an investment company without employees or physical operations
The PSH Board has delegated the responsibility for making individual investment
decisions to the Investment Manager and has encouraged the Investment
Manager to:
Consider ESG best practices within its own organization
Actively engage on these issues with its portfolio companies when appropriate
The Investment Manager’s ESG Statement, available on the Company’s website,
further describes its ESG practices
The Investment Manager has integrated ESG into its investment selection, risk
management, and stewardship processes
ESG considerations are embedded into its operations
13The Investment Manager and ESG
ESG risks are analyzed as part of the Investment Manager’s due diligence process
A business that has not addressed material ESG risks or that has unsustainable
business practices will not meet the Investment Manager’s investment criteria
unless its investment intent is to use its influence to address these issues
The following are among factors considered when ESG risk is analyzed:
Environmental management Business integrity and avoidance of corruption
Respect for human rights Compliance with applicable sanctions, antibribery, anti‐fraud,
anti‐tax evasion and anti-money-laundering laws and regulations
Safe and healthy working conditions
Fair treatment of employees
Strong corporate governance
Risk management culture
Collective bargaining issues
The Investment Manager believes that exceptional management teams:
Manage ESG risks responsibly
Integrate ESG into business practices
Operate sustainably
ESG risks may present opportunities to engage with boards and management to
improve practices that pose sustainability risks in order to facilitate long-term
value creation
This Presentation seeks to communicate the Investment Manager’s approach to ESG matters and should in no way be taken as implying that PSH or any Pershing Square fund seeks to promote environmental and/or social characteristics or
pursues any environmental and/or social objective within the meaning of Articles 8 and 9 of the SFDR. 142022 Performance Review
Substantial Outperformance vs. S&P 500 Benchmark

                                                                                                                                                                          1
                                    2022 Return: PSH Net of Fees vs. Indices Total Return

                                                                                                                                                                                   (2.2%)
                                                                                                                                                                                                                           (3.2%)

                                                                                                   (6.5%)

                   (8.8%)

                                                          (18.1%)                                                                         (17.7%)

                      PSH                                 S&P 500                                   FTSE                                   MSCI                                   HFRX                              HFRX Equity
                                                                                                    100(1)                                 World                                 Activist                              Hedge
                                                                                                                                                                                 Index(2)                             Index(2)

Reflects returns from 12/31/21 through 12/31/22, including dividend reinvestment for indices. Past performance is not necessarily indicative of future results. All investments involve the possibility of profit and the risk of loss, including the loss of
principal. Please see the additional disclaimers and notes to performance results at the end of this presentation.
(1) FTSE 100 index reflects USD-denominated returns for consistency with other indices.
(2) HFRX Equity Hedge Index and HFRX Activist Index are constructed and maintained by Hedge Fund Research, Inc. HFRX Equity Hedge Index includes funds that maintain long and short positions in primarily equity and equity derivative
securities and employ a broad range of fundamental and quantitative techniques in their investment process. HFRX Activist Index includes funds with activist strategies and 50%+ of portfolio in activist situations.                                           16
Pershing Square L.P. (“PSLP”) / PSH Annual Net Returns
Annual Net Returns
Year PSLP / PSH S&P 500
2004 42.6% 10.9%
2005 39.9% 4.9%
2006 22.5% 15.8%
2007 22.0% 5.5%
PSLP 2008 (13.0%) (37.0%)
2009 40.6% 26.5%
2010 29.7% 15.1%
2011 (1.1%) 2.1%
2012 13.3% 16.0%
2013 9.6% 32.4%
2014 40.4% 13.7%
2015 (20.5%) 1.4%
2016 (13.5%) 11.9%
2017 (4.0%) 21.8%
PSH
2018 (0.7%) (4.4%)
2019 58.1% 31.5%
2020 70.2% 18.4%
2021 26.9% 28.7%
2022 (8.8%) (18.1%)
Compound Annual Return
(1)
Since Firm Inception (1/1/2004) 15.9% 8.9%
Since PSH Inception (12/31/2012) 12.0% 12.5%
Past performance is not necessarily indicative of future results. All investments involve the possibility of profit and the risk of loss, including the loss of principal. Please see the additional disclaimers and notes to performance results at the end
of this presentation.
(1) PSLP/PSH data represents returns an investor would have earned by investing in PSLP at its January 1, 2004 inception and converting to PSH at its launch on December 31, 2012. 17PSLP / PSH Cumulative Net Returns
Net Returns vs. S&P 500
through December 31, 2022
PSH PSLP / PSH
1,552.2%
403.3%
206.9% 211.7% 226.1%
96.9% 56.8%
24.7%
(8.8%) (18.1%)
1-Year 3-Year 5-Year Since PSH Inception Since Firm Inception
(12/31/2012) (1/1/2004)
PSLP / PSH S&P 500
Note: PSLP/PSH data represents returns an investor would have earned by investing in PSLP at its January 1, 2004 inception and converting to PSH at its launch on December 31, 2012.
Past performance is not necessarily indicative of future results. All investments involve the possibility of profit and the risk of loss, including the loss of principal. Please see the additional disclaimers and notes to performance results at the end
of this presentation. 182022 Contributors
(1)
Contributors Gross Net
Interest Rate Swaptions 14.3% 14.2%
Restaurant Brands International 1.4% 1.3%
Accretion from Share Buybacks 1.2% 1.2%
Energy Hedge 0.5% 0.5%
Canadian Pacific 0.5% 0.4%
Total Contributors 17.9% 17.6%
Note: Positions with contributions to performance of 50 basis points or more are listed above separately, while positions with contributions to performance of less than 50 basis points are aggregated.
Past performance is not a guarantee of future results. All investments involve risk, including the loss of principal. Please see the additional disclaimers and notes to performance results at the end of this presentation.
(1) Net Contributors is provided solely to comply with Rule 206(4)-1 under the Investment Advisers Act of 1940 (“Advisers Act”) and related Frequently Asked Questions issued by the U.S. Securities and Exchange Commission (“SEC”). Net
Contributors reflects an adjustment to the gross return of each investment for such investment’s allocable portion of PSH’s quarterly management fee, based on PSH’s exposure to such investment. A performance fee was not charged by PSH
in 2022. Please see the additional disclaimers and notes to performance results at the end of this presentation. 192022 Detractors
Detractors Gross Net(1)
Lowe's (4.5%) (4.7%)
Netflix (3.9%) (3.9%)
Chipotle Mexican Grill (3.1%) (3.3%)
Domino's Pizza (2.8%) (2.9%)
Universal Music Group (2.5%) (2.8%)
Hilton Worldwide (2.3%) (2.5%)
Howard Hughes Corporation (2.0%) (2.1%)
Pershing Square Tontine Holdings (1.3%) (1.3%)
Currency Options (0.7%) (0.7%)
All Other Positions & Other Income / Expense (1.4%) (1.4%)
Total Detractors - Underlying Portfolio (24.5%) (25.6%)
Bond Interest Expense (0.8%) (0.8%)
Total Detractors - incl. Interest Expense (25.3%) (26.4%)
Note: Positions with contributions to performance of 50 basis points or more are listed above separately, while positions with contributions to performance of less than 50 basis points are aggregated.
Past performance is not a guarantee of future results. All investments involve risk, including the loss of principal. Please see the additional disclaimers and notes to performance results at the end of this presentation.
(1) Net Detractors is provided solely to comply with Rule 206(4)-1 under the Advisers Act of 1940 and related Frequently Asked Questions issued by the SEC. Net Detractors reflects an adjustment to the gross return of each investment for such
investment’s allocable portion of PSH’s quarterly management fee, based on PSH’s exposure to such investment. A performance fee was not charged by PSH in 2022. Please see the additional disclaimers and notes to performance results at
the end of this presentation. 20Pershing Square’s Strategy Has Proven to be
Defensive in Down Markets
PSLP / PSH Average Monthly Net Returns vs. S&P 500
through December 31, 2022
Average Monthly Average Return in Average Return in
Return Up Months Down Months
4.0%
3.0% 3.1%
3.0%
2.0% 1.4%
0.8%
1.0%
0.0%
(1.0%)
(2.0%)
(2.0%)
(3.0%)
(4.0%)
(3.9%)
PSLP / PSH S&P 500
Note: Data represents returns an investor would have earned by investing in PSLP at its January 1, 2004 inception and converting to PSH at its launch on December 31, 2012. Please see the individual performance results for PSH on the next page.
Past performance is not necessarily indicative of future results. All investments involve the possibility of profit and the risk of loss, including the loss of principal. Please see the additional disclaimers and notes to performance results at the end
of this presentation. 21PSH Average Monthly Net Return vs. S&P 500
PSH Average Monthly Net Returns vs. S&P 500
through December 31, 2022
Average Monthly Average Return in Average Return in
Return Up Months Down Months
4.0%
3.2%
2.9%
3.0%
2.0%
1.1% 1.1%
1.0%
0.0%
(1.0%)
(2.0%)
(3.0%)
(3.1%)
(4.0%)
(3.9%)
PSH S&P 500
Note: Data starting from PSH inception on December 31, 2012.
Past performance is not necessarily indicative of future results. All investments involve the possibility of profit and the risk of loss, including the loss of principal. Please see the additional disclaimers and notes to performance results at the end
of this presentation. 22Total Assets Under Management
AUM(1) Insider Capital (2)
As of 2/7/2023 ($ in millions) Total Equity Total % of Equity
Pershing Square Holdings ("PSH") $12,916 $10,580 $2,771 26%
Pershing Square, L.P. ("PSLP") 1,316 1,316 573 44%
Pershing Square International ("PSI") 551 551 199 36%
Total Core Funds $14,784 $12,448 $3,543 28%
PS VII Funds (UMG Co-Investment Vehicle) 1,299 1,299 318 24%
Total Firm $16,083 $13,746 $3,861 28%
Note: Total Firm numbers include PS VII Master, L.P. and PS VII A International, L.P. (together, the “PSVII Funds”), which operate as co-investment vehicles investing primarily in securities of (or otherwise seeking to be exposed to the
value of securities issued by) Universal Music Group N.V. without double counting PSH’s investment in PS VII Master, L.P. As of February 7, 2023, PSH’s investment in PS VII Master, L.P. totaled $257.9M. Assets under management are
gross of any accrued performance fees. Past performance is not necessarily indicative of future results. All investments involve the possibility of profit and the risk of loss, including the loss of principal. Please see the additional disclaimers
and notes to performance results at the end of this presentation.
(1) Total AUM includes $1.8 billion and €500 million (translated to USD at the prevailing exchange rate) of PSH bond proceeds. Equity AUM excludes these amounts.
(2) Includes Pershing Square employees and affiliates and charitable entities associated with Pershing Square employees or Pershing Square affiliates. 23Business and Organizational Update
2022 Key Developments
The funds meaningfully outperformed the S&P 500 in 2022 as our hedging
strategy protected the portfolio from the impact of rising interest rates
Monetized interest rate hedges initiated in late 2020 and early 2021
Initiated new hedges related to long-term interest rates, currencies and
energy
Making progress with regulatory agencies on Pershing Square SPARC
Holdings (“SPARC”) following PSTH’s return of capital to its shareholders
Bill joined the board of Universal Music Group, our largest investment
Sold Netflix and Domino’s Pizza, freeing up capital for new opportunities
25Pershing Square’s Core Hedging Principles
We seek to opportunistically invest in hedges to protect our portfolio
against specific macroeconomic risks and capitalize on market volatility
Asymmetric payoff structures
Limited upfront investment and carrying costs
Opportunities to generate large (>10x) multiples of capital
Limited downside in the event potential risk does not transpire
Monetization provides liquidity during periods of market dislocation
Hedges often become valuable when equity markets are cheap
Enables us to increase our exposure to high-quality businesses at deeply
discounted valuations
We believe our selective hedging strategy is a superior alternative to a large cash position or a
continuous hedging program, both of which can be a significant drag on long-term performance
The above is intended to be illustrative and there is no guarantee that Pershing Square will be able to identify the constituent investments or create a portfolio that reflects these characteristics. 26Overview of Interest Rate Hedge
Beginning in December 2020, we acquired out-of-the-money interest rate swaptions
to protect our portfolio against an unexpected rise in interest rates
Summary of Interest Rate Hedging Program
$ in mm Premium Proceeds / Multiple of Capital
Tenor / Instrument Paid Market Value (1) Gross Net (2)
2YR Swaptions | Acquired 2021 $112 $1,266 11.3x 10.1x
2YR Swaptions | Acquired 2022 196 1,282 6.5x 6.5x
10YR Swaptions $76 $180 2.4x 2.2x
Total Monetized Interest Rate Hedge $384 $2,728 7.1x 6.7x
Retained Interest Rate Hedges 328 367 1.1x 1.1x
Total Interest Rate Hedge $712 $3,095 4.3x 4.1x
Across the Pershing Square funds, the interest rate hedging program generated approximately
$2.7 billion in total proceeds in 2022
Note: The “Multiple of Capital” information is provided for illustrative purposes only and is not an indication of past or future returns of the Pershing Square funds.
(1) Represents proceeds realized upon sale for monetized hedges and market value as of February 7, 2023 for retained hedges.
(2) Net Multiple of Capital is provided solely to comply with Rule 206(4)-1 under the Advisers Act and related Frequently Asked Questions issued by the SEC and reflects an adjustment for the respective Pershing Square funds’
(a) quarterly management fee, (b) expenses (calculated using the expense ratio for the applicable time period), and (c) performance fee (if any) charged during relevant time period. 27Track Record of Defensive Hedging
Pershing Square’s hedging strategy has generated substantial gains
across multiple volatile market environments since the firm’s inception
Hedging Investment / Total Multiple of Capital
Risk Factor Time Period Instrument Carrying Costs Proceeds Gross Net (4)
CDS on Bond
Subprime Insurers
2005 - 2009 $64 million $1.1 billion 17.5x 13.8x
Mortgage Crisis (1)
(Primarily MBIA)
Index CDS on
COVID-19 2020 Investment Grade & $27 million $2.6 billion 93.4x 77.8x
(2)
High Yield Bonds
Out-of-the-money
Rise in Interest Late 2020 -
Interest Rate $384 million $2.7 billion 7.1x 6.7x
Rates 2022 (3)
Swaptions
Note: The “Multiple of Capital” information is provided for illustrative purposes only and is not an indication of past or future returns of the Pershing Square funds. The information on this page includes the investments of the Pershing Square
funds in existence during the relevant time period. PSH’s inception was after the Subprime Mortgage Crisis. Past performance is not necessarily indicative of future results. All investments involve the possibility of profit and the risk of loss,
including the loss of principal. Please see the additional disclaimers and notes to performance results at the end of this presentation.
(1) Other bond insurers included Assured Guaranty, Ambac, PMI Group, Financial Securities Assurance, XL Capital Assurance, and Radian Group.
(2) Refers specifically to the CDS index hedges initiated in late February / early March. Subsequent to the February / March hedging program, Pershing Square maintained smaller positions in CDS index hedges throughout various periods in
2020 and 2021.
(3) Reflects monetized interest rate hedges and excludes the value of retained swaptions.
(4) Net Multiple of Capital is provided solely to comply with Rule 206(4)-1 under the Advisers Act and related Frequently Asked Questions issued by the SEC and reflects an adjustment for the respective Pershing Square funds’ (a) quarterly
management fee, (b) expenses (calculated using the expense ratio for the applicable time period), and (c) performance fee (if any) charged during relevant time period. 28Strong Performance During the Global Financial Crisis
During the Global Financial Crisis, from December 2007 to June 2009(1),
PSLP outperformed the S&P 500 by 3,200 basis points
PSLP Indexed Net Return vs S&P 500 | 11/30/2007 to 6/30/2009:
20% March 2009 peak losses:
S&P 500: 52.9%
10%
PSLP: 18.2%
0%
11/30/07 1/31/08 3/31/08 5/31/08 7/31/08 9/30/08 11/30/08 1/31/09 3/31/09 5/31/09 (3.4)%
(10%)
Returns %
(20%)
(30%)
(35.4)%
(40%)
(50%)
(60%)
PSLP Net Return S&P 500
PSLP’s Indexed Net Return during the Global Financial Crisis is shown for illustrative purposes. PSH’s inception was after the Global Financial Crisis. Past performance is not necessarily indicative of future results. All investments involve the
possibility of profit and the risk of loss, including the loss of principal. Please see the additional disclaimers and notes to performance results at the end of this presentation.
(1) Duration of the Global Financial Crisis as defined by the U.S. National Bureau of Economic Research. 29Strong Performance During the COVID Crisis
PSH delivered strong 2020 performance with a net return of 70.2%,
outperforming the S&P 500 by 5,180 basis points
PSH Indexed Net Return vs S&P 500 | 12/31/2019 to 12/31/2020:
80%
March 2020 peak losses: 70.2%
70%
S&P 500: 30.4%
60% PSH: 11.2%
50%
40%
Returns %
30%
20% 18.4%
10%
0%
12/31 1/31 2/29 3/31 4/30 5/31 6/30 7/31 8/31 9/30 10/31 11/30 12/31
(10%)
(20%)
(30%)
PSH Net Return S&P 500
Past performance is not necessarily indicative of future results. All investments involve the possibility of profit and the risk of loss, including the loss of principal. Please see the additional disclaimers and notes to performance results at the end
of this presentation. 30Strong Outperformance in 2022
PSH outperformed the S&P 500 by 930 basis points in 2022, a year marked
by heightened geopolitical uncertainty and record inflation
PSH Indexed Net Return vs S&P 500 | 12/31/2021 to 12/31/2022:
5%
0%
12/31 1/31 2/28 3/31 4/30 5/31 6/30 7/31 8/31 9/30 10/31 11/30 12/31
(5%)
(8.8%)
Returns %
(10%)
(15%)
(18.1%)
(20%)
(25%)
(30%)
PSH Net Return S&P 500
During the three bear markets since the firm’s inception, Pershing Square substantially
outperformed the S&P 500 due to hedging-related gains and opportunistic investments in
high-quality, durable growth companies
Past performance is not necessarily indicative of future results. All investments involve the possibility of profit and the risk of loss, including the loss of principal. Please see the additional disclaimers and notes to performance results at the end
of this presentation. 31Pershing Square Tontine Holdings (“PSTH”)
and Pershing Square SPARC Holdings (“SPARC”)
PSTH returned $4 billion of capital to shareholders as we were unable to
consummate a transaction that both met our criteria and was executable
On July 26, 2022, each shareholder received $20.06 of cash per share
Favorable outcome compared with other SPACs that completed transactions
The De-SPAC Index(1) declined 76% in value over the public life of PSTH
We continue to improve upon SPARC and make progress with regulatory
agencies
Scaled down the minimum size to $1.5 billion to broaden the universe of targets
Special purpose acquisition rights (“SPARs”) will not be transferable or quoted until a
deal is announced and the post-effective amendment is distributed to SPAR holders
On February 2, 2023, we filed our fifth amendment to the registration statement
with the SEC
If SPARC’s registration statement becomes effective, we expect to expeditiously
distribute SPARs to former PSTH shareholders and warrant holders and begin the
search for a transaction
Note: SPARC remains subject to SEC review and will take place if and only once the registration statement has been declared effective by the SEC under the Securities Act of 1933. No assurance can be given that SPARC will be
ultimately effectuated on the above outlined terms or at all. This slide is informational and does not constitute an offer of any securities; please see additional disclaimers related to SPARC at the end of the presentation.
(1) De-SPAC Index data per Bloomberg. 32Pershing Square SPARC Holdings (“SPARC”)
SPARC solves the problems of conventional SPACs and improves upon
PSTH’s structure
No initial blank check IPO; no cash is held in trust until deal closure
SPARs are distributed for no consideration to former PSTH shareholders and warrantholders and are initially
not tradable
Investors opt-in to the initial business combination (“IBC”)
Reduced opportunity cost with no investor funding until a target is identified and a registration statement
becomes effective that describes in full the proposed business combination
SPARs will not be transferable or quoted until the post-effective amendment is distributed to SPAR holders
Flexible exercise price
Amount of capital raised can be precisely tailored to capital requirements of merger partner
No “shot clock”
Up to 10 years to complete a transaction vs. 2 years for a typical SPAC
Minimal frictional costs
No underwriting fees or public shareholder warrants
Increased deal certainty
Minimum committed sponsor investment of $250mm to $1bn in common stock, with flexibility to increase up
to $3.5bn
No conventional sponsor incentive
Pure common stock capital structure other than out-of-the-money warrants on up to 5.17% of shares
outstanding held by Pershing Square funds and SPARC directors
Note: SPARC remains subject to SEC review and will take place if and only once the registration statement has been declared effective by the SEC under the Securities Act of 1933. No assurance can be given that SPARC will be
ultimately effectuated on the above outlined terms or at all. This slide is informational and does not constitute an offer of any securities; please see additional disclaimers related to SPARC at the end of the presentation. 33Organizational Update
Lean, collaborative, and investment-centric organization continues to
perform at the highest levels
Ryan Israel promoted to Chief Investment Officer in August 2022
14 years with Pershing Square since joining from Goldman Sachs in March 2009
Bill will continue as CEO and Portfolio Manager with ultimate control over decision making
Open, collaborative office space enabled full return to office in November 2021
Moved to our new headquarters at 787 11th Avenue in May 2019
Design and layout of new space have proven to be valuable in a post-COVID world
Small organization size and long tenure of team are key differentiators
Concentrated and long-term investment strategy coupled with investment-centric business model
enables lean operating model
Stable, high-performance team with extensive experience
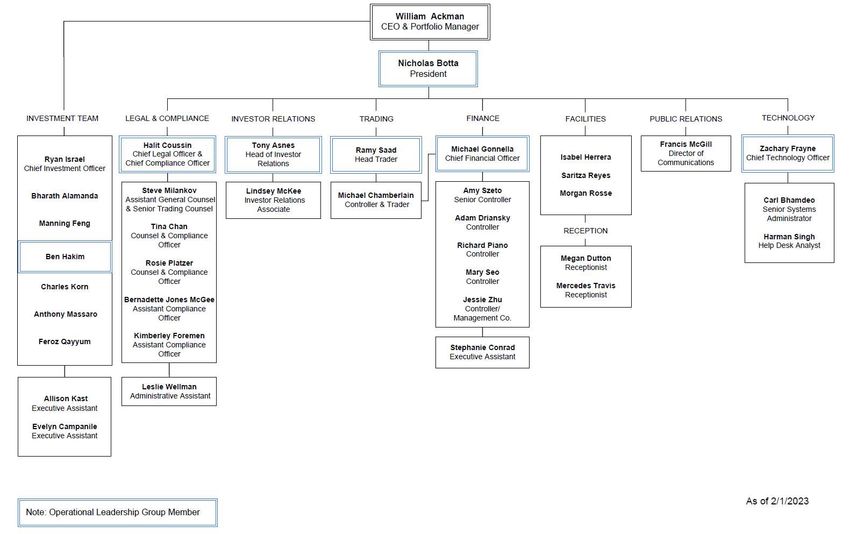
34PSCM Organization Chart
Operational Leadership Group Member New Employee
35Pershing Square Investment Team
Career PSCM
Employee Education and Summary Prior Experience Experience Tenure
(Years) (Years)
Gotham Partners, Co-Founder and Portfolio Manager (1992 - 2003)
Bill Ackman
M.B.A., Harvard Business School, 1992 31 19
CEO / Portfolio Manager
A.B., Harvard College, magna cum laude, 1988
Ryan Israel Goldman Sachs, Analyst (2007 - 2009)
16 14
Chief Investment Officer B.S.E., The Wharton School, summa cum laude, beta gamma sigma, 2007
The Blackstone Group, Senior Managing Director (1999 - 2012)
Ben Hakim 25 11
B.S., Cornell University, 1997
Apollo Global Management, Private Equity Associate (2011 - 2013)
Anthony Massaro Goldman Sachs, Analyst (2009 - 2011) 14 10
B.S.E., The Wharton School, summa cum laude, beta gamma sigma, 2009
KKR, Private Equity Associate (2012 - 2014)
Charles Korn Goldman Sachs, Analyst (2010 - 2012) 13 9
B.A., The University of Western Ontario, Richard Ivey School of Business, Ivey Scholar, 2010
KKR, Private Equity Associate (2015 - 2017)
Bharath Alamanda Goldman Sachs, Analyst (2013 - 2015) 10 6
B.S.E, Princeton University, summa cum laude, phi beta kappa, 2013
Hellman & Friedman, Private Equity Associate (2015 - 2017)
Feroz Qayyum Evercore, Analyst (2013 - 2015) 10 6
B.A., The University of Western Ontario, Richard Ivey School of Business, Ivey Scholar, 2013
Warburg Pincus, Private Equity Associate (2019 - 2021)
Manning Feng Centerview Partners, Analyst (2016 - 2019) 7 2
B.S.E., The Wharton School, summa cum laude, 2016
36Portfolio Update
Universal Music Group (“UMG”)
UMG is a high-quality, capital-light, rapidly growing royalty on
greater music consumption
Decades-long runway for growth
Massive addressable market, strong customer value proposition, and dominant
market position
Continued global consumer adoption of streaming creates long runway of
predictable, recurring revenue growth that is well-insulated from macroeconomic
pressures
Music is very under-monetized today and at the cusp of higher monetization
Digital Streaming Providers recently began raising prices for the first time
Recent and future renewals with emerging platforms provide an opportunity for
increased monetization and new form factors
UMG is outperforming its Capital Markets Day outlook
Revenue growth averaging 15% is meaningfully ahead of targets
EBITDA margins are poised for expansion in 2023 as business mix normalizes
Bill joined the board in May 2022
Source: Company filings. This slide contains Pershing Square’s own views and opinions, based on publicly available information, to illustrate Pershing Square’s thinking on the matters therein. 38UMG Share Price Performance Since IPO
UMG’s share price including dividend reinvestment decreased 7% in 2022 and
has increased 3% year-to-date in 2023(1)
UMG Share Price Performance from 9/21/2021 to 2/7/2023 (€EUR):
9/21/21: UMG completes
€ 30 separation from Vivendi and 7/1/22: CRB affirms decision
begins trading on the to increase mechanical
Euronext Amsterdam royalties for streaming from
10/24/22: Apple Music increases its 1/19/23: Amazon
10.5% to 15.1%
€ 27 individual plan pricing by 10% and follows Apple and also
student plan pricing by 20%. announces a 10 to 20%
YouTube increases its premium price increase
family plan’s pricing by 28%
Share price
€ 24
€23.10
€ 21
€ 18
€18.27*
€ 15
Sep-2021 Dec-2021 Apr-2022 Jul-2022 Oct-2022 Jan-2023
Note: The performance of UMG’s share price is provided for illustrative purposes only and is not an indication of past or future returns of the Pershing Square funds. The graph above shows only UMG’s share price over time, not the value of
PSH’s investment in UMG, and is provided as context for Pershing Square’s views of UMG. For a variety of potential reasons, such as timing of purchases and sales, use of derivative instruments, and others, PSH’s return on its investment may
differ substantially from UMG’s change in share price. If PSH’s management fees, performance fees and fund expenses (calculated using PSH’s expense ratio for each year except that for years prior to PSH’s inception, the expense ratio for
PSLP was used) were applied to the ownership of a single share of UMG purchased at market price, including dividends without reinvestment, and held over the time period shown above, the imputed net return on that share would be (9%).
* Average cost as per negotiated transaction price between Pershing Square and Vivendi. Includes transaction fees. Based on negotiated FX rate of 1.20 EUR to 1.00 USD. Please see the additional disclaimers and notes to performance results
at the end of the presentation.
(1) As of 2/7/2023.
39Lowe’s (“LOW”)
Lowe’s is a high-quality business with significant long-term earnings
growth potential
Divergent macroeconomic picture creating investor uncertainty
Rising interest rates pressuring buyer affordability and home sales velocity
Stable home improvement category supported by an aging housing stock, lack of new
inventory, continued work-from-home, robust home equity (vs. pre-COVID levels), and
continued strong Pro (professional contractor) project backlog
LOW positioned to grow EPS despite uncertain market conditions
Two-thirds of revenue is critical repair and maintenance activity
Idiosyncratic revenue opportunities driving share gains with the Pro
Self-help initiatives catalyzing operating margin expansion
Best-in-class capital return provides support for earnings growth in the near-term
Business transformation to drive significant long-term earnings upside
Lowe’s is committed to achieving its structural margin potential of 15%
Line-of-sight to ~$20 of EPS over the medium term, ~50% above current levels
Lowe’s currently trades at a P/E multiple of 15x, which is cheap on an absolute basis and a 23%
discount to Home Depot despite our views for materially higher prospective EPS growth
Source: Company filings. This slide contains Pershing Square’s own views and opinions, based on publicly available information, to illustrate Pershing Square’s thinking on the matters therein. 40LOW Share Price Performance Since Inception
LOW’s share price including dividend reinvestment decreased 21% in 2022
and has increased 8% year-to-date in 2023(1)
LOW Share Price Performance From 4/6/2018 to 2/7/2023:
12/7/22: LOW 2022 Analyst Day.
$270 Demonstrates substantial
operational progress across
many fronts. Introduces
$240
structural margin target of 15%
12/9/20: LOW 2020 Analyst Day. $215
$210 Medium-term operating margin
target set at 13%
Share price
$180
12/12/18: LOW 2018 Analyst
Day. Introduces 12%
5/22/18: Lowe’s operating margin target
$150 hires Marvin Ellison
9/15/22: US 30-Year 11/3/22: LOW announces
as CEO
mortgage rates divesture of Canadian
$120 surpass 6% on the business to improve focus
back of tightening US and simplicity; reveals core
interest rate policy US margins are ~13.6%
$90
$86*
$60
Apr-2018 Dec-2018 Aug-2019 Apr-2020 Dec-2020 Sep-2021 May-2022 Jan-2023
Note: The performance of LOW’s share price is provided for illustrative purposes only and is not an indication of past or future returns of the Pershing Square funds. The graph above shows only LOW’s share price over time, not the value of
PSH’s investment in LOW, and is provided as context for Pershing Square’s views of LOW. For a variety of potential reasons, such as timing of purchases and sales, use of derivative instruments, and others, PSH’s return on its investment may
differ substantially from LOW’s change in share price. If PSH’s management fees, performance fees and fund expenses (calculated using PSH’s expense ratio for each year except that for years prior to PSH’s inception, the expense ratio for
PSLP was used) were applied to the ownership of a single share of LOW purchased at market price, including dividends without reinvestment, and held over the time period shown above, the imputed net return on that share would be 101%.
*Average cost at announcement date. Please see the additional disclaimers and notes to performance results at the end of the presentation.
(1) As of 2/7/2023.
41Chipotle Mexican Grill (“CMG”)
Chipotle’s impressive growth continued in 2022 driven by the recovery of
in-store ordering and price increases to offset cost inflation
Industry-leading same-store sales growth and profitability
Same-store sales (“SSS”) grew 8% in 2022, or 31% from 2019 levels
While 2022 growth was driven by pricing, traffic is still up materially vs. 2019
Innovation success continued with pollo asado and garlic guajillo steak
Attractive unit economic model firmly intact despite inflationary environment
Chipotle was one of the few businesses to expand margins in 2022, with restaurant
margins up 130bps to 23.9%
Pricing power remains intact with chicken entrée still priced below $9 on average
Chipotle has a long runway for robust growth
Near-term opportunity to improve throughput to drive SSS and profitability
New unit growth of 8% to 10% annually in North America
Long-term potential for international store growth and daypart expansion
such as breakfast
Source: Company filings. This slide contains Pershing Square’s own views and opinions, based on publicly available information, to illustrate Pershing Square’s thinking on the matters therein. 42CMG Share Price Performance Since Inception
CMG’s share price decreased 21% in 2022 and has increased 24% year-to-
date in 2023(1)
CMG Share Price Performance From 8/4/2016 to 2/7/2023:
11/16/22: CMG opens 500th
restaurant with a Chipotlane
$2,000 7/20/21: Average digital drive-thru
restaurant sales eclipse
$1,800 2015 peak of $2.5mm
9/6/16: Pershing Square $1,723
during Q2
files 13D after market
$1,600
close with a 9.9% stake
$1,400
12/16/16: CMG
announces four new
Share price
$1,200 11/29/17: CMG
directors added to its announces search for
$1,000 board, including Ali new CEO; founder
Namvar and Matthew Steve Ells to become
$800 Paull from Pershing Executive Chairman
Square
$600
$400 $405*
$200 2/13/18: CMG names
Brian Niccol as CEO
$0
Aug-2016 Jul-2017 Jun-2018 May-2019 Apr-2020 Mar-2021 Feb-2022 Jan-2023
Note: The performance of CMG’s share price is provided for illustrative purposes only and is not an indication of past or future returns of the Pershing Square funds. The graph above shows only CMG’s share price over time, not the value of
PSH’s investment in CMG, and is provided as context for Pershing Square’s views of CMG. For a variety of potential reasons, such as timing of purchases and sales, use of derivative instruments, and others, PSH’s return on its investment
may differ substantially from CMG’s change in share price. If PSH’s management fees, performance fees and fund expenses (calculated using PSH’s expense ratio for each year except that for years prior to PSH’s inception, the expense ratio
for PSLP was used) were applied to the ownership of a single share of CMG purchased at market price and held over the time period shown above, the imputed net return on that share would be 198%.
*Average cost at announcement date. Please see the additional disclaimers and notes to performance results at the end of the presentation.
(1) As of 2/7/2023.
43Restaurant Brands International (“QSR”)
QSR is a high-quality business with significant long-term growth
potential trading at a highly discounted valuation
Comparable sales trends continue to improve
Tim Hortons Canada same-store sales improved to mid-single-digits above pre-COVID
levels during Q3 despite Canada’s reopening significantly trailing the U.S.
Burger King U.S. launched $400 million program to “reclaim the flame” and is poised
for a strong recovery in 2023
Burger King International, Popeyes, and Firehouse continue to generate strong
same-store sales growth relative to pre-COVID levels
Patrick Doyle, who previously led Domino’s turnaround, named Executive Chairman
Under Mr. Doyle’s eight-year tenure as CEO of Domino’s Pizza, the company’s share
price appreciated by 21x
Mr. Doyle has purchased $30 million of QSR shares in the open market and the
entirety of his compensation is tied to QSR’s share price
Remains cheap relative to intrinsic value and peers
Trades at less than 20x our estimate of 2023 free cash flow per share excluding
one-time investments at Burger King U.S.
Current valuation represents a discount of 24% to peers, which have lower long-term
growth potential
Source: Company filings, PSCM estimates, Wall Street research. This slide contains Pershing Square’s own views and opinions, based on publicly available information, to illustrate Pershing Square’s thinking on the matters therein. 44QSR Share Price Performance Since Inception
QSR’s share price including dividend reinvestment increased 11% in 2022
and has increased 5% year-to-date in 2023(1)
QSR Share Price Performance From 6/19/2012 to 2/7/2023:
11/15/21: QSR announces
$80 1/23/19: QSR announces leadership acquisition of Firehouse
transition, elevating Daniel Schwartz to Subs
Executive Chairman and Jose Cil to CEO
$70
$68
2/1/17: QSR announces
$60 acquisition of Popeyes
Share price
$50 8/24/14: QSR
announces
acquisition of Tim
$40 Hortons
11/16/22: QSR appoints
$30 Patrick Doyle as
Executive Chairman
$20
$16*
$10
Jun-2012 Dec-2013 Jun-2015 Dec-2016 Jun-2018 Dec-2019 Jul-2021 Jan-2023
Note: The performance of QSR’s share price is provided for illustrative purposes only and is not an indication of past or future returns of the Pershing Square funds. The graph above shows only QSR’s share price over time, not the value of
PSH’s investment in QSR, and is provided as context for Pershing Square’s views of QSR. For a variety of potential reasons, such as timing of purchases and sales, use of derivative instruments, and others, PSH’s return on its investment may
differ substantially from QSR’s change in share price. If PSH’s management fees, performance fees and fund expenses (calculated using PSH’s expense ratio for each year except that for years prior to PSH’s inception, the expense ratio for
PSLP was used) were applied to the ownership of a single share of QSR purchased at market price, including dividends without reinvestment, and held over the time period shown above, the imputed net return on that share would be 232%.
*Average cost at announcement date. Please see the additional disclaimers and notes to performance results at the end of the presentation.
(1) As of 2/7/2023.
45Hilton Worldwide (“HLT”)
Hilton is a high-quality business with a long runway of strong earnings
growth and an exceptional management team
Industry conditions continue to be supportive
Average daily revenue per room (“RevPAR”) now above pre-COVID levels despite
occupancy still below pre-COVID levels, as business transient and group are
still recovering
Average daily rate has stabilized 10% to 15% above pre-COVID levels (3-4% annual growth)
Industry data indicates continued strong desire for consumers to travel
Near-term RevPAR growth supported by easy first-half 2022 comparable period
HLT is well positioned for attractive long-term performance
Best-in-class value proposition drives market share increases over time
Net unit growth poised to re-accelerate back to historical 6% to 7% growth, aided by
new organic brand development (e.g., Spark by Hilton)
Non-RevPAR fee earnings (e.g., HGV, AMEX) are an attractive growth tailwind
Higher long-term structural margins and cash flow following productivity actions
Substantial capital return over time
Hilton is trading at an inexpensive multiple in light of its long-term earnings growth prospects
Source: Company filings. This slide contains Pershing Square’s own views and opinions, based on publicly available information, to illustrate Pershing Square’s thinking on the matters therein. 46HLT Share Price Performance Since Inception
HLT’s share price including dividend reinvestment decreased 19% in 2022
and has increased 17% year-to-date in 2023(1)
HLT Share Price Performance From 10/8/2018 to 2/7/2023: 10/26/22: HLT reports first
quarter with systemwide
$170 RevPAR above 2019, despite
occupancy still not having
7/29/21: HLT reports a step-function improvement
fully recovered
in profitability relative to prior recent trending;
$150 fully repays previously drawn credit line
$148
3/10/20: HLT withdraws
2020 outlook given macro
$130
uncertainty; draws down
$1.75bn credit line
Share price
$110
April 2022: Industrywide nightly
rates rise above pre-COVID levels in
$90 response to broad-based inflation
and pent-up demand for travel
$70
$73*
$50
Oct-2018 Mar-2019 Sep-2019 Mar-2020 Aug-2020 Feb-2021 Aug-2021 Jan-2022 Jul-2022 Jan-2023
Note: The performance of HLT’s share price is provided for illustrative purposes only and is not an indication of past or future returns of the Pershing Square funds. The graph above shows only HLT’s share price over time, not the value of
PSH’s investment in HLT, and is provided as context for Pershing Square’s views of HLT. For a variety of potential reasons, such as timing of purchases and sales, use of derivative instruments, and others, PSH’s return on its investment may
differ substantially from HLT’s change in share price. If PSH’s management fees, performance fees and fund expenses (calculated using PSH’s expense ratio for each year except that for years prior to PSH’s inception, the expense ratio for
PSLP was used) were applied to the ownership of a single share of HLT purchased at market price, including dividends without reinvestment, and held over the time period shown above, the imputed net return on that share would be 64%.
*Average cost at announcement date. Please see the additional disclaimers and notes to performance results at the end of the presentation.
(1) As of 2/7/2023.
47Howard Hughes Corporation (“HHC”)
HHC’s uniquely advantaged business model of owning master planned
communities (“MPCs”) drives resilient, long-term value creation
Robust performance amidst a challenging macroeconomic backdrop
Land sales supported by supply-demand imbalance and low housing inventory
Substantial NOI growth driven by increase in rental rates and a steady recovery in
leasing back to pre-pandemic levels
Pace of condo sales remains strong with recent launch of Ward Village’s tenth tower
Repurchased approximately 8% of its shares in 2022
Well insulated from the impact of rising interest rates
Approximately 86% of the company’s debt is either fixed or swapped to a fixed rate
and approximately 82% of debt is due in 2026 or later
Ability to self-fund future development mitigates reliance on external financing
Despite higher mortgage rates, HHC’s MPCs remain attractive
HHC’s MPCs are located in low cost-of-living, low-tax states like Texas & Nevada that are
experiencing substantial in-migration
Pershing Square purchased an additional 2.3 million shares of HHC in Q4 2022 at an average price
of $72 per share and now owns 32% of the company
Source: Company filings. This slide contains Pershing Square’s own views and opinions, based on publicly available information, to illustrate Pershing Square’s thinking on the matters therein. 48You can also read