Annual Climate Summary 2018 - Arctic Inventory and Monitoring Network Natural Resource Data Series NPS/ARCN/NRDS-2021/1318
←
→
Page content transcription
If your browser does not render page correctly, please read the page content below
National Park Service
U.S. Department of the Interior

Natural Resource Stewardship and Science

Annual Climate Summary 2018
Arctic Inventory and Monitoring Network
Natural Resource Data Series NPS/ARCN/NRDS—2021/1318
The production of this document cost $63,151, including costs associated with data collection, processing, analysis, and
subsequent authoring, editing, and publication.

ON THE COVER
Wildflowers in Kobuk Valley National Park
NPS Photo/Pam Sousanes
Annual Climate Summary 2018
Arctic Inventory and Monitoring Network
Natural Resource Data Series NPS/ARCN/NRDS—2021/1318

Pamela J. Sousanes and Ken Hill

National Park Service
Arctic Inventory and Monitoring Network
4175 Geist Rd.
Fairbanks, AK 99709

March 2021

U.S. Department of the Interior
National Park Service
Natural Resource Stewardship and Science
Fort Collins, Colorado
The National Park Service, Natural Resource Stewardship and Science office in Fort Collins,
Colorado, publishes a range of reports that address natural resource topics. These reports are of
interest and applicability to a broad audience in the National Park Service and others in natural
resource management, including scientists, conservation and environmental constituencies, and the
public.

The Natural Resource Data Series is intended for the timely release of basic data sets and data
summaries. Care has been taken to assure accuracy of raw data values, but a thorough analysis and
interpretation of the data has not been completed. Consequently, the initial analyses of data in this
report are provisional and subject to change.

All manuscripts in the series receive the appropriate level of peer review to ensure that the
information is scientifically credible, technically accurate, appropriately written for the intended
audience, and designed and published in a professional manner.

Data in this report were collected and analyzed using methods based on established, peer-reviewed
protocols and were analyzed and interpreted within the guidelines of the protocols.

Views, statements, findings, conclusions, recommendations, and data in this report do not necessarily
reflect views and policies of the National Park Service, U.S. Department of the Interior. Mention of
trade names or commercial products does not constitute endorsement or recommendation for use by
the U.S. Government.

This report is available in digital format from Arctic Inventory and Monitoring Network and the
Natural Resource Publications Management website. If you have difficulty accessing information in
this publication, particularly if using assistive technology, please email irma@nps.gov.

Please cite this publication as:

Sousanes, P. J., and K. Hill. 2021. Annual climate summary 2018: Arctic Inventory and Monitoring
Network. Natural Resource Data Series NPS/ARCN/NRDS—2021/1318. National Park Service, Fort
Collins, Colorado.

NPS 953/175157, March 2021
                                                    ii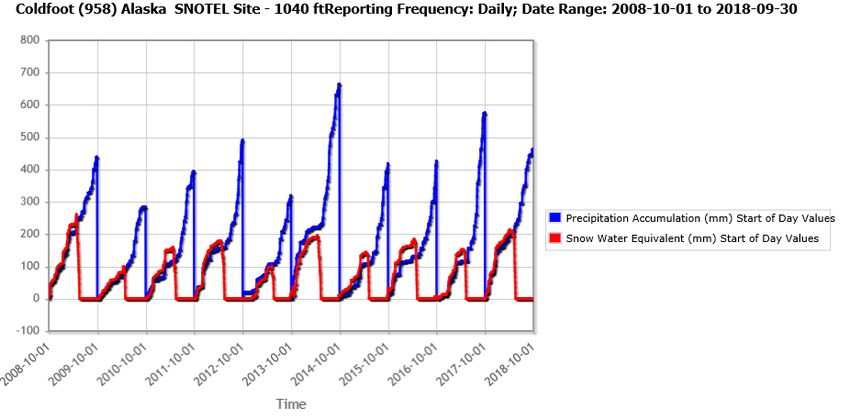
Contents
                                                                                                                                                      Page

Figures................................................................................................................................................... iv

Tables ..................................................................................................................................................... v

Abstract ................................................................................................................................................. vi

Introduction ............................................................................................................................................ 1

       Arctic Network Climate Overview ................................................................................................. 1

Methods.................................................................................................................................................. 2

       Data Corrections and Data Quality Grading................................................................................... 3

Results .................................................................................................................................................... 5

       Temperature.................................................................................................................................... 5

       Summer Precipitation ..................................................................................................................... 9

       Snow and Year-round Precipitation (2017–2018 Season) ........................................................... 10

            SNOTEL Sites ......................................................................................................................... 10

       2018 Weather at Bettles, Kotzebue, Nome (index sites) .............................................................. 13

            Temperature – Index Sites ....................................................................................................... 13

            Precipitation – Index Sites ....................................................................................................... 16

            Snow – Index Sites .................................................................................................................. 17

Discussion ............................................................................................................................................ 18

Literature Cited .................................................................................................................................... 19

                                                                             iii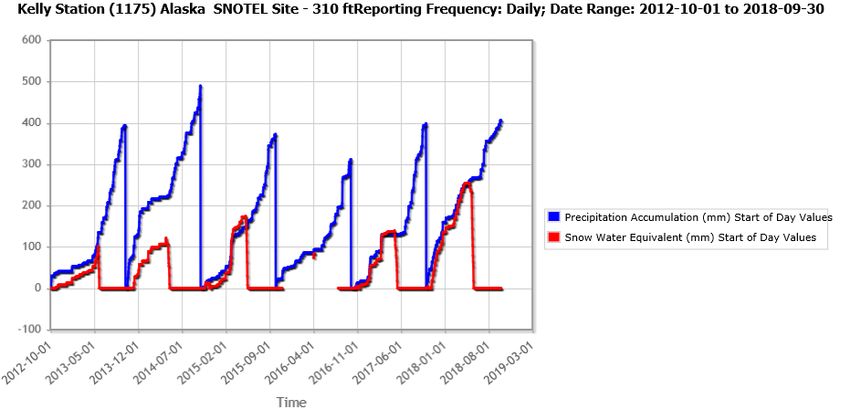
Figures
Page
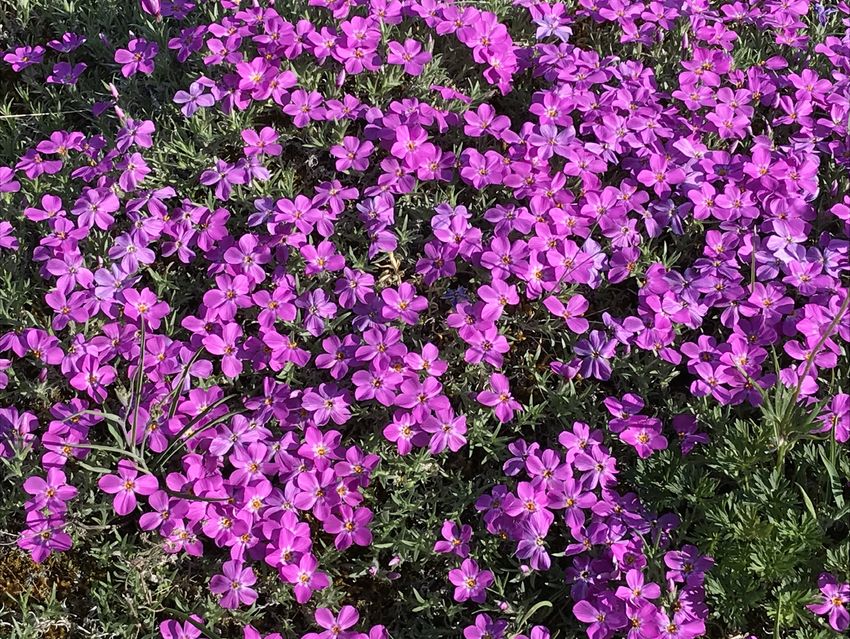
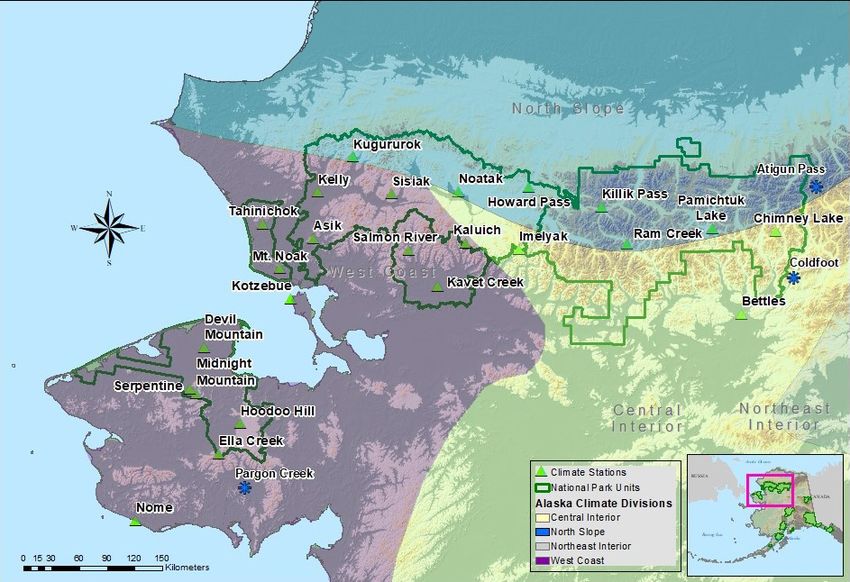
Figure 1. Map of climate stations in ARCN region, including three Snotel sites (blue
stars). ...................................................................................................................................................... 2
Figure 2. ARCN 2018 mean annual air temperatures, color coded by park. ........................................ 7
Figure 3. Average fall temperatures at Serpentine (SRTA2) in BELA (top), Sisiak
(SSIA2) in NOAT (middle), and Chimney Lake (CHMA2) in GAAR. ................................................ 8
Figure 4. ARCN 2018 summer precipitation. ..................................................................................... 10
Figure 5. Cumulative precipitation and SWE at Coldfoot over the past decade by water
year ending with the 2018 water year. ................................................................................................. 11
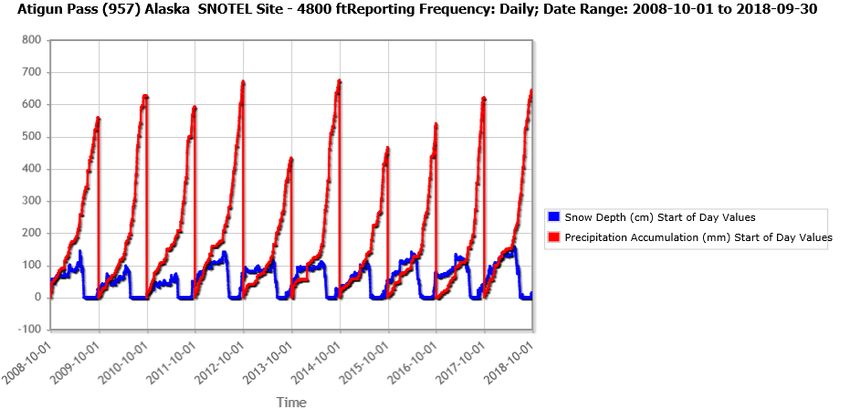
Figure 6. Cumulative precipitation and snow depth at Atigun Pass over the past decade
by water year ending with the 2018 water year. .................................................................................. 12
Figure 7. Cumulative precipitation and SWE for the past seven years at Kelly Station in
NOAT ending with water year 2018. ................................................................................................... 12
Figure 8. Cumulative precipitation for water year 2018 (October 1, 2017–September 30,
2018) at Pargon Creek. ........................................................................................................................ 13
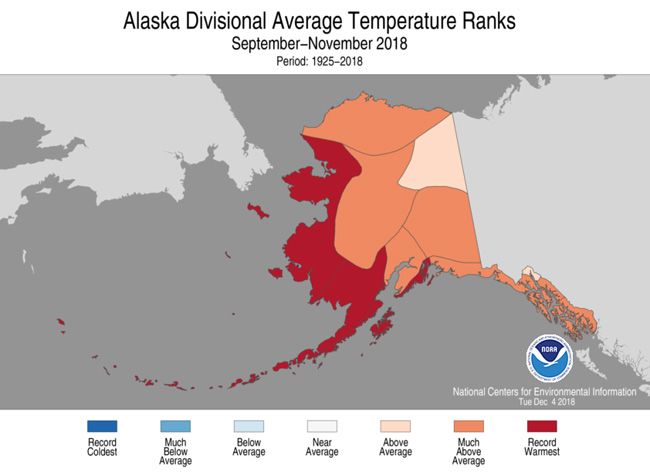
Figure 9. Record warm fall along Alaska’s west coast for 2018. ....................................................... 15
iv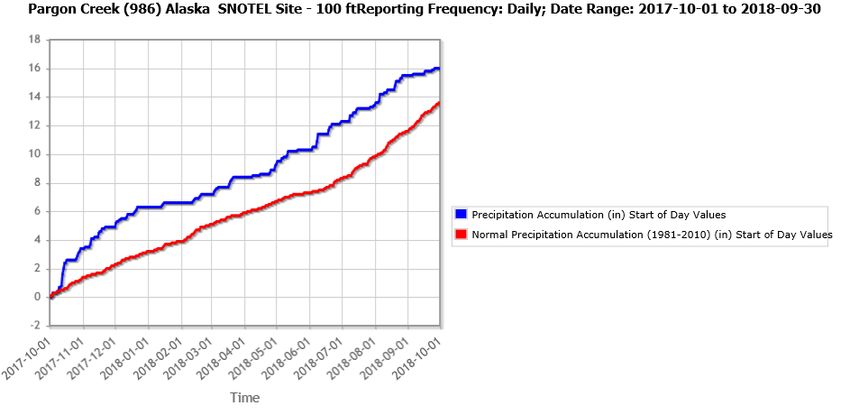
Tables
                                                                                                                                                     Page

Table 1. Climate stations included in this report. .................................................................................. 3

Table 2. Monthly and annual mean temperatures (°C) from ARCN and Fire RAWS 2018. ................ 6

Table 3. Rainfall (mm) from select ARCN, Fire RAWS, and SNOTEL stations in 2018. ................... 9

Table 4. Precipitation and snow summary statistics for SNOTEL stations in water year
2018...................................................................................................................................................... 11

Table 5. 2018 monthly mean temperatures and departures from 1981–2010 normal
(parentheses) for index sites in ARCN (°C). ....................................................................................... 14

Table 6. Monthly and annual precipitation (mm) and departures from normal (%) for
2018...................................................................................................................................................... 16

Table 7. Monthly and annual snowfall (cm) and departures from normal (cm) July 2017–
June 2018. ............................................................................................................................................ 17

                                                                             v
Abstract
The Arctic Network (ARCN) climate monitoring program has seventeen remote weather stations to
monitor climate in Gates of the Arctic National Park and Preserve (GAAR), Noatak National
Preserve (NOAT), Kobuk Valley National Park (KOVA), Cape Krusenstern National Monument
(CAKR), and Bering Land Bridge National Preserve (BELA). The main goal of the program is to
operate these remote sites for the long term in order to help scientists and park managers understand
the climate patterns across these large parks. This report summarizes the annual and monthly
temperature and precipitation deviations at long-term sites near the parks and at the ARCN weather
stations in the parks. The data are downloaded from each park station annually (during summer) and
processed in the fall; this report summarizes the last full year of data, which is 2018.
2018 was much warmer than normal statewide and the fifth year in a row where the average
temperature was among the top ten warmest years on record since 1925. The mean annual
temperatures at the ARCN climate stations were also warm in 2018 even when compared against a
relatively short measurement record (2012–2018). Annual temperatures ranged from −6.4 °C at
Killik Pass in GAAR to −1.1 °C at the Serpentine site in BELA. The sites near the coast were
warmer overall in 2018 than the interior sites, a result of warmer than normal ocean temperatures and
record low sea ice extent in the Bering Sea. Across the network, the fall of 2018 was the warmest to
date. Fall and early winter brought significant snow to the interior region near GAAR, while the
coast experienced heavy snowfall in March. Overall, the snowfall throughout the ARCN region was
above normal for the 2017–2018 season. Summer rainfall was greatest at the higher elevation interior
sites in the ARCN network; August was the wettest month of summer 2018 across the network.
Between May and September of 2018, the Arctic Network staff performed annual site maintenance at
the seventeen ARCN climate stations, four fire remoted automated weather stations (RAWS), and the
Snotel site at Kelly Ranger Station in Noatak National Preserve. All of the 2018 ARCN RAWS
weather data and corresponding metadata are available through the Integrated Resource Management
Applications (IRMA) Data Store at https://irma.nps.gov/DataStore/Reference/Profile/2254699.
viIntroduction
The Arctic Network Inventory and Monitoring program was established to monitor key ecosystem
components of BELA, CAKR, KOVA, GAAR, and NOAT and to provide that information back to
park managers for use in the stewardship of park resources. Climate is the most important broad-
scale factor influencing ecosystems and therefore the natural resources of parks. Covering more than
19 million acres, the ARCN parks represent a large portion of the mountainous environment of the
northern region of the state of Alaska and therefore provide an opportunity to understand climate
gradients that have traditionally been a challenge to instrument and monitor. Because global climate
models indicate that climate change and variability will be greatest at high latitudes, climate
monitoring is critical to understanding the changing conditions of park ecosystems.
The 2018 field season marked the seventh year of operational climate monitoring in ARCN parks.
Annual maintenance at the climate sites included sensor replacement, troubleshooting, upgrades, data
downloads, and sensor calibrations. Station maintenance logs were used to keep track of the climate
station equipment inventory and a maintenance report was completed after the field season to
document the details of the site visits—these reports include the field notes, photos, logistics, and
sensor metadata (Hill and Sousanes 2020 in review).
This annual data report summarizes the annual and monthly weather statistics of the most recent year
for the Arctic Network climate monitoring program.
Arctic Network Climate Overview
The climate characteristics of the ARCN are influenced primarily by latitude, elevation, and the
proximity to the coast. The high latitude drives the seasonal fluctuation of available solar radiation
with limited incoming solar warmth in the winter and an abundance of available light in the summer.
Temperature inversions are common through much of the year as a result of low water vapor content,
extended periods of snow cover, and low solar radiation. Major topographical influences include the
Brooks Range arcing through CAKR, NOAT, KOVA, and GAAR from the Chukchi Sea to the
Canadian Border, and the Kigluaik and Bendeleben Mountains traversing the central Seward
Peninsula in BELA. The proximity of both the Chukchi and Bering Seas to the parks in northwest
Alaska and, more importantly, the presence or absence of sea ice influences land surface
temperatures and available moisture for these parks. Davey (2007) provides a more detailed
discussion of the climate of the Arctic Network.
1Methods
Monthly and annual means and totals were compiled for the climate variables measured at 27
weather and climate stations in and around the ARCN network for 2018.
The ARCN climate monitoring program deployed 17 climate stations between 2011 and 2014 to
capture elevational and latitudinal climate gradients within the parks. These sites are referred to as
ARCN RAWS (remote automated weather stations). For detailed information on operating
procedures see the ARCN weather and climate protocol implementation plan (Sousanes et al. 2017).
There are four additional RAWS sites that operate under the Interagency Fire program that are
included in this summary. The National Weather Service (NWS) operates three weather stations near
the ARCN parks in the communities of Bettles, Kotzebue, and Nome, Alaska that have been in
operation for > 50 years; at these sites the 2018 data was compared to the latest climate normal
period (1981–2010). And finally, the Natural Resources Conservation Service (NRCS) has three
snow telemetry (Snotel) sites near the ARCN parks that were used for year-round precipitation and
snow information (Figure 1, Table 1). The Snotel sites were analyzed by water year (October 1–
September 30). The ARCN data and metadata for 2018 are archived as discrete deliverables at
https://irma.nps.gov/DataStore/Reference/Profile/2254699.
Figure 1. Map of climate stations in ARCN region, including three Snotel sites (blue stars).
2Table 1. Climate stations included in this report.
Station Name Latitude Longitude Elevation (m) Station Type Start of Record
Asik 67.475 −162.266 410 ARCN Jul 2012
Atigun Pass 68.130 −149.480 1463 SNOTEL Jan 1983
Bettles 66.540 −151.310 196 COOP May 1951
Chimney Lake 67.714 −150.585 1166 ARCN Aug 2012
Coldfoot 67.250 −150.180 317 SNOTEL Mar 1995
Devil Mtn. 66.296 −164.520 87 ARCN Aug 2011
Ella Creek 65.275 −163.820 709 ARCN Sep 2012
Hoodoo Hill 65.595 −163.411 472 Fire RAWS Jun 1992
Howard Pass 68.156 −156.896 642 ARCN Jul 2011
Imelyak 67.545 −157.077 1099 ARCN Jul 2012
Kaluich 67.573 −158.432 752 ARCN Jul 2012
Kavet Creek 67.139 −159.044 72 Fire RAWS Jun 1992
Kelly Station 67.930 −162.280 94 SNOTEL Jul 2011
Killik Pass 67.984 −155.013 1326 ARCN Aug 2012
Kotzebue 66.867 −162.633 5 COOP Sep 1897
Kugururok 68.317 −161.492 335 ARCN Jul 2014
Midnight Mtn. 65.820 −164.543 691 ARCN Aug 2011
Mt. Noak 67.141 −162.995 257 ARCN Jul 2011
Noatak 68.071 −158.704 300 Fire RAWS Apr 1990
Nome 64.511 −165.440 11 COOP Aug 1900
Pamichtuk Lake 67.766 −152.164 1019 ARCN Aug 2012
Pargon Creek 64.990 −163.100 91 SNOTEL Oct 2000
Ram Creek 67.624 −154.345 1252 ARCN Aug 2012
Salmon River 67.460 −159.841 381 ARCN Jul 2011
Serpentine 65.852 −164.708 143 ARCN Aug 2011
Sisiak 67.995 −160.396 567 ARCN Jul 2011
Tahinichok 67.550 −163.567 292 ARCN Jul 2011
Data Corrections and Data Quality Grading
Many stations operate under extreme environmental conditions which cause a variety of challenges.
The most common problems are caused by wildlife and/or icing. Wildlife (usually bears), can
damage sensors, cables, or the power supply. Icing can obstruct free-air movement on naturally
aspirated radiation shields, build up on wind sensors, or block incident solar radiation sensors.
Blowing snow or corrosion of snow depth transducers can lead to false snow depth measurements.
During the annual site visits data were downloaded from each ARCN climate station and checked for
quality. ARCN station data, metadata, quality control flags/notes, and sensor history are managed
with Aquatic Informatics Aquarius software and stored on the NPS Water Resources Division server
3in Fort Collins, Colorado. Errors or values outside a standard range were flagged and not used in the
summary statistics. Details are logged in Aquarius and are also included in the annual maintenance
report. For more information on the QA/QC process see the corresponding standard operating
procedure (SOP) at https://irma.nps.gov/DataStore/Reference/Profile/2253025.
4Results
Temperature
Continuous temperature records date back to 2011 and 2012 for most of the ARCN RAWS. Table 2
lists the monthly and annual temperatures for these sites, with mean annual air temperatures (MAAT)
ranging from −6.4°C at Killik Pass in GAAR to −1.1°C at the Serpentine site in BELA (Table 2,
Figures 2 & 3). The sites near the coast were warmer overall in 2018 than the interior sites, a result of
warmer than normal ocean temperatures and record low sea ice extent in the Bering Sea (Thoman et
al. 2020). The 2018 mean annual temperature was the warmest to date for the Serpentine and Devil
Mountain sites in BELA. Every other ARCN RAWS site was warmer in 2016.
5Table 2. Monthly and annual mean temperatures (°C) from ARCN and Fire RAWS 2018.
Station Name Jan Feb Mar Apr May Jun Jul Aug Sep Oct Nov Dec Year
Asik −14.3 −8.4 −10.2 −4.2 3.2 10.3 12.3 9.0 7.3 0.2 −7.5 −14.8 −1.4
Chimney Lake −15.4 −12.3 −12.7 −8.3 0.5 6.4 10.4 4.4 2.4 −3.5 −9.3 −14.2 −4.3
Devil Mtn. −16.7 −10.1 −11.4 −6.6 0.4 8.7 11.9 9.2 7.4 0.7 −7.1 −15.7 −2.4
Ella Creek −14.5 −8.0 −10.7 −5.7 −0.3 7.3 10.2 6.3 5.6 −0.7 −7.9 −16.5 −2.9
HooDoo RAWS a −9.2 −9.4 −11.3 −6.8 1.2 9.0 12.4 8.4 7.1 1.3 −7.4 −16.7 c −1.8
Howard Pass −18.3 −10.7 −11.4 −9.8 0.5 6.3 11.6 5.5 4.6 −3.8 −12.8 −20.8 −4.9
Imelyak −15.0 −9.9 −11.8 −7.1 0.3 5.2 8.9 4.2 3.5 −2.5 −8.4 −15.1 −4.0
Kaluich −18.3 −10.9 −11.5 −9.4 0.5 6.8 11.3 5.7 4.6 −3.8 −12.3 −20.2 −4.8
Kavet Ck. RAWS b −21.9 −14.2 −10.1 −4.0 6.4 13.5 16.4 11.0 8.2 −0.8 −8.4 c −17.1 c −1.7
Kelly RAWS −19.0 −10.2 −10.2 −4.5 4.9 11.7 13.9 10.6 8.2 −0.1 −8.8 −16.9 −1.7
Killik Pass −17.7 −12.1 −14.0 −10.9 −1.6 3.5 8.3 2.6 1.2 −5.6 −11.9 −18.2 −6.4
Kugururok −16.5 −9.6 −10.9 −5.3 2.7 10.1 12.3 8.9 7.0 −1.2 −9.2 −16.9 −2.4
Midnight Mt. −15.8 −8.0 −9.6 −6.6 −0.5 6.6 9.7 6.1 5.3 −1.2 −8.1 −17.2 −3.3
Mt. Noak −15.2 −9.7 −10.9 −4.9 2.5 10.9 12.3 9.2 7.0 −0.5 −8.6 −15.7 −2.0
Noatak RAWS −26.9 −17.1 −13.9 −10.7 2.9 9.9 13.6 8.0 6.0 −4.6 −14.5 −22.1 −5.8
Pamichtuk Lake −17.0 −12.5 −12.7 −8.7 1.3 6.7 11.5 5.1 3.1 −3.5 −10.7 −16.9 −4.5
Ram Creek −16.8 −12.0 −13.9 −9.1 −0.2 6.4 9.7 4.0 2.2 −4.8 −10.9 −16.9 −5.2
Salmon River −16.1 −10.0 −10.8 −5.8 3.1 10.3 13.6 8.7 7.1 −1.4 −9.6 −16.7 −2.3
Serpentine −14.9 −6.8 −9.2 −4.7 1.9 9.5 13.1 9.7 8.4 1.7 −6.3 −15.6 −1.1
Sisiak −17.6 −11.0 −12.2 −8.1 1.8 8.4 11.6 7.0 5.3 −2.9 −11.0 −18.8 −4.0
Tahinichok −15.7 −9.4 −11.1 −5.6 2.1 10.0 11.3 9.0 6.9 −0.6 −8.7 −16.3 −2.4
a Quartz Creek RAWS was used for HooDoo.
b Kiana RAWS for Kavet Creek.
c Missing data; nearby station data was used as a proxy, also shown in bold italics.
6Figure 2. ARCN 2018 mean annual air temperatures, color coded by park. Blue=BELA, orange=CAKR,
yellow=KOVA, gray=NOAT, and green=GAAR.
For calendar year 2018, December was the coldest month with a network-wide average temperature
of −17.1°C, edging out January by 0.3°C. July was the warmest month with an average temperature
of 11.7°C ARCN wide. July was 3.3°C warmer than June and 4.5°C warmer than August (all ARCN
RAWS combined average).
The 2017–2018 winter season was the warmest to date for each of the ARCN RAWS sites (the
winter season includes December [2017], January, and February). The temperatures were particularly
warm in February throughout ARCN, especially in the western regions. Serpentine Hot Springs in
BELA was the warmest site with a mean monthly temperature of −6.8°C. On average at ARCN sites,
February was 5.9°C warmer than January and 1.4°C warmer than March despite increasing sunlight
as spring progressed.
April temperatures were warmest along the western coast while the higher elevation mountain sites
in NOAT and GAAR remained cool with monthly means between −8°C and −11°C. The high
elevation interior locations remained cool into late spring with temperatures averaging several
degrees cooler for May 2018 than the previous few years. The 2018 spring season (March, April,
May) was the warmest on record (2012–2018) for Serpentine and Devil Mountain, while spring 2016
was warmer at most of the other sites, except for Kaluich in NOAT and the GAAR stations which
were all warmer in the spring of 2015.
7Figure 3. Average fall temperatures at Serpentine (SRTA2) in BELA (top), Sisiak (SSIA2) in NOAT
(middle), and Chimney Lake (CHMA2) in GAAR.
8Average summer (June, July, August) temperatures ranged from a cool 4.8°C at Killik Pass in the
northwest corner of GAAR to a much warmer 10.9°C at Salmon River in KOVA. Summer seasonal
temperatures were more variable spatially, with Devil Mountain, Asik, Ram Creek, and Chimney
Lake having the warmest summer temperatures to date in 2018, while the summer of 2013 or 2016
were warmer for the other sites.
September and October are generally transition months in the Arctic when temperatures fall below
freezing and snow begins to accumulate. However, temperatures in fall of 2018 were much warmer
than the period of record average (Figure 3). Across the network, the fall of 2018 was, by far, the
warmest to date.
Summer Precipitation
ARCN stations measure summer rainfall with a standard tipping bucket. The ARCN and fire RAWS
rain gages are not shielded from wind and therefore measurements may underestimate precipitation
at exposed locations. NRCS SNOTEL sites in or near the park boundaries provide a robust
precipitation measurement in both summer and winter. Table 3 summarizes summer rainfall
measurements at select ARCN RAWS, fire RAWS, and SNOTEL stations.
Table 3. Rainfall (mm) from select ARCN, Fire RAWS, and SNOTEL stations in 2018.
Summer
Station Name Station Type June July August (June–August)
Chimney Lake ARCN 66 47 79 193
HooDoo RAWS Fire RAWS 34 52 70 166
Kaluich ARCN 111 81 74 266
Kavet RAWS Fire RAWS 39 47 65 179
Killik Pass ARCN 39 69 105 213
Kugururok ARCN 39 45 47 132
Noatak RAWS Fire RAWS 30 44 63 150
Pamichtuk Lake ARCN 73 62 77 212
Serpentine ARCN 23 35 72 130
Atigun Pass SNOTEL 89 132 142 363
Coldfoot SNOTEL 56 53 94 203
Kelly Station SNOTEL 20 69 23 112
Pargon Creek SNOTEL 51 28 53 132
Summer (June–August) rainfall measurements were highly variable in 2018 and ranged from 112
mm at Kelly Station to 363 mm at Atigun Pass (Table 3, Figure 4). The highest monthly total was
142 mm recorded at Atigun Pass in August. Elevation, topography, and storm tracks explain some of
the spatial variability as well as localized (convective) summer rain showers that are common in
mountainous regions. August was the rainiest month at all stations with >70 mm recorded at most
9sites. In summer 2018, Atigun Pass and Kaluich recorded the most rainfall and the lowest-elevation
sites (Kelly, Pargon Creek, Kugururok) recorded the least amount of rainfall.
Figure 4. ARCN 2018 summer precipitation. Green sites are in or near GAAR, grey WEAR, and blue
BELA.
Snow and Year-round Precipitation (2017–2018 Season)
SNOTEL Sites
Year-round precipitation (rain and melted snow) is recorded at the SNOTEL sites at Coldfoot, Atigun
Pass, Kelly Station, and Pargon Creek (Table 4). For water year 2018 (October 1, 2017–September
30, 2018), the Coldfoot SNOTEL site recorded 208 mm of total winter precipitation (snow water
equivalent, SWE) from October 1, 2017 through May 1, 2018, which is 112% of the 1981–2010
normal. The total annual precipitation for the site was 465 mm; the cold season precipitation
accounted for 45% of the total annual precipitation. The period of continuous snow was from
October 5 to May 20. Peak snow depth was 89 cm which occurred on March 9. Peak SWE occurred
about a month later with 213 mm on April 2 through 9 and was the highest SWE at the site since
2009 (Figure 5).
10Table 4. Precipitation and snow summary statistics for SNOTEL stations in water year 2018.
Winter Precip. Annual Precip. Peak Spring
mm mm Snow Depth cm Peak SWE mm Snow
Site (% of normal) a,c (% of normal) (Date) (Date) b Snow On Off
Coldfoot 208 (112%) 465 (100%) 89 (Mar 9) 213 (April 2–9) 10/5/17 5/20/18
Atigun Pass 163 (96%) 645 (110%) 157 (May 20) – 8/26/17 7/1/18
Kelly Station 262 ( ) d 406 ( ) d 104 (Mar 24) 254 (April 6–28) 9/27/17 5/20/18
Pargon Creek 236 (138%) 406 (118%) 81 (Mar. 20) – 10/17/17 5/18/18
a The winter season is defined as October 1–May 1.
b Snow water equivalent (SWE) is not measured at Atigun Pass or Pargon Creek.
c For sites with < 20 years of data, a ratio adjustment method was applied to the normal, based on the normal of
a neighboring site with a long period of record (NRCS 2020a).
d Kelly Station does not have 1981–2010 normals calculated as of 2020, this site is still being reviewed.
Figure 5. Cumulative precipitation and SWE at Coldfoot over the past decade by water year ending with
the 2018 water year. Graph generated from NRCS (NRCS 2020).
The precipitation gage at Atigun Pass recorded 645 mm of precipitation from October 1, 2017
through September 30. The annual precipitation was 110% of normal. The period of continuous snow
at Atigun Pass was more than 10 months long, starting on August 26 and persisting through July 1.
The peak snow depth at this site is generally in mid-May; in 2018 it occurred on May 20. On May 30
there was still 119 cm on the ground, the most for this date in over a decade of measurements.
(Figure 6).
11Figure 6. Cumulative precipitation and snow depth at Atigun Pass over the past decade by water year
ending with the 2018 water year. Graph generated from NRCS (NRCS 2020).
Kelly Station in NOAT had 262 mm of winter precipitation for the 2018 water year, about 65% of
the annual total (406 mm) and about twice as much as the past six years (record dates back to 2012).
Snow depth reached its maximum of 104 cm on March 24 with a peak water content of 236 mm
(Figure 7). Snow cover persisted at Kelly Station from September 27 through May 20. This was the
second latest melt-out date since 2013 when it melted on May 27. The record is relatively short with
only six years of data
Figure 7. Cumulative precipitation and SWE for the past seven years at Kelly Station in NOAT ending
with water year 2018. Graph generated from NRCS (NRCS 2020).
12Pargon Creek has been operating since 2000 and this was the fifth wettest year to date at this site.
The total precipitation for water year 2018 was 406 mm, with a total of 236 mm for the cold season,
which is 58% of the annual total. Peak snow depth was on March 20 with 81 cm, the deepest since
2009 (Figure 8). Continuous snow cover was established on October 17 and melt-out was on May 18.
Figure 8. Cumulative precipitation for water year 2018 (October 1, 2017–September 30, 2018) at Pargon
Creek. Graph generated from NRCS (NRCS 2020).
2018 Weather at Bettles, Kotzebue, Nome (index sites)
Temperature – Index Sites
Bettles, Kotzebue, and Nome had mean annual air temperatures well above the long-term normal for
2018 (Table 5). It was the second warmest year on record for Kotzebue. 2018 was the fifth
consecutive year where the mean annual temperature at Kotzebue was among the five warmest years
on record. The warmest years to date in order are: 2016, 2018, 2014, 2017, and 2015. It was the
fourth warmest year on record for Nome, the top five warmest years in Nome were: 2016, 2014,
2018, 1978, and 2004. In Bettles, 2018 was the 5th warmest year on record. In Bettles, the warmest
years are not all recent. The top five are: 2016, 1981, 1978, 1993 and 2018.
The 2017–18 winter season was warm along the west coast of Alaska as mentioned previously.
Numerous warm storms from the south prevented sea ice from establishing off the coast of Alaska.
The open water moderated temperatures over land leading to a relatively warm cold season. Winter
2017–2018 was 6.2°C warmer than the 1981–2010 normal in Kotzebue, 4.7°C warmer than normal
in Nome, and 3.7°C warmer than normal in Bettles.
13Table 5. 2018 monthly mean temperatures and departures from 1981–2010 normal for index sites in ARCN (°C).
Station
Name Temperature Jan Feb Mar Apr May Jun Jul Aug Sep Oct Nov Dec Year
Average
Temperature −23.1 −19.1 −12.9 −4.9 7.4 13.6 16.3 10.4 6.1 −1.8 −12.8 −18.3 −3.3
(°C)
Bettles
Departure
from Normal +0.3 +1.5 +2.4 −0.1 +0.5 −1.2 +0.9 −1.0 +1.3 +5.4 +5.6 +2.7 +1.5
(°C)
Average
Temperature −17.1 −10.6 −10.7 −5.9 2.2 11.6 14.7 11.9 9.5 1.3 −7.9 −16.4 −1.4
(°C)
Kotzebue
Departure
from Normal +2.2 +7.6 +6.5 +4.4 +2.2 +4.0 +2.2 +1.0 +3.8 +5.6 +4.8 +0.1 +3.7
(°C)
Average
Temperature −14.9 −13.7 −12.1 −6.4 2.7 8.8 11.2 10.1 6.0 −1.8 −8.4 −12.5 −2.6
Nome (°C)
Departure
+1.3 +6.1 +3.7 +3.2 −0.3 +1.7 0.7 0.0 +2.5 +5.4 +4.4 −2.7 +2.2
from Normal
14Warm temperatures persisted into March and April, with the strongest warm anomalies continuing at
the west coast sites of Nome and Kotzebue. It was the second warmest spring on record in Kotzebue.
Overall, the average summer season (June–August) temperature was just below normal for Bettles
mostly driven by cool temperatures in mid-June and early August. It was just above normal in Nome
(+0.8°C), while Kotzebue’s warm trend continued with an average summer temperature +2.4°C
above the 1981–2010 normal. Statewide, fall 2018 was the second warmest fall on record with
records dating back to 1925. The west coast of Alaska was the warmest on record (Figure 9).
Figure 9. Record warm fall along Alaska’s west coast for 2018. Graph courtesy of NCEI
(https://www.ncdc.noaa.gov/cag).
15Precipitation – Index Sites
Annual precipitation totals at the ARCN index sites varied from 91% of normal in Nome to 130% of normal at Bettles (Table 6). March was
a particularly wet (snowy) month at both Kotzebue (482% of normal) and Nome (382% of normal). April precipitation was near normal at
Bettles and Nome, but below normal in Kotzebue. May precipitation was well above normal in Bettles, drier than normal in Nome, and
about average in Kotzebue. Nome remained drier than normal through the summer, while Bettles was wetter than normal for June and
August and Kotzebue was wetter than normal for July. September was a dry month for all of the sites. Bettles ended the calendar year with a
very snowy December, with precipitation at 380% of normal.
Table 6. Monthly and annual precipitation (mm) and departures from normal (%) for 2018.
Station
Name Precipitation Jan Feb Mar Apr May Jun Jul Aug Sep Oct Nov Dec Year
Total
Precipitation 26 14 12 16 62 67 39 77 31 39 19 89 490
Bettles (mm)
Percent of
127% 65% 84% 107% 277% 187% 65% 114% 64% 146% 80% 380% 130%
Normal
Total
Precipitation 7 28 54 5 9 16 48 44 10 20 16 17 274
Kotzebue (mm)
Percent of
42% 170% 482% 35% 90% 109% 130% 80% 24% 76% 83% 89% 98%
Normal
Total
Precipitation 12 37 63 23 11 7 38 65 33 43 38 21 390
Nome (mm)
Percent of
49% 157% 382% 121% 49% 29% 71% 79% 53% 105% 122% 76% 91%
Normal
16Snow – Index Sites
The seasonal snowfall total (July 1–June 30) for Bettles was above normal with 289 cm for the season, about 124% of normal. Most of the
snow fell during late fall and early winter. In Kotzebue, the 2017–2018 snowfall total was 273 cm, which is 180% of normal. Total snowfall
in Nome was 295 cm for the season, 154% of normal (Table 7). November and March were the snowiest months of the season for both
Kotzebue and Nome, however most of the winter months had more snow than normal.
Table 7. Monthly and annual snowfall (cm) and departures from normal (cm) July 2017–June 2018.
Station Name Snowfall Jul Aug Sep Oct Nov Dec Jan Feb Mar Apr May Jun Season
Total Snowfall
0 0 0 56 54 82 41 27 25 1 2 0 289
(cm)
Bettles Departure
from Normal 0 0 −6 +24 +13 +43 +6 −9 +2 −15 −1 0 +57
(cm)
Total Snowfall
0 0 0 22 82 50 11 36 62 3 7 0 273
(cm)
Kotzebue Departure
from Normal 0 0 −2 +6 +56 +21 −12 +12 +47 −10 +4 0 +121
(cm)
Total Snowfall
0 0 0 24 56 47 15 44 86 22 1 0 295
(cm)
Nome Departure
from Normal 0 0 −2 +12 +26 +11 −18 +13 +64 +3 −5 −1 +103
(cm)
17Discussion
The mean annual temperature at the ARCN index sites averaged +2.5°C warmer than the 1981–2010
normal. The sites near the coast were warmer overall in 2018 than the interior sites, a result of
warmer than normal ocean temperatures and record low sea ice extent in the Bering Sea. The 2017–
2018 winter season was the warmest winter since the ARCN RAWS sites were established in
2011/12. Summer seasonal temperatures were more variable. Across the network, the fall of 2018
was the warmest to date.
Annual precipitation totals at the ARCN index sites varied from 91% of normal in Nome to 130% of
normal at Bettles. There was abundant snowfall in March for the coastal areas and abundant snow in
late fall/early winter (2017) for the interior region. Summer precipitation was more variable with
drier areas along the southern Seward Peninula and wetter areas in the interior region. Early fall was
dry throughout the region. The GAAR region ended the calendar year with a very snowy December.
The climate data for 2018 were compiled and summarized using ARCN data from the NPS sites and
from index sites around the region. Seasonal weather summaries are also produced four times a year
for WEAR, BELA, and GAAR and provide relevant information on current weather statistics. These
summaries are available from the network website or from the Integrated Resource Management
Application (IRMA) portal.
The data from long-term sites are available from the National Centers for Environmental Information
(NCEI) . The ARCN climate stations transmit data via satellite and are available on the web from
MesoWest and the Western Regional Climate Center (WRCC). An interagency agreement is in place
for the maintenance, data archiving, and data dissemination for the four SNOTEL sites in the
network. The data from the stations are transmitted hourly via satellite and are available on-line at
National Water and Climate Center.
This annual report provided a climate summary for the ARCN region in 2018 with brief references to
the Alaska regional climate for 2018.
18Literature Cited
Davey, C. A., K. T. Redmond, and D. B. Simeral. 2007. Weather and climate inventory, National
Park Service, Arctic Network. Natural Resources Technical Report NPS/ARCN/NRTR–
2007/005. National Park Service, Fort Collins, Colorado.
Hill, K., and P. Sousanes. 2020. Climate station maintenance in the Arctic Inventory and Monitoring
Network: 2018 summary. Natural Resource Data Series NPS/ARCN/NRDS—2020/xxxx (in
review). National Park Service, Fort Collins, Colorado.
Natural Resources Conservation Service (NRCS). 2020. National Water and Climate Center website.
Available at http://www.wcc.nrcs.usda.gov/ (accessed on 6 February 2020).
Natural Resources Conservation Service (NRCS). 2020a. National Water and Climate Center
website. 30-Year climatic and hydrological normal (1981–2010). Available at
https://www.wcc.nrcs.usda.gov/normals/30year_normals_data.htm (accessed on 6 April 2020).
Sousanes, P. J., K. R. Hill, W. F. Johnson, and S. D. Miller. 2017. Protocol implementation plan for
monitoring weather and climate in the Arctic Network. Natural Resource Report
NPS/ARCN/NRR—2017/1537. National Park Service, Fort Collins, Colorado.
Thoman, R.L., U.S. Bhatt, P.A. Bieniek, B.R. Brettschneider, M. Brubaker, S.L. Danielson, Z. Labe,
R. Lader, W.N. Meier, G. Sheffield, and J.E. Walsh, 2020. The record low Bering Sea ice extent
in 2018: context, impacts, and an assessment of the role of anthropogenic climate change. [in
“Explaining Extremes of 2018 from a Climate Perspective”]. Bull. Amer. Meteor. Soc., 101 (1),
S17–S22, doi:10.1175/BAMSD-19-0233.1.
19The Department of the Interior protects and manages the nation’s natural resources and cultural heritage; provides scientific and other information about those resources; and honors its special responsibilities to American Indians, Alaska Natives, and affiliated Island Communities. NPS 953/175157, March 2021
National Park Service
 U.S. Department of the Interior

Natural Resource Stewardship and Science
1201 Oakridge Drive, Suite 150
Fort Collins, CO 80525

EXPERIENCE YOUR AMERICA TM
You can also read