Analysis of the treated wood market for Agricultural and Horticultural uses in New Zealand
←
→
Page content transcription
If your browser does not render page correctly, please read the page content below
Analysis of the treated wood market for Agricultural and
           Horticultural uses in New Zealand

A dissertation submitted in partial fulfilment of the requirements for the
                degree of Bachelor of Forestry Science

                        Boris van Bruchem

       Supervisors: Dr. David Evison and Dr. Clemens Altaner

                   New Zealand School of Forestry

                        University of Canterbury

                      Christchurch, New Zealand

                             October 2020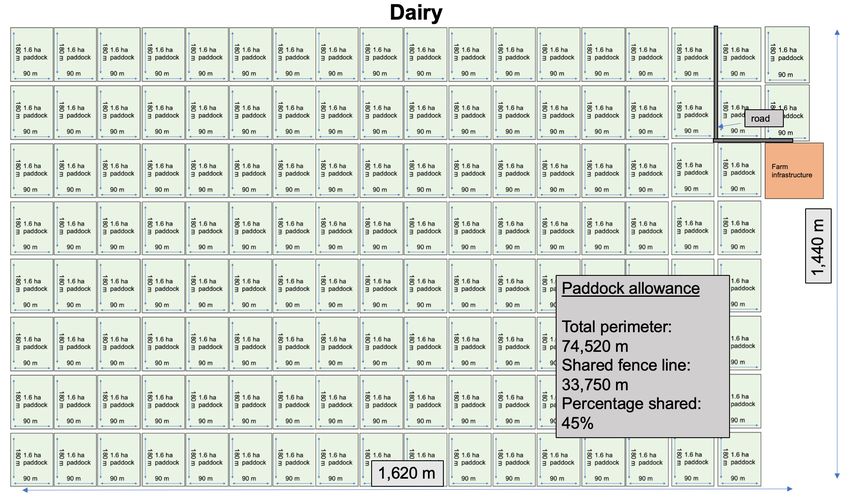
Abstract
This study analysed the treated wood market for agricultural and horticultural uses in New
Zealand. Treated wood refers to fence posts for stock and crops, kiwifruit pergolas,
vineyards posts and other horticultural supporting structures. Radiata pine (Pinus radiata) is
the predominant species used in these industries and requires chromated copper arsenate
(CCA) preservative treatment for outdoor application. This research is pertinent as there are
concerns about CCA treated wood disposal, while there has been no publicly available
analysis of the market. The information presented here will aid the New Zealand Dryland
Forests Initiative (NZDFI) and elucidate the importance of the small dimension log resource.

Three sources of data were used to produce independent estimates of the market:
   1. a use per hectare estimate
   2. a manufacturers’ estimate
   3. a resource use estimate

It was estimated that approximately 6.9 million m3 of CCA treated wood is currently present
in the agricultural and horticultural industries using the use per hectare method. This
presents a significant disposal liability, with policy and a country-wide disposal strategy
potentially required. Annually, based on sector expansions and replacement rates, ~290,000
m3 per year is used. The manufacturers’ method estimated a range of ~270,000 m3 to
~310,000 m3 per year based on information from two independent CCA organisations.
Lastly, the resource use method estimated ~390,000 m3 per year based on forest grower
surveys.

The market is most likely between approximately ~270,000 m3 to ~310,000 m3 per year, as
the resource use estimate presumably overestimates as survey responders indicated that
house pile, pulp log, saw log and firewood volumes were included. The use per hectare
estimate may also be an overestimation as non-wood products such as plastic and metal
posts were not accounted for although experts indicated that these products only represent
a small proportion of the market.

From the NZDFI perspective, the organic sector estimate of ~6,000 m3 per year to ~14,000
m3 per year is relevant. The lower estimate is based on a conservative expansion rate, while
the upper estimate uses a high expansion rate, indicating the range. Further work regarding
the feasibility of the NZDFI alternative eucalypt products is appropriate.

Concerning the small dimension log resource, the importance to forestry companies tends to
depend on regions. Roundwood producers are concentrated in the Nelson, Central North
Island (CNI) and Northland regions which are areas with low fertility soils typically producing
trees with less taper and smaller branches. The requirements for roundwood products are
reasonably strict and prices generally do not justify their production in comparison with the
main competition of export pulp and K grades. This was especially true for forests located
near ports.

                                                                                              2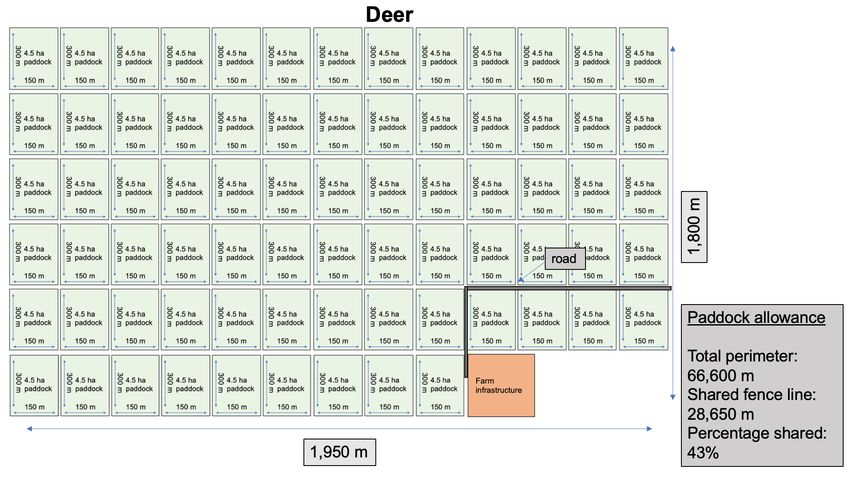
Acknowledgements
First and foremost I would like to thank my excellent supervisors Dr. David Evison and Dr.
Clemens Altaner for their supervision and guidance. This project would not be possible
without their help and for that, I thank them wholeheartedly. Secondly, I would like to thank
everyone that helped me in any way during the year. People like Paul Millen, Mark
Bloomberg, Rob Sheppard and many more provided expert comments at various stages of
the project, which was greatly appreciated. Thirdly, I would like to thank all of the rest of my
fourth-year class for a great final year and a very enjoyable four years at the School of
Forestry. Lastly, I would like to thank my family, particularly my parents Ewout and Liesbeth
for their support not just at university, but throughout my whole life. A big thank you must
also go to Luis Apiolaza for organising and coordinating the course in challenging
circumstances.

                                                                                                   3
Table of contents

Abstract                                                    2

Acknowledgements                                            3

1.   Introduction                                           6

2.   Problem statement and objectives                       8

       2.1. Lack of information and misclassifications      8

       2.2. Chromated copper arsenate concerns              9

       2.3. Small-dimension timber resource opportunities   9

       2.4. Research questions                              9

3.   Review of literature                                   11

4.   Data and methods of analysis                           14

       4.1. Use per hectare                                 14

              4.1.1. Pastoral agriculture                   14

              4.1.2. Vineyards                              20

              4.1.3. Kiwifruit                              21

              4.1.4. Apple                                  22

              4.1.5. Organic sector                         23

       4.2. Manufacturers                                   23

       4.3. Forest growers                                  23

5.   Results and discussion                                 24

       5.1. Use per hectare                                 24

              5.1.1. Pastoral agriculture                   24

              5.1.2. Total size and annual market demand    25

                                                             4
5.1.3. Organic sector                      26

              5.1.4. CCA liability                       27

              5.1.5. Alternatives to treated wood        28

       5.2. Manufacturers                                28

       5.3. Forest growers                               29

              5.3.1. Pro-rata approach                   29

       5.4. Comparison                                   30

       5.5. Log specifications and postwood log market   31

       5.6. The supply chain for treated roundwood       33

6.   Areas for further study                             34

7.   Conclusion                                          35

8.   References                                          36

9.   Appendices                                          40

       9.1. Appendix 1                                   40

       9.2. Appendix 2                                   41

       9.3. Appendix 3                                   42

       9.4. Appendix 4                                   43

       9.5. Appendix 5                                   44

       9.6. Appendix 6                                   46

       9.7. Appendix 7                                   47

                                                          5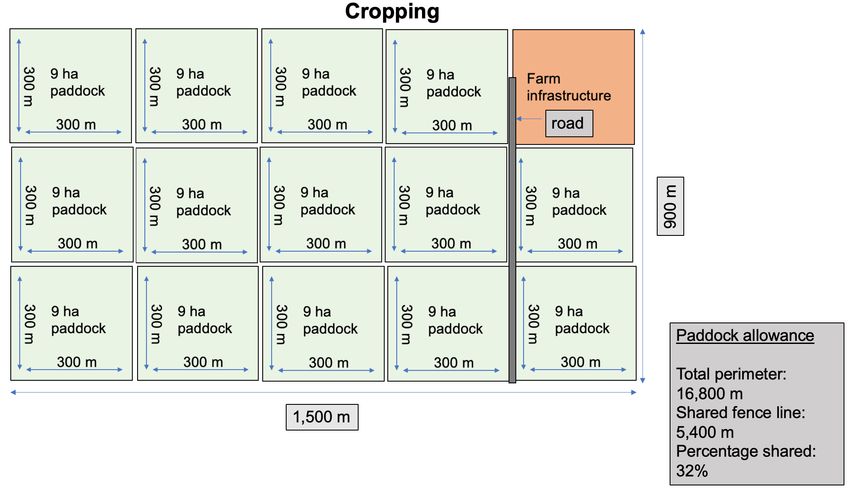
1. Introduction
The forest industry contributed $1.91 billion to New Zealand’s GDP in 2019 (Infoshare,
2019), while the other primary sectors of agriculture and horticulture were also prominent in
New Zealand’s economy (Westpac, 2016). Horticulture contributed $2.06 billion, while sheep
and beef and other livestock farming contributed $4.21 billion in addition to dairy farming’s
contribution of $6.16 billion to New Zealand’s GDP in 2019 (Infoshare, 2019). Although each
of these industries has been analysed extensively, little has been published about forestry’s
relationship with agriculture and horticulture. Specifically, there is little publicly available
information about the treated wood market for agricultural and horticultural uses in New
Zealand. Ostensibly, this market is significant, with these primary industries playing a key
role in New Zealand’s economy.

Roundwood is a term commonly used to define both posts and poles, including other
materials such as strainers, half rounds, quarter rounds etc. There is a continuous transition
in terms of production of posts to poles, with compliance to building and construction
standards such as NZS3605 (2001), AS/NZS4676 (2000) or AS2209 (1994) necessary for
the latter (Altaner, 2020). Generally, roundwood post and pole products differ widely across
these industries (Manley & Calderon, 1982). This study looked at fence material for stock
and crops, kiwifruit pergolas, vineyard posts and other horticultural supporting structures. It
did not include treated wood for retaining walls, power poles, decks, sheds and so forth. As
the majority of wood used in the agricultural and horticultural industries is in ground contact,
there is a risk of fungal decay. Radiata pine (Pinus radiata) is the most commonly used
species in these two industries and is the dominant plantation species in New Zealand
(Richardson, 1993). However, it is not naturally durable and requires preservative treatments
such as chromated copper arsenate (CCA) to be suitable for outdoor applications (New
Zealand Timber Industry Federation, 2013).

This study used three different ways to estimate the size of the treated wood market for
agricultural and horticultural uses. Firstly, the market was estimated directly from an
estimate of the stock of treated wood in these industries and an estimate of service life. This
method is an approximation and involved reconciliation to increase accuracy. Secondly, the
production of treated wood was obtained from data provided by the manufacturers who use
treatment chemicals, predominately CCA. Lastly, production at the forest level referring to
the volume of harvested wood that makes up the supply of treated wood provided the third
estimate.

This work is useful for the New Zealand forest industry as it can lead to better utilisation and
an increased understanding of markets for the small diameter log resource. When producing
posts, smaller diameter logs are used, leading to higher value solid wood products. There
appears to be a good opportunity to use commercial thinnings or even harvesting residues
for posts (Visser et al., 2018). There is also potential for new markets and products to be
found for posts (Altaner, 2020). This research will aid the establishment of a naturally
durable hardwood resource (Hedley, 1997) as proposed by the New Zealand Dryland
Forests Initiative (NZDFI). The NZDFI project was established in 2008 and proposes

                                                                                               6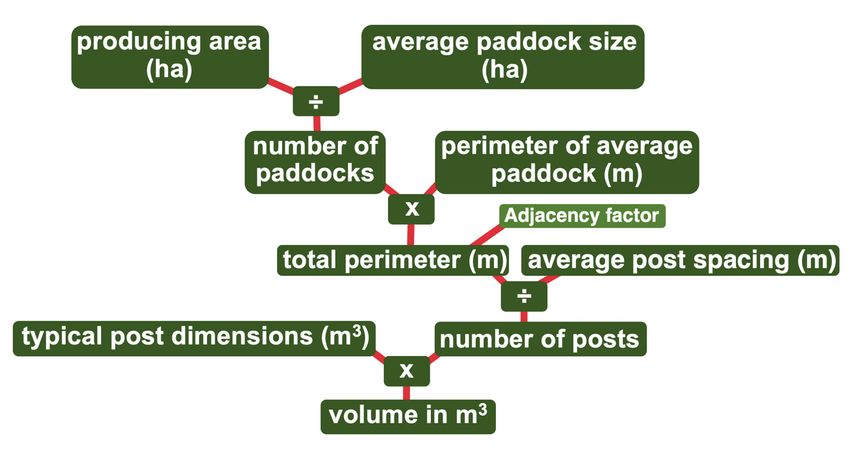
eucalypts as a promising alternative to treated radiata pine (NZDFI, 2019). The focus is
therefore on the agricultural and horticultural markets (Millen et al., 2018b). Manley and
Calderon (1982) also noted that in terms of both the number and volume, the greatest
demand in these industries is for relatively small agricultural and horticultural posts.

                                                                                             7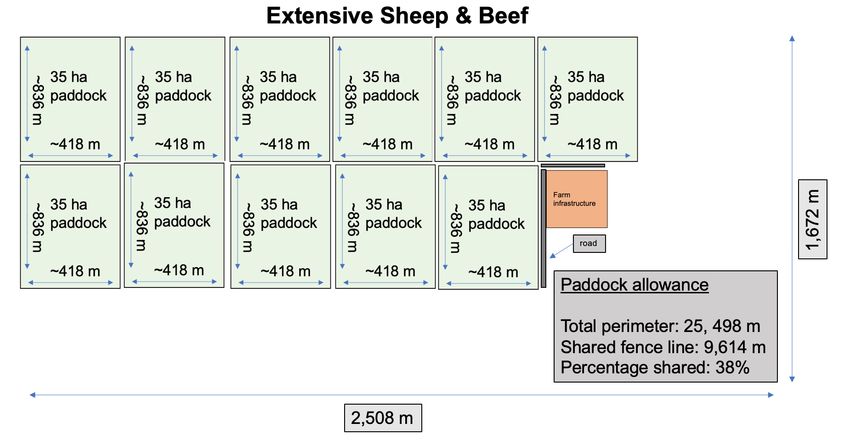
2. Problem statement and objectives
                   2.1. Lack of information and misclassifications
There is a lack of information in this subject area. No comprehensive analysis of the treated
wood market for agricultural and horticultural uses in New Zealand is available. This makes
it difficult to know exactly how much treated wood is being used by the different industries.
Dunn (2011) stressed the importance of further research in this field.

In addition to the lack of information about the market, there are also inconsistent definitions
and classifications. For instance, the Food and Agriculture Organization (FAO) of the United
Nations (2016) reported industrial roundwood as containing the following categories:
pulpwood, sawlogs and veneer logs as well as other industrial roundwood. The latter is
relevant for this study, as it contains data on roundwood used for fence posts, but there is no
specific data on this category.

Evison (2016) confirmed this inconsistency, as he noted that other industrial roundwood
does not add up to total industrial roundwood, stating that the reason for the disparity is
unknown. The Ministry for Primary Industries (MPI) (2014) also used FAO data, specifying
posts as part of ‘other industrial roundwood’.

Figure 1. Roundwood classification with the red circle denoting ‘other industrial roundwood’
(After: MPI, 2014).

Figure 1 shows the distinction of this category, but as is the case with the aforementioned
papers, the values are unclear or not reported. The paper notes that there are difficulties in
tracking the production and trade of posts (MPI, 2014). They also note that ‘other industrial
roundwood’ was not considered a separate category in FAO trade data since 1997. ‘Other
industrial roundwood’ also included all export logs, which is a large proportion in New
Zealand. It was noted that the available FAO data contains many errors and discrepancies
between sources.

                                                                                                 8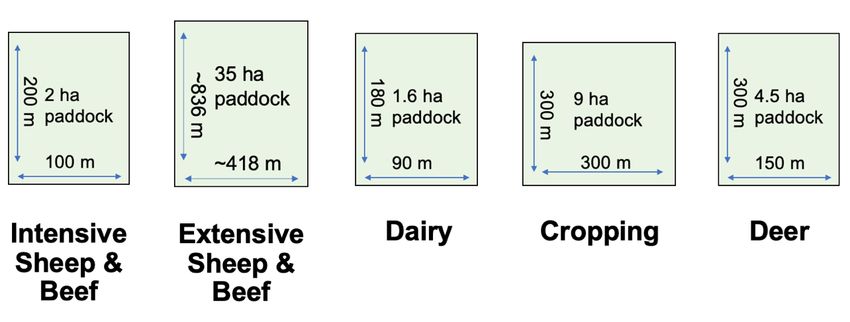
2.2. Chromated copper arsenate concerns
As radiata pine is not naturally durable and is easy to impregnate, preservatives such as
CCA are used extensively where applications require a specific level of wood durability. New
Zealand is one of the largest per capita users of CCA treated timber in the world (Christmas,
2002). Radiata pine is by far the most commonly treated species in New Zealand (Connell et
al., 1995). However, CCA treated wood is problematic, as it is difficult to dispose of. Burning
is prohibited, with disposal methods limited to secure landfills or well-controlled incineration
facilities (Rhodes, 2013). Even when disposed of in landfills, treated timber can leach
copper, chromium and arsenic into the surrounding soil. This has raised concerns about
contaminants in waterways in addition to the soils surrounding the posts (Vogeler et al.,
2005). Some soils already exceed the recommended guidelines for chromium and arsenic in
agricultural soils as indicated in the report by the National Environmental Protection Council
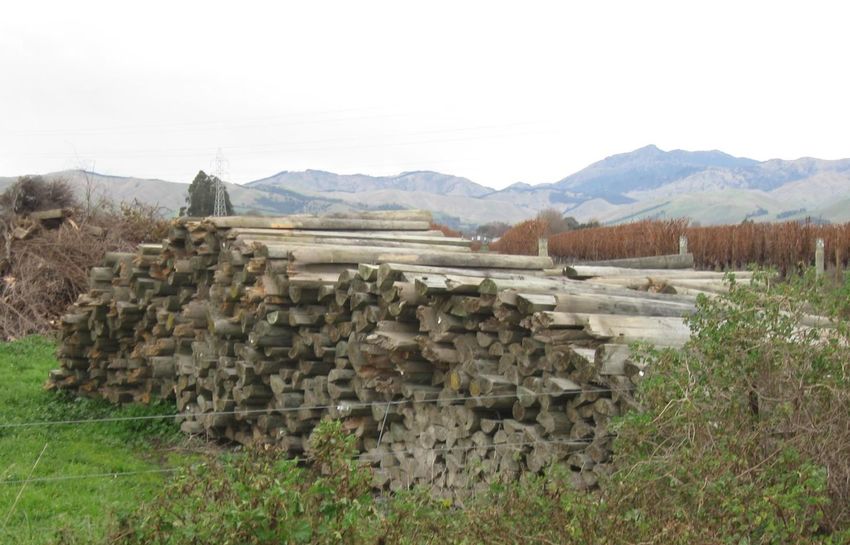
(1999). Vineyards and farms have limited options for disposal and opt to store the posts on
site at the end of their service life (Marlborough District Council, 2016), as seen in Appendix
1. With New Zealand striving to maintain its ‘clean green image’ (Blackett & Le Heron, 2008)
and the fact that CCA treatment has been banned in some overseas markets, alternatives to
treated radiata pine are being explored.
These alternatives include plastic, steel and posts made of naturally durable timber (Millen &
Altaner, 2017). The NZDFI is concerned with the latter since its mission is to research the
growth and utilisation of ground durable eucalypt species. This research is therefore
beneficial, as the NZDFI can determine how much durable eucalypt timber will be needed
domestically. This information is also particularly useful for those in the organic farming and
horticultural sectors because the installation of new CCA treated radiata pine posts has been
banned in certified organic food production systems (Millen & Altaner, 2017).
2.3. Small-dimension timber resource opportunities
The small-dimension timber resource is poorly understood but provides a very good
opportunity for increasing the value of forestry resources. Spinelli et al. (2018) noted that
companies can significantly increase the value of their small logs if they sell them as posts
for agricultural and horticultural uses. Altaner (2020) noted that post prices with wholesale
values of $300 to $400 per m3 are comparable to sawn timber. Furthermore, the utilisation of
commercial thinnings and potentially harvesting residues indicates a great opportunity.
Therefore, this work will contribute to the knowledge of the small-dimension timber resource
and indicate the potential market opportunities for forest growers.
2.4. Research questions
This research addressed the lack of information about the agricultural and horticultural
treated wood market which is generally also poorly defined. The outcomes will be useful for
the NZDFI, relating to the organic sector and forestry companies who can better understand
the market for the small dimension timber resource. Also, knowing the stock of CCA treated
posts allows the government and industry to know the size of the risk and liabilities of their
disposal. This could be useful in guiding future policy. The following research questions will
be addressed:
9
Overall market
   § How many treated wood posts (number of posts and volume) are currently in
       agricultural and horticultural systems?
   § What is the size of the agricultural and horticultural markets for treated wood posts?
   § What are the log requirements (specifications) for treated wood for agricultural and
       horticultural uses?
   § What is the importance of the small-dimension log resource for forestry companies?
Organic market
   § How many posts (total) are in organic systems?
   § How big is the market of treated posts in organic systems?

                                                                                          10
3. Review of literature
Orton and Evison (2009), in conjunction with industry sources, estimated the treated wood
market for agricultural and horticultural uses to be 220,000 m3 per year. They had a
particular interest in the winegrowing industry and found that this industry consumed
approximately 22,000 m3 per year or 10% of the total treated market in New Zealand. Millen
et al. (2009) estimated that around 900,000 posts per year would be needed for replacing
broken posts in vineyards, with approximately 24,000 m3 per year of hazardous CCA waste
produced. This is slightly different from the Orton and Evison estimate and indicates that
there is some variation in market estimates.
Carpenter (1994) published a paper about the posts and poles industry in New Zealand and
noted that demand fluctuated greatly. He attributed this fluctuation to the increase in kiwifruit
production in the 1980s, which saw an increase in demand and also the primary sector
downturn in the late 1980s, seeing a decrease in demand. Domestic demand for farming
fence posts was forecasted to remain consistent through the 1990s and largely follow the
economic peaks and troughs of the sector. He indicated that farming and horticulture
dominate the treated wood market with vineyards in particular becoming significant users of
posts. It was estimated that from 1986 to 1987, 312,000 m3 of treated posts and poles were
processed in New Zealand. Carpenter (1994) noted that this figure likely remained
consistent through some of the 1990s with data no longer collected after this period. This
estimate contains wood for many uses such as residential, construction, engineering, marine
and recreational. Therefore, the treated wood used just in the agricultural and horticultural
industries is likely lower than this figure. As part of the study, Carpenter (1994) also
compiled information on the requirements for various roundwood products, shown in Table
1.
Table 1. Summary of requirements for various roundwood products (After: Carpenter, 1994).
1/4 round Fence Posts 1/2 round
round
Species Pinus spp. Pinus spp. Pinus spp.
Lengths (m) 1.5-3.0 1.5-3.0 1.5-3.6
Diameter range 75-150 60-120 75-200
(mm)
Treatment Hazard H4 H4 H4
Class
Max Single Knot 20% 20% circumference 20% circumference
Diameter circumference
Sum of 33% 33% circumference 33% circumference
Knots/Whorls circumference
Sweep (mm/m) 20 20 20
Number of growth - 10 in 100mm and 10 in 150mm and larger, at
rings larger, at the SED the SED
11Also, of interest are the prices of postwood, with data presented here comparing 2020 to
2010.
Table 2. Radiata pine log sales for postwood in dollars per tonne comparing 2020 to 2010,
with the latter adjusted for inflation (After: New Zealand Farm Forestry Association, 2020).
$/t Northern Central Southern Northern Central Southern
North North North South South South
Island Island Island Island Island Island
2020 82 - 95 90 - 100 84 - 94 72 - 90 90 - 100 82 - 93
2010 85 - 91 88 - 94 79 - 91 79 - 98 98 - 116 85 - 91
There has also been literature published that contains some relevant figures using CCA
production information. The approximately 165 timber treatment plants in New Zealand were
estimated to use 5,000 tonnes of CCA salt equivalent each year to treat around 650,000 m3
of timber to various treatment levels (Love, 2007; Read, 2003; Rhodes, 2013). This relates
to the New Zealand Timber Preservation Council (TPC), with non TPC plants expected to
add to this value (Read, 2003). This estimate of treated timber is not exclusively for products
used in agricultural and horticultural applications. CCA treated wood is used domestically as
decks, garden furniture, playground equipment, landscaping, retaining walls, fences, patios
and gazebos mostly based on sawnwood, not roundwood. But it also includes CCA timber
used for docks, signposts, utility poles, and agricultural or horticultural posts (Read,
2003). The two latter uses were of interest for this study, but there is no publicly available
information on the breakdown of volume used in these products.
Regional variation exists regarding wood quality (Cown & McConchie, 1982), with different
silvicultural prescriptions typically required. For instance, when growing radiata pine for
poles, a compromise is necessary between maintaining very high stockings to suppress
individual tree growth and limit branch development and elevated competitive mortality
(Manley & Calderon, 1982). Further regime information was presented by Millen et al.
(2018a) regarding the NZDFI durable eucalypt products. This detailed a peeler pole
plantation with a high final stocking, a 15 to 20 year rotation and small piece sizes on flat to
easy sites. A peeler log/saw log plantation was also suggested with a low final stocking, a 30
to 40 year rotation, large piece sizes on stable but steep sites (Millen et al., 2018a).
Internationally, an estimate of roundwood for both landscape and agriculture exists for
Australia (Dunn, 2011), although only for 2000, 2007 and 2010 (Table 3). The values
represent the estimated treated softwood volume which increased from 2000 to 2007 and
then decreased to 2010. The decrease was attributed to a reduction in demand for
agricultural and horticultural posts due to long periods of drought, particularly in the key
markets of Victoria and South Australia. Dunn (2011) also noted that fewer vineyards were
being established, fewer posts were damaged and some non-wood products entered the
market. The distinction between grape sticks/horticultural posts and landscape/fencing
rounds was lost in 2010.
12Table 3. Estimations of roundwood for agriculture and landscape uses in Australia (After:
Dunn, 2011).
Australia Estimated Softwood Volume (m3)
2000 2007 2010
Grape sticks / Horticultural posts 125,803 270,000 249,000
Landscape and fencing rounds 177,361 215,000
Total 303,164 485,000 249,000
Dunn (2011) focused primarily on collecting information from experts in different areas of the
industry, including growers and building professionals. Estimations were made, while
historical and forecast trends were also discussed along with the challenges facing the
sector. The approach to use experts in the relevant fields was also adopted in the current
study.
Tan (2009) estimated the volume of wood used for wooden poles and cross arms in the New
Zealand electricity network at 4,634 m3 per year using a survey method. He discussed and
introduced the survey over the phone and also emailed excel spreadsheets to the relevant
persons for data input. A similar approach to data collection was taken in this study, with
surveys being a useful method to collect data from forest growers and treatment
organisations concerning the agricultural and horticultural treated wood markets. This is
described in detail in Chapter 4.
134. Data and methods of analysis
This research used three sources of data to produce independent estimates of the market
for treated wood for agricultural and horticultural uses:
1. a use per hectare estimate, based on expert knowledge of the specific end uses
2. a manufacturers’ estimate, from roundwood manufacturers and CCA treaters
3. a resource use estimate from a survey of forest growers
4.1. Use per hectare
The market size and subsequent annual demand of treated wood were estimated from the
typical use per hectare values for pastoral agriculture, vineyards, kiwifruit and apple
orchards. This entailed using the information on producing area in hectares for each system
from various sources. This data source was an approximation, with the relevant assumptions
noted throughout.
4.1.1. Pastoral agriculture
Sheep and beef, dairy, cropping and deer systems are the major farming systems in New
Zealand (Table 4).
Table 4. The producing area of the major farming systems in New Zealand in 2017 (After:
Beef + Lamb New Zealand, 2019).
Producing area (ha)
Sheep & Beef Farming Intensive 2,817,321
Sheep & Beef Farming Extensive 5,947,679
Dairying 2,442,000
Cropping 365,000
Deer Farming 261,000
This information was sourced from Beef + Lamb New Zealand (2019), who produced these
statistics in collaboration with Statistics New Zealand for 2017. The only adjustment made to
these values was the split of the 8,765,000 total sheep and beef producing hectares into
intensive and extensive farming based on the work of Morris (2013), who estimated that
32% of sheep and beef cattle farms are high country, 36% hill country and 32% flat to rolling
country. These distinctions were based on topography and elevation (Morris, 2013). For this
study, it was assumed that high and hill country were both extensive (68%) and flat to rolling
country was intensive (32%). These different producing hectares correspond to different
average paddock sizes (Figure 2).
14Figure 2. The assumptions of average paddock size, not to scale.
These assumptions were difficult, with paddock subdivision being highly variable, even
within districts with fairly uniform soils and farming systems. The sheep and beef average
paddock size for intensively farmed areas was determined using existing literature on the
subject. Typically, paddock sizes are determined using values such as forage mass and
animal weights among other factors (Rayburn, 1992). However, this was more applicable for
individual farms with a more general technique suitable in this instance. For sheep farming,
the suggested paddock size was 2 ha (“Sheep Grazing”, 2018), while beef farming is noted
to be quite similar (Glue, 1968). Therefore, to get these approximate estimates, an
assumption was made that the average paddock size was 2 ha for intensive sheep and beef
farming. The next assumption was that the average paddock for the majority of farms would
be rectangular. A 2:1 ratio is preferred because stock walk less in these types of paddocks,
minimising soil damage (Clarke, n.d.). These optimum dimensions were therefore assumed
to be the standard layout used in New Zealand. Consequently, using the common paddock
dimensions with a depth to width ratio of 2:1, the 20,000 m2 area has a perimeter of 200 m +
200 m + 100 m + 100 m = 600 m.
This assumption of a 2 ha average paddock size was appropriate for intensively farmed
sheep and beef land, but was not applicable for extensively farmed land. In consultation with
an expert in the field, it was determined that paddock sizes likely ranged from 10 to 60 ha,
with an average of 35 ha. The common paddock dimensions with a depth to width ratio of
2:1 have a perimeter of ~836 m + ~836 m + ~418 m + ~418 m = 2,508 m.
The average paddock size for dairy was assumed to be 1.6 ha. This assumption was
derived from Glue (1968) and Clarke (n.d.), with the latter noting the appropriateness of a
depth to width ratio of 2:1, particularly for cows. The perimeter of this standard dairy
paddock was determined as 180 m + 180 m + 90 m + 90 m = 540 m.
The average paddock size for crop farms was difficult to obtain, as there was little literature
available about arable farming setups. However, using information from a previous study of
30 farms with 430 paddocks (Mathers, 2014), an estimation of paddock size could be made.
An average paddock size for arable farming was assumed to be approximately 9 ha in size
15resulting in a perimeter of 300 m + 300 m + 300 m + 300 m = 1,200 m using equal sides,
with walking stock not being an issue.
The deer farming estimate was made using the same technique as the other estimates.
Paddock sizes for deer farming are typically large causing the deer to be more settled and
pressure the fence less (Tuckwell, 2003). Therefore, paddock sizes range from 4 to 5 ha
(Venison Advisory Service Ltd, 2016). The average value of 4.5 ha was used, with the
perimeter being 300 m + 300 m + 150 m + 150 m = 900 m, again assuming the previously
used 2:1 depth to width ratio.
An adjacency factor was calculated to account for the paddocks situated beside each other
sharing a fence line. Assumptions of average farm sizes were divided by average paddock
sizes to determine the number of paddocks for an average farm for each farming system
(Table 5). Farm and road infrastructure were also accounted for, allowing the theoretical
layouts of farms to be determined.
Table 5. The average farm sizes, average paddock sizes and the number of paddocks for an
average farm of the major farming systems in New Zealand (After: Beef + Lamb New
Zealand, 2019).
Average farm Average Number of
size (ha) paddock size paddocks for an
(ha) average farm
Sheep & Beef Farming Intensive 375 2 187
Sheep & Beef Farming Extensive 375 35 11
Dairying 220 1.6 138
Cropping 122 9 14
Deer Farming 333 4.5 74
As the following figures show, the theoretical layouts of the farms based on average values
were generalisations of actual farms in New Zealand. In reality, farm sizes vary markedly
with factors such as rivers, other farm infrastructure, additional roads and topography forcing
highly variable layouts. In this instance, these assumptions were necessary to account for
the paddock adjacency effect and the values and overall methods were verified by expert
consultants.
16Figure 3. Sheep and beef intensive paddock allowance, not to scale.
Figure 4. Sheep and beef extensive paddock allowance, not to scale.
17Figure 5. Dairy paddock allowance, not to scale.
Figure 6. Cropping paddock allowance, not to scale.
18Figure 7. Deer paddock allowance, not to scale.
Other assumptions which had to be made to obtain the volume of posts in the farming
systems were the average post spacing and the typical post dimensions. For sheep and
beef farming in New Zealand, wire and battens and post and wire fence types are utilised
with spacing ranging from 4 to 5 m and 2.5 to 5 m, respectively (Taratahi Agricultural
Training Centre, 2016). An average value of 4.5 m between posts was used for the
calculations.
Dairy farming in New Zealand utilises wire and battens and post and wire fence types
(Taratahi Agricultural Training Centre, 2016). The post spacing differs between these types
with wire and batten post spacing being 4 to 5 m and post and wire being 5 to 12 m. An
average of these values was calculated as 6.5 m between posts. For the cropping estimate,
fence posts can have wider spacing between them as no livestock needs to be contained
(Taratahi Agricultural Training Centre, 2016). In this case, 10 m spacing was assumed. For
deer farming, post spacing ranges from 5 to 6 m (Venison Advisory Service Ltd, 2016), so
an average of 5.5 m was assumed.
As there was little available information on typical post dimensions, some standard values
and calculations were used. Dairy farming, sheep and beef farming and crop farming all use
standard dimensions of posts (Taratahi Agricultural Training Centre, 2016). Therefore, a
standard length of 1.8 m for these three agricultural fence types and an average diameter of
round, half round and quarter round fence posts of 0.133 m was assumed. Assuming a
cylindrical product, a volume of 0.025 m3 for one post was determined. Deer farming has a
fence height of 1.95 m (Venison Advisory Service Ltd, 2016), while an additional 1 m is
19below ground. Assuming the same diameter of 0.133 m, the volume of one deer fence post
was 0.041 m3.
Figure 8 shows the step by step process of achieving the agricultural estimate, with different
values used for each of the farming systems.
Figure 8. Step by step process of the calculation process for the pastoral estimate of volume
of posts.
A replacement cycle of 25 years, corresponding to a replacement rate of 4% was
determined for agriculture based on expert consultant feedback. The expansion values were
determined based on historical growth for each of the farming systems based on data from
Beef + Lamb New Zealand (2018) and Beef + Lamb New Zealand (2019), in collaboration
with Statistics New Zealand. To determine the expansion, values from 2012 and 2017 were
compared, with the only increase present in dairy and crop farming. These values can be
seen in Appendix 2.
4.1.2. Vineyards
The New Zealand Winegrowers (2019) Vineyard Register Report provided data on the area
of wine producing land in twelve of the sixteen regions of New Zealand and provided
average sizes of vineyards, as seen in Appendix 3. Then, using the assumption that
vineyards utilise posts at 579 posts per hectare (Robinson et al., 2006), an estimate of posts
currently in vineyards could be determined. The volume was determined using the work of
Orton and Evison (2009), seen in Table 6.
20Table 6. The average volume of roundwood used by vineyards (Source: Orton & Evison,
2009).
The replacement rate was assumed to be 4% based on research by Robinson et al. (2006),
while expansion was projected at 474 ha in 2020 and 347 ha in 2021 (New Zealand
Winegrowers, 2019), with an average of 411 ha.
4.1.3. Kiwifruit
The kiwifruit sector estimation of posts per hectare needed to be determined, as no paper
had reported a specific value as was the case with vineyards. Conveniently, McAneney et al.
(1984) reported that the spacing for the T-bar configuration is 5.5 m between supporting
structures along rows spaced 5 m apart. However, the pergola configuration has been
favoured as it achieves greater yields and has replaced the T-bar configuration as the most
common kiwifruit structure (New Zealand Kiwifruit Growers, 2018). For that reason, an
average was determined from the values provided by Campbell and Haggerty (2008), which
was a range from 3 to 5 m for rows and 5 to 6 m spacing between rows. The average value
for the posts per hectare calculated was 455 posts per hectare. However, an industry expert
indicated that the value could be as high as 546 posts per hectare. An average value of 501
posts per hectare was therefore used.
Using the assumption for the usage of 501 CCA treated posts per hectare, the number of
posts used by the kiwifruit industry was estimated making use of the producing area
(Appendix 4) given by New Zealand Kiwifruit Growers (2018).
A combination of different sources was required to determine the volume per hectare value.
Strik and Cahn (2000) noted that the pergola system utilises 6-foot posts, which equals 1.83
m. A typical configuration for pergola systems can be seen in Figure 9.
21Figure 9. Pergola trellis system for growing kiwifruit (Source: Strik & Cahn, 2000).
Sale (1981) indicated that the posts used are 15 cm in diameter. Using the formula for the
volume of a cylinder and values of 0.075 m for radius and 2.8 m for length, a volume of
0.049 m3 was determined for one post. Assuming 501 posts per hectare, the volume per
hectare was 25 m3.
With no published replacement rate, industry experts were consulted, who indicated 0.5 to
1% per year was a fair assumption. This study assumed an annual replacement rate of
0.75%. Based on the historical growth in the industry, it can be expected that approximately
250 ha of land will become kiwifruit production per year (New Zealand Horticulture, 2017).
4.1.4. Apple
The apple industry estimate involved a consultation process with experts in the industry, as
there was very little publicly available information. These experts indicated that the industry
average for spacing of posts in rows is 3.5 m, with rows placed 9 m apart, resulting in 317
posts per hectare. New Zealand Apples and Pears (2019) estimated the industry at 10,819
ha, with the experts noting that approximately 25% of this area use these standard spacings,
equalling 2,547 ha. The rest of the industry is made up of mature apple trees, which do not
require supporting structures.
For the volume calculation, the standard industry height of 4.2 m posts with a diameter of 15
cm resulted in the estimation of one post with a volume of 0.073 m3 representing a volume
per hectare of 23 m3.
The experts estimated that the replacement cycle in the apple industry was 35 years or 3%
per year and expansion at 300 ha per year.
224.1.5. Organic sector
New Zealand Kiwifruit Growers (2018) reported that 165 kiwifruit orchards in New Zealand
were organic, representing 480 ha. Approximately 7% of New Zealand’s vineyard producing
area was organic (New Zealand Wine, 2016). Organics Aotearoa New Zealand (2018)
provided a value for the total organic livestock producing area in New Zealand which
referred to dairy as well as sheep and beef farming. These values were displayed in Table 7.
The same methods as those outlined above were employed to determine the number and
volume of posts.
Table 7. The organic area for vineyards, kiwifruit orchards and livestock farms in New
Zealand.
Organic area
(ha)
Vineyards 2,665
Kiwifruit 480
Livestock 64,278
Total 67,423
4.2. Manufacturers
An annual volume for agricultural and horticultural uses was determined by consulting CCA
treatment organisations. This method was conducted through phone calls and email
correspondence.
4.3. Forest growers
The estimate from forest growers was determined from a survey of forestry companies, with
several questions asked over the phone and through email correspondence. The main piece
of data requested was the annual volume of supply, while the log requirements in terms of
specifications related to the silvicultural prescription and the drivers of production were also
collected. Price ranges to compare with existing information and the established markets for
small-dimension logs were also collected. The survey sent to the forestry companies can be
seen in Appendix 5. Using the survey results of annual volume, a pro-rata approach was
utilised to estimate the market, as not all companies responded to survey requests.
235. Results and discussion
5.1. Use per hectare
5.1.1. Pastoral agriculture
The pastoral agriculture table shows the step by step process outlined in Figure 8.
Table 8. Values used for calculating the volume of posts for each of the farming systems
according to the procedure outlined in Figure 8.
Sheep & Beef Sheep & Beef Dairy Cropping Deer
Intensive Extensive
Producing area 2,817,321 5,947,679 2,442,000 365,000 261,000
(ha)
Average 2 35 1.6 9 4.5
paddock size
(ha)
Number of 1,408,661 169,934 1,526,250 40,556 58,000
paddocks
Perimeter of 600 2,508 540 1,200 900
average
paddock (m)
Adjacency 46% 38% 45% 32% 43%
factor
Total perimeter 455,743,173 264,240,065 450,907,337 33,023,810 29,744,595
(m)
Average post 4.5 4.5 6.5 10 5.5
spacing (m)
Number of 101,276,261 58,720,014 69,370,360 3,302,381 5,408,108
posts
Typical post 0.025 0.025 0.025 0.025 0.041
dimensions
(m3)
Volume in m3 2,531,907 1,468,000 1,734,259 82,560 221,732
245.1.2. Total size and annual market demand
The use per hectare method estimates for the vineyard, kiwifruit, apple and pastoral sectors
were displayed in Table 9.
Table 9. Total volume of posts for the different sectors.
Volume (m3)
Vineyard 506,752
Kiwifruit 311,265
Apple 58,946
Pastoral 6,038,458
Total 6,915,421
The pastoral systems accounted for 87% of the total volume of approximately 6.9 million m3.
Vineyards was next largest at 7%, while the kiwifruit and apple industries were smaller at 5%
and 1%, respectively. Of the horticultural sector, vineyards made up 58% of the
approximately 880,000 m3 and kiwifruit orchards accounted for 35%.
Annual market demand was determined based on expansion and replacement rates of the
different sectors. These were displayed in Table 10.
Table 10. Annual market demand volume estimations.
Replacement Expansion Replacement Expansion Total (m3
rate (per year) (ha per year) (m3 per year) (m3 per year) per year)
Vineyards 4% 411 20,270 5,464 25,734
Kiwifruit 0.75% 250 2,334 6,131 8,466
Apple 3% 300 1,684 6,942 8,626
Pastoral 4% 21,600 241,538 7,499 249,038
Total 265,827 26,036 291,863
The data highlights that pastoral farming and vineyards were the major contributors to the
total annual market demand. Annual replacement accounts for 91% of the annual volume,
with most of this from the pastoral sectors. The number to note here is the ~290,000 m3 per
year of posts used in the agricultural and horticultural industries.
255.1.3. Organic sector
The organic sector total volume was estimated for vineyards, kiwifruit orchards and livestock
farms (Table 11).
Table 11. The organic sector volume of posts for vineyards, kiwifruit orchards and livestock
farms in New Zealand.
Type Volume (m3)
Vineyards 35,471
Kiwifruit 7,688
Livestock 92,521
Total 135,680
Based on the expansion and replacement rates of the total sectors, the organic sector
consumption of treated wood each year was estimated (Table 12).
Table 12. Estimated annual market demand of posts for the organic sector based on
replacement and expansion rates of the overall sectors.
Replacement Expansion Total (m3
(m3 per year) (m3 per year) per year)
Vineyards 1,419 382 1,801
Kiwifruit 58 151 209
Livestock 3,701 116 3,817
Total 5,177 649 5,826
Organic livestock accounted for 66% of the total estimate of almost 6,000 m3 per year, while
vineyards were 31%. Almost 90% of the total was from replacement of posts. It must be
noted that the organic expansion was based on that of the total area. Therefore, the
numbers presented are a more conservative approach. Organics Aotearoa New Zealand
(2018) reported larger expansion figures reflecting an overall trend to shift to organic
farming. These were presented in Table 13, with average annual expansion rates for
horticulture of 4% and livestock of 8%.
Table 13. Estimated annual market demand of posts for the organic sector based on
increasing popularity of organic farming.
Replacement Expansion Total (m3
(m3 per year) (m3 per year) per year)
Vineyards 1,419 1,368 2,787
Kiwifruit 58 297 354
Livestock 3,701 7,446 11,147
Total 5,177 9,110 14,288
The total annual volume of approximately 14,000 m3 per year was notably more than the
6,000 m3 per year conservative estimate. These values are relevant for the NZDFI eucalypt
26species which have good properties such as hardness and natural durability (Grealy, 2008).
This wood is suitable in moderate to high decaying situations for applications such as fence
posts (Page & Singh, 2014). The wine growing industry has reported its frustration with
treated posts, highlighting issues such as breakage and hazardous waste as major
drawbacks of CCA treated radiata pine timber. The organic winegrowers have also
expressed their concern with treated posts and accept durable eucalypts as a viable
alternative (Millen et al., 2018b). Eucalypt species appear to be a good alternative to CCA
treated radiata pine and other preservative treatments (Apiolaza et al., 2011). The annual
demand of between 6,000 m3 (Table 12) and 14,000 m3 (Table 13) for the organic sectors is
therefore relevant for the NZDFI.
5.1.4. CCA liability
CCA treated wood cannot be burned and is instead disposed of in secure landfills, well-
controlled incineration facilities or is stored at the end of its service life. Considering that
there may be 6.9 million m3 (Table 9) of CCA treated timber existing currently in agricultural
and horticultural systems, disposal methods are pertinent. For instance, in the Marlborough
region, which is New Zealand’s largest wine region accounting for two thirds of the wine
growing in New Zealand (New Zealand Winegrowers, 2019), this issue is being addressed
by the Marlborough District Council. McNeil, a Council solid waste manager stated that the
region sent 8,000 tonnes of treated and untreated timber to landfill each year (Mcphee,
2016). A hi-tech timber recycling plant is proposed, turning both treated and untreated timber
into a charcoal product which is to be processed and sold locally or overseas as carbon
black. The Council estimates that this will bring in approximately $90,000 per year. However,
there has been some negative response to the proposal, with 105 people or organisations
submitting against the resource consent. This includes the Nelson Marlborough Public
Health Service and an environmental health agency, with the issue being the proposed
location in very close proximity to homes and vineyards (Eder, 2018).
Vogeler et al. (2005) indicated that long term management options of CCA treated timber
must be explored. This also relates to product stewardship helping reduce the impact of
manufactured products on the environment by having a circular economy (Ministry for the
Environment, 2018). The significant liability of CCA treated wood may require Government
policy. Interestingly, the use of CCA treated wood in New Zealand is expected to continue to
increase because of land intensification (Millen et al., 2018b). Overseas, CCA manufacture
is being more heavily regulated by national and international standards such as AWPA P23-
10 for the United States of America and SANS 673 for South Africa (Millen et al., 2009). This
has seen a transition from CCA to other preservatives such as alkaline copper quaternary
and copper azole (Dunn, 2011). But, these are likely not long-term solutions as they are less
effective and there has been some consumer resistance to the use of chemical wood
preservatives.
275.1.5. Alternatives to treated wood
Treated wood is the predominant product in the agricultural and horticultural markets.
Alternatives to treated posts are steel, concrete, aluminium and plastic posts. Little data
exists around these alternatives, but experts indicate that these products make up a
relatively small percentage of the products in these industries. Wood is a more
environmentally friendly product in terms of carbon dioxide emissions compared to steel,
concrete, aluminium and plastic (Grealy, 2008), so has been preferred.
Figure 10. Carbon Dioxide released during the manufacture of one kilogram of the different
materials (Source: Grealy, 2008).
5.2. Manufacturers
Two organisations of CCA treated post manufacturers were surveyed for production data.
The New Zealand Timber Preservation Council Inc estimated that the annual treated
roundwood production for horticultural and agricultural uses is approximately 310,000 m3,
made up of:
§ H4: 300,000 m3
§ H5:5.3. Forest growers
5.3.1. Pro-rata approach
Surveys were sent to sixteen forestry companies across the regions of New Zealand and
eleven responded. This survey method accounted for 53% of the total plantation forest area,
although a targeted approach of forestry companies likely to produce roundwood was
employed. A pro-rata approach was used to account for the non-responders (Ehrlich, 1985).
Volume of wood for agricultural and horticultural uses in m3 was provided in the survey
responses, while hectare values were sourced from Forest Owners Association (2018) and
survey responders. These values were graphed and a linear line was plotted (Figure 11).
The R2 value for the relationship between roundwood volume and number of hectares was
relatively low at 0.32, indicating that there is a small positive linear association.
90,000
Volumeof wood for agricultural and
80,000
70,000
horticultural uses (m3)
60,000
y = 0.224x + 4062
50,000 R² = 0.3169
40,000
30,000
20,000
10,000
0
0 20,000 40,000 60,000 80,000 100,000 120,000 140,000 160,000 180,000 200,000
Forest estate area (ha)
Figure 11. Scatterplot of hectares and volumes from forest grower survey responders for the
pro-rata approach.
1,725,476 ha is the net stocked plantation forest area in New Zealand (Forest Owners
Association, 2018) and was inputted into the following equation:
y = 0.224x + 4062
Where:
y is the volume of posts (m3)
x is the forest estate area (ha)
This resulted in an estimate of 390,569 m3 of wood for posts per year, although not all of this
will end up in the agricultural and horticultural industries.
295.4. Comparison
The estimates from the use per hectare method, the manufacturers’ method and resource
use method were relatively similar. This gives confidence in the results of the study.
Table 14. Comparison of the three methods for estimating the agricultural and horticultural
annual treated wood market.
Volume (m3 per year)
Use per hectare estimate ~290,000
Manufacturers' estimate ~270,000 to ~310,000
Resource use estimate ~390,000
The use per hectare estimate was likely an overestimation as non-wood products such as
those mentioned in the alternatives to treated wood section could not be accounted for.
However, experts indicate that these products would only represent a small proportion of the
market, so were not significant. This method also makes the most assumptions. The
resource use estimate is also likely an overestimation, as forest growers indicated that logs
could be used for house piles, pulp logs, saw logs and so forth. Differentiation between
these products and the agricultural and horticultural products of interest were not possible.
Therefore, the conversion of logs to posts is not 100%, with this study estimating a
conversion rate of approximately 74% based on the average of the manufacturers’ estimate
of ~290,000 m3 per year and the resource use estimate of ~390,000 m3 per year.
The postwood is likely contained in the small log volume of approximately 1.3 million m3
removed from plantation forests each year (MPI, 2018), shown in Appendix 6. Using FAO
production data, an estimate of ‘other industrial roundwood’ production was made by MPI
(2014) (Table 15).
Table 15. Assumed ‘other industrial roundwood’ production (Source: MPI, 2014).
This estimate was in the order of the three estimates of this study. The numbers were
identical from 1992 to 1999 at 320,000 m3 and identical from 2001 to 2011 at 400,000 m3.
‘Other industrial roundwood’ also contains products outside of the agricultural and
30horticultural products targeted in this study, as previously mentioned. Carpenter (1994)
estimated 312,000 m3 per year of treated posts and poles in 1986 which is relatively similar
to this study’s annual market estimate.
Literature based on similar data and methods corresponds with the findings of this study. For
instance, the vineyard post replacement of approximately 22,000 m3 per year (Orton &
Evison, 2009) is very close to the value provided by Millen et al. (2009) of 24,000 m3 per
year. This also correlates with this study’s estimate of 20,270 m3 being replaced annually at
a replacement rate of 4% (Robinson et al., 2006). As such, this indicates that the estimate of
the total number of posts in vineyards of approximately 22 million is relatively accurate as
4% of this value is 880,000 posts, very close to the replacement rate of 900,000 posts per
year produced by Millen et al. (2009).
5.5. Log specifications and postwood log market
The survey queried the log specifications for post manufacturing. These varied between
companies, with the response ranges shown (Table 16).
Table 16. The main specifications as indicated by forest grower surveys.
Product description Length (m) Small end Other
diameter (cm)
Small industrial log 3.6 to 14 6 to 28 Knot sizethinning had slowed because the volume is typically not high enough to meet roundwood
orders and production thinning viability. Approximately half of the responders indicated that
they had long term contracts with manufacturers for the supply of logs. One company noted
that they had long standing agreements with several manufacturers, but the actual volume
that they get depends on the availability from blocks they are clearfelling and the
manufacturers demand. The former refers to material coming mostly from blocks that have a
reasonably tight stocking, with the company noting that the majority of their pruned blocks do
not produce this type of material. The company noted that the majority of the time the
demand outweighs the supply. A few companies stated that although they did not have long
term supply contracts, they did have long term supply relationships with manufacturers. The
contracts are standard quarterly sale and purchase agreements whereby product,
specification, volume and price are negotiated quarterly. One company noted a supply
contract period of more than five years, with a roundwood manufacturing plant being in close
vicinity to its forests. A forestry management company stated that they had no long-term
contracts with manufacturers as they focus more on getting the best value for their forest
growers. Another company noted that the supply and contract were dependent on the timing
of their thinning program.
Responders were also asked to indicate the markets that exist for small dimension logs. All
responders noted both the export and domestic pulp markets, while some noted chipwood,
biofuel and firewood as markets. One company also noted small dimension logs being used
for packaging and furniture. Another company indicated that logs could be peeled for
plywood, while most also indicated small sawlogs for export. Interestingly, only two
companies indicated the agricultural and horticultural markets.
The companies that do not supply roundwood typically find that the specifications for KIS
grade export logs are easier to meet than the specifications for roundwood with the premium
for cutting roundwood not justifying the additional handling by crews. Furthermore, with high
export prices in recent times, areas close to the port generally do not cut roundwood. As
Table 17 confirms, the lower quality KIS grade averaged approximately $80 per tonne and
the higher quality K grade averaged almost $99 per tonne.
Table 17. Wharfgate log price range delivered to wharf (Source: AgriHQ, 2020).
$/t K KIS
North Island 101 - 104 82 -85
South Island 94 - 95 75 - 77
Some of these companies noted higher logging rates had to be paid to crews for them to
produce roundwood. The roundwood specifications are quite strict, with some companies
struggling to meet the requirements. The attractive export prices provide a clear indication
as to why not all companies supply the market. One company stated that they have trees
with high taper that are pruned. Anecdotally, they found that the larger piece sizes from
pruned stands create more breakage at the top of the tree, resulting in less roundwood
being recovered.
32All of the companies supplying roundwood used radiata pine, with one company indicating
that they were trialling Eucalyptus botryoides and Eucalyptus saligna for vineyards who did
not want treated wood. They indicated that there was a potential market in that area.
Based on the survey responses, the majority of the roundwood volume was concentrated in
Northland, the Central North Island (CNI) and Nelson. This is logical considering these areas
typically have less taper, smaller branches and low to moderate soil fertility (New Zealand
Soil Bureau, 1968; Rigg, 1954; Roberts et al., 1996). These findings align with the work
done regarding post and pole regimes, particularly the regional variability (Cown &
McConchie, 1982).
Reflecting on the comments by Spinelli et al. (2018) who noted that companies can
significantly increase the value of their small logs if they sell them as posts for agricultural
and horticultural uses, the findings here do not align exactly. Spinelli et al. (2018)
investigated durable chestnut wood which is likely the cause of the difference. The
statement may be relevant to companies in the regions mentioned above, with other
companies favouring K grade and pulp export grades. Roundwood is, therefore, more
important in those regions and of lesser importance in other areas, specifically those close to
ports.
5.6. The supply chain for treated roundwood
According to experts, the typical flow of the products of interest for agricultural and
horticultural uses is shown in Figure 12. From the forest, the next stage is either the post
processor/treatment plant or a post processor alone. Licensing and certification are required
when using treatment chemicals, with this leading to the different pathways observed.
Finished products either go via a retailer or directly to the customer.
Figure 12. Flowchart of agricultural and horticultural products from the forest to the
customer.
336. Areas for further study
There are certain aspects of this topic that deserve further research. A more thorough review
of post manufacturers regarding their connection with forest growers is necessary.
Specifically, the price differential and log specifications. The NZDFI should expand on the
work presented here with a feasibility study regarding the agricultural and horticultural
markets for naturally durable wood. This work could involve estimating the area required for
eucalypt plantations, specific regimes and post performance. More accurate estimates may
be possible if future studies can account for alternative post products and get more succinct
data from the surveys of forest growers. Future studies should verify the impact of farm
riparian area fencing on the estimates. It would also be relevant to further explore the
expansion of the organic and horticultural sectors, potentially through surveys of these
industries. Further work should be completed regarding the disposal methods of the CCA
treated wood, with policy potentially necessary to regulate this.
347. Conclusion
The treated wood market for agricultural and horticultural uses in NZ has been analysed
using three independent methods to estimate the size of the market. These three methods
were a use per hectare estimate, a manufacturers’ estimate and a resource use estimate.
The use per hectare method estimated a total of approximately 6.9 million m3 of CCA treated
wood currently in use in the agricultural and horticultural industries. Annual market demand
was determined using sector expansion figures and replacement rates, determining
approximately 290,000 m3 per year of CCA treated wood used in these industries.
Consulting two independent CCA organisations provided estimates of approximately
310,000 m3 per year and 270,000 m3 to 300,000 m3 per year. The resource use estimate of
approximately 390,000 m3 per year was based on forest grower surveys. The values are
reasonably similar. This increases the confidence that the size of the market is between
approximately 270,000 m3 to 390,000 m3 per year. However, the use per hectare estimate
may be a slight overestimation, as this study was unable to account for the non-wood
products such as plastic and metal posts. Although, this is not of utmost importance, as
experts indicate that non-wood products likely only make up a small proportion of the total
market. This method may also be the least precise due to the numerous assumptions
involved. The resource use estimate is also likely an overestimation, as the surveys by forest
growers indicated that house piles, pulp logs, saw logs and even in some instances,
firewood volumes were included, with differentiation between these products not possible.
Manufacturing losses also account for the overestimation. A more rational estimate of the
market is therefore between approximately 270,000 m3 to 310,000 m3 per year.
An estimate of approximately 6,000 m3 to 14,000 m3 per year was made for the organic
sector, although the former involves a more conservative expansion rate. These values
present the opportunity for the NZDFI alternative eucalypt products, as CCA treated wood is
banned in organic systems for replacement and expansion. Future work should involve a
feasibility analysis on this specific area of the market.
Based on the forest grower surveys, it was determined that export pulp and K grades were
the main competitors for agricultural and horticultural products. This was especially the case
for forests near ports, who indicated that the pulp grades were much easier to meet. The
requirements for roundwood products are reasonably strict and sometimes the prices do not
justify the more difficult log processing. From the forest grower surveys it was also found that
the majority of roundwood producers are concentrated in the Nelson, CNI and Northland
regions of NZ. This is logical considering these areas are of low fertility and typically produce
trees with less taper and smaller branches, benefiting the post manufacturers.
The approximately 6.9 million m3 of CCA treated wood currently present in the agricultural
and horticultural industries presents a significant CCA liability. Proposals such as the
Marlborough District Council funded pyrolysis timber recycling plant may be necessary for
other parts of NZ. Future policy regarding the disposal of this wood may also be necessary,
with further work in this area justified.
35You can also read