BATTERY STORAGE IN NEW ZEALAND - Regulatory Indicators for ...

Page created by Jim Newman
 
CONTINUE READING
BATTERY STORAGE IN NEW ZEALAND - Regulatory Indicators for ...
B AT T E R Y S T O R AG E
  IN NEW ZEALAND
       DISCUSSION DOCUMENT
             SEPTEMBER 2017
BATTERY STORAGE IN NEW ZEALAND - Regulatory Indicators for ...
CONTENTS

01                       12                     30
SUMMARY                  CASE STUDIES           COMPARING
                                                BATTERY
                         1.0 Generation site    VALUE AND

03
                                                LOCATION
                         2.0 Transpower
                             substation site
CONTEXT

                                                32
                         3.0 Distribution
New Zealand’s                substation site
renewable electricity                           COMBINING
                         3.1 Wellington
system                                          BATTERIES FOR
                             Electricity
                             substation site    VALUE
Consumer
participation in the
                         4.0 Commercial/
electricity market
                             Industrial site

                         4.1 North Island
                                                34
05                           Supermarket site

                         5.0 Residential site
                                                FINDINGS

GETTING VALUE
FROM
BATTERIES IN                                    38
NEW ZEALAND                                     CONCLUSION

Services batteries can
provide

Determining potential                           APPENDICES
value from battery
                                                Technical Appendices – available at
services
                                                www.transpower.co.nz/battery-storage
Revenue from
providing battery
services

Costs
BATTERY STORAGE IN NEW ZEALAND - Regulatory Indicators for ...
BATTERY STORAGE
IN NEW ZEALAND

      SUMMARY
       Transpower operates at the very     Electricity is a convenient means of transferring and using energy. In New
                                           Zealand, our hydro lakes store energy on a large scale. However, until now we
       heart of New Zealand’s economy,
                                           have had limited options to store electricity cost-effectively close to where it is
       providing connections that power    used.
       our way of life. Our two roles as   Around the world, battery technology now offers opportunities to store electricity
       grid owner and system operator      economically, close to where it is used. It can also store local sources of
                                           generation, such as rooftop solar, and smooth out the impacts that variable
       are interdependent and both are
                                           generation can have on the power system. Widespread, distributed storage could,
       essential for the power system to   and most probably will, fundamentally change the way that power systems will be
       operate successfully. We work       operated in the future.

       with generators, distributors,      Long-term, we expect that battery or other storage technologies installed in
                                           homes, businesses, vehicles, distribution networks and grid substations could
       retailers and technology            alter our transmission business by covering short-term imbalances in supply and
       providers to power Kiwi homes       demand. We will be able to operate the power system differently, having more
       and businesses.                     flexibility to schedule energy transfers and grid outages to optimise the use of the
                                           grid, grid generation and distributed energy resources. We explore these future
                                           possibilities in depth in our perspective document, Transmission Tomorrow.
                                           Despite these changes, the services that the national grid provides will be
                                           enduring. New Zealand’s remotely located renewable generation will continue to
                                           be an economic, low-carbon electricity source. Our focus on resilience will
                                           continue to deliver essential services to New Zealand communities, households
                                           and businesses.
                                           As a critical infrastructure provider, these expectations need to be incorporated
                                           into our investment decisions over the short and long term. Developing a realistic
                                           view of the future will ensure we continue to provide attractive, cost-effective
                                           services that meet our customers’ changing needs.
                                           We considered hosting our own trial of grid-connected battery storage, but first we
                                           chose to investigate the benefits of battery storage across the electricity supply
                                           chain. We did this by investigating the costs, benefits, regulatory, technical and
                                           commercial implications of battery storage located in different regions of New
                                           Zealand and at each point in the electricity supply chain. We developed various
                                           applications for battery storage and considered how these could also provide the
                                           services that are required to operate the electricity system. These applications
                                           were applied to separate case studies which were evaluated for a range of high-
                                           level assumptions using a range of industry metrics.

                                                                                              TRANSPOWER NEW ZEALAND LIMITED      1
BATTERY STORAGE IN NEW ZEALAND - Regulatory Indicators for ...
BATTERY STORAGE
IN NEW ZEALAND

Our key findings
   1. Batteries offer greater value when they are located closer to the end consumer, where there is
      the potential to provide a range of services both for the owner directly, and upstream to the
      whole network.
   2. The value of these services is unlikely to be realised by the consumer until the appropriate
      market pricing and payment structures, systems and tools are available.
   3. The value of each service at different places in the electricity supply chain varies widely across
      the country and within individual networks.
   4. Grid-connected batteries are not presently economic and we consider these are unlikely to be
      so before 2022.
   5. Distribution-connected or community-scale batteries are expected to be economic from 2020.
   6. Some specific commercial or industrial end-consumer battery applications are economic now.
      The case for these would be further strengthened if Time-of-Use lines charging, combined
      with full open access to all market energy services, were available.

                            Where to from here?
                            Our assessment is that due to the potential for greater revenues and the likelihood of more
                            constraints arising, projects near load centres in the Upper North Island will offer the highest
                            value. Further, we consider that this value increases the closer it is located to end-consumers.
                            Projects at distribution substations or at a consumer level are forecast to be economic in the next
                            few years, due to the falling cost of battery systems.
                            We do not plan to carry out our own large-scale trials with batteries on the national grid. Instead we
                            will seek opportunities to work with and learn from others by contributing to joint projects where
                            appropriate.
                            We will also encourage industry changes, such as market reforms, that allow battery owners to
                            maximise the value they can get from owning a battery.
                            Through our demand response programme, we will continue to engage with early adopters in this
                            space to accelerate the benefits of distributed storage.
                            The findings from our investigation will continue to help us and the wider industry better
                            understand and prepare for the opportunities and challenges ahead.

                            Engage with us
                            Battery storage is only one part of the technology equation. Later this year, we aim to publish a
                            companion report exploring the opportunities and challenges of solar electricity generation.
                            We hope these papers will contribute to ongoing conversation and development in the electricity
                            industry, and we welcome opportunities to discuss them with you.

                                                                                                  TRANSPOWER NEW ZEALAND LIMITED     2
BATTERY STORAGE
IN NEW ZEALAND

                  CONTEXT

                  New Zealand’s renewable electricity system          Figure 1
                                                                      NEW
                                                                       Figure 1ZEALAND ELECTRICITY SYSTEM
                  Electricity makes up around one quarter of all       NEW ZEALAND ELECTRICITY
                                                                      GENERATION     CAPACITYSYSTEM
                                                                                               MIX GENERATION CAPACITY MIX
                  energy used in New Zealand. It is mostly
                                                                                                      Solar
                  generated from renewable hydro (58%),
                                                                                                    0.07%
                  geothermal (11%) and wind (8%) sources,
                                                                             Thermal
                  located far from major demand centres. Total
                                                                             23%
                  installed generation is approximately 9500MW
                  and produces approximately 42,000GWhr
                  (151PJ) of electricity each year. Thermal
                  generation (23%) presently has an installed
                  capacity of approximately 1800MW, and we note       Wind

                  that during the last three years approximately      8%                                         Hydro

                  1000MW of additional thermal generation has                                                   58%
                  been decommissioned due to market forces.             Geothermal

                                                                         11%
                  Solar generation (0.07%) mostly comprises
                  distributed rooftop installations, with a total
                  capacity of approximately 50MW. Due to our
                  large base of renewables no explicit subsidies or
                  feed-in tariffs have been developed to encourage
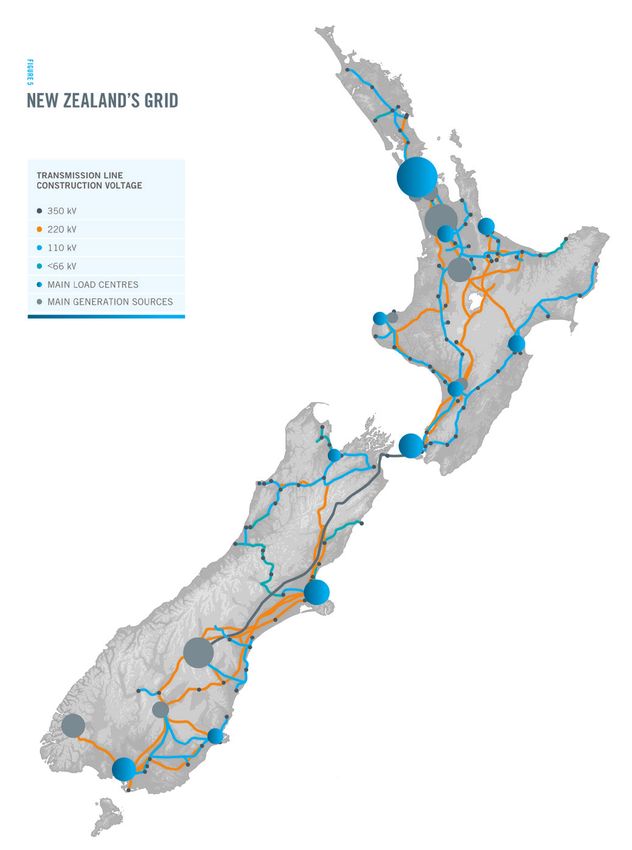
                  renewable wind or solar PV installations.           Figure 2
                  Our national transmission system operates a core    NEW ZEALAND LOAD AND
                                                                      GENERATION LOCATION
                  backbone of 220 kV and 110kV lines and a high
                  voltage direct current (HVDC) link between the
                                                                         350 kV
                  North and South Islands connecting these
                                                                         220 kV
                  renewable generation sources with electricity
                                                                         110 kV
                  users across the country. Our arrangement and
BATTERY STORAGE
IN NEW ZEALAND

Consumer participation in the electricity market
At present, New Zealand electricity consumers have limited ability to
participate in their electricity market. New technologies and platforms,
integrated into the electricity system, would enable electricity consumers to
offer their storage as a resource to others in the system.
Various electricity industry participants have recognised the potential for new
technologies to change the sector, and are actively investigating or trialling
these at both consumer and distribution level.
In addition to the technical issues, the industry is currently looking at different
ways to price services so consumers have the right incentives to use electricity
in ways that will reduce their power costs immediately and deliver value for
the whole community in the longer term.
Although tools such as peer-to-peer trading and demand response
programmes for residential consumers show signs of future potential, many
battery services cannot presently be monetised, and developing ways to do
this will increase options to realise value for end-consumer battery owners.
The outcomes of these pricing changes and any subsequent market design
and Electricity Code changes may alter the way transmission and distribution
services are delivered and charged, and how consumers are enabled to
participate in the market.

                                                                                      TRANSPOWER NEW ZEALAND LIMITED   4
BATTERY STORAGE
IN NEW ZEALAND

        GETTING VALUE
        FROM BATTERIES                                                                                                                              EXECUTIVE SUMMARY

        IN NEW ZEALAND     2. Where on the grid can batteries                                      storage can technically provide the largest number
                              deliver each service?                                                of services to the electricity grid at large (see Figure
                                                                                                   ES2)—even if storage deployed behind the meter
                           The further downstream battery-based energy storage                     is not always the least-cost option. Furthermore,
         Services batteries can
                      systems areprovide
                                 located on the electricity system, the more                       customer-sited storage is optimally located to provide
                           services they can offer to the system at large.                         perhaps the most important energy storage service
         International research1 identifies 13 services that batteries can                         of all: backup power. Accordingly, regulators, utilities,
         provide to the Energy
                        electricity system.
                               storage can be sited at three different levels:                     and developers should look as far downstream in
                    behind the meter, at the distribution level, or at the                         the electricity system as possible when examining
                    transmission level. Energy storage deployed at all levels                      the economics of energy storage and analyze how
         Figure 3
                    on the electricity system can add value to the grid.                           those economics change depending on where energy
         RMI BATTERYHowever,
                     SERVICES      DIAGRAMbehind-the-meter energy
                              customer-sited,                                                      storage is deployed on the grid.

                           FIGURE ES2
                           BATTERIES CAN PROVIDE
                           UP TO 13 SERVICES TO THREE
                           STAKEHOLDER GROUPS

                                                                                                     Energy
                                                                           Backup Power             Arbitrage
                                                                                                                         Spin /
                                                                                                                        Non-Spin
                                                ES

                                                         Increased                                                      Reserve
                                               IC

                                                          PV Self-
                                                                                                                                            IS

                                                        Consumption
                                           RV

                                                                                                                                                O
                                                                                                                                                  /R
                                          SE

                                                                                                                                   Frequency
                                                                                                                                   Regulation
                                                                                                                                                     TO
                                      ER

                                                                                                                                                     SER
                                     OM
                                   CUST

                                             Demand
                                                                                                                                                          VICES

                                                                      Service not
                                             Charge
                                            Reduction                  possible                                                          Voltage
                                                                                                                                         Support
                                                                                    Service not
                                                                                     possible

                                          Time-of-Use                                                                                     Black
                                              Bill                                                                                        Start
                                          Management                                                                                                 CENTRALIZED

                                                                                                                                                           TRANSMISSION

                                                     Distribution                                                          Resource                        DISTRIBUTION
                                                      Deferral                                                             Adequacy
                                                                                                                                                     BEHIND THE METER

                                                                          Transmission                Transmission
                                                                            Deferral                Congestion Relief

                                                                                                                                                     DISTRIBUTED
                                                                                    U TI LIT Y S E R V I C E S

1
    In particular, we relied on the USA-based Rocky Mountain Institute’s paper
    The Economics of Battery Energy Storage (2015).
    http://www.rmi.org/electricity_battery_value

                                                                                                                                      TRANSPOWER NEW ZEALAND LIMITED      5
BATTERY STORAGE
IN NEW ZEALAND

These comprise four fundamental categories:                        Determining potential value from battery services
„„   Back-up power supply – keep the power on when there is        The value of each of the battery services listed above varies by
     an interruption in electricity supply.                        region, location in the electricity supply chain, and demand.
        Black start                                                This is a result of both market-based revenues driven by supply
                                                                   and demand (particularly seasonal hydrology, growth, weather
        Back-up power
                                                                   and plant availability) and non-market based costs driven by
„„   Moving energy – store energy when it is abundant (and         spare capacity across transmission and distribution networks.
     cheap) for use or sale when supply is tighter (and more
                                                                   The high-level analysis for the value each of these services can
     expensive).
                                                                   provide is assessed for different geographic locations in the
        Energy arbitrage                                           country and different positions within the electricity supply
        Time of use bill management                                chain. We apply these values to a series of case studies later in
        Increased solar PV self-consumption                        this report.

„„   Manage capacity – reduce demand during peak times, so         The figures and tables below provide:
     that less distribution, transmission or generation capacity   „„   the assumptions about market prices that we used to
     is needed.                                                         determine potential battery value;
        Demand charge reduction                                    „„   a summary of potential battery value for each service; and
        Transmission congestion relief                             „„   a summary of potential benefit for each place in the
        Transmission deferral                                           electricity supply chain.
        Distribution deferral                                      We emphasise that the values given are based on a range of
„„   Stabilise the power system – help even out variations,        present market conditions, historical trends, industry
     restore balance, or improve voltage.                          disclosures and current pricing structures. Deriving revenue
                                                                   from long-term historical trends is not necessarily a predictor
        Frequency Keeping
                                                                   for the future, but it does provide a starting point. The services
        Instantaneous Reserves                                     are not necessarily additive, or realisable in all locations. They
        Resource Adequacy                                          represent today’s market, and do not consider the possible
                                                                   effect that increased storage options could have on market
        Voltage support
                                                                   prices. In this report, we consider battery owners as ‘price
                                                                   takers’ who maximise potential revenue against prevailing
Most research on this topic reflects international experience
                                                                   market prices.
with different industry regulations, structures, demand
patterns, generation mixes, and environmental and policy           For the full data around our assumptions and value modelling,
obligations than are present in New Zealand. To understand         see Appendix 1.
how owners can get value from batteries here, we have
analysed the services above and applied them to the New
Zealand context.

                                                                                                  TRANSPOWER NEW ZEALAND LIMITED        6
BATTERY STORAGE
IN NEW ZEALAND

Table 1
ASSUMPTIONS ABOUT MARKET PRICES FOR POTENTIAL BATTERY SERVICE VALUE

    SERVICES                                        ASSUMPTIONS

    Energy arbitrage                                We analysed daily spot price data over a seven-year period (to account for hydrological
                                                    variations) to calculate an average daily “off-peak” to “peak” market price for each major
                                                    transmission network region. This difference ranges from ~$15-20/MWh in the South Island
                                                    to ~$30/MWh in the North Island. We used these values in the case studies for batteries
                                                    located at generation and transmission network sites; in the commercial/industrial sector we
                                                    used a typical TOU tariff to determine arbitrage values.

    Spin/non-spin reserves                          We based our assumptions on 2016-17 year-to-date trends, because our procurement costs
                                                    have significantly reduced since the upgrades to our HVDC and the introduction of a national
                                                    Reserves market and multi Frequency Keeping in 2016. The reserve cost is assumed at
                                                    approximately ~$6/MWh in the North Island and ~$3/MWh in the South Island.

    Frequency regulation                            We based our assumption on the 2016 average of ~$12/MWh in the North Island and $14/
                                                    MWh in the South Island. This service is capped at 15MW per Island.

    Voltage support                                 We based this value on equivalent Statcom carry costs of ~$40k/KVA/pa, assuming dynamic
                                                    reactive support is required. This can be considered an upper bound, acknowledging that
                                                    voltage support can also be provided from other potentially lower cost options such as
                                                    capacitors and synchronous condensers.

    Black start                                     We consider that there are limited opportunities for batteries to receive revenue for black start
                                                    services. The total cost for this service each year is ~ $600k, currently spread across four
                                                    providers, so we assume $50k pa fixed at generation site only.

    Resource adequacy                               In a capacity market, this is typically valued as the annual carrying cost of an open cycle gas
                                                    turbine (OCGT) plus fixed O&M costs.2 However, given that batteries do not provide the same
                                                    sustained energy as an OCGT, this is discounted to ~$100/kW/pa to take a conservative
                                                    approach.
                                                    We acknowledge there an expected additional upside to battery storage, from the faster
                                                    response and lower operational cost (avoided start-up and low load running).

2
     OCGT annual carry cost is ~$150-170/kW/year.

                                                                                                                 TRANSPOWER NEW ZEALAND LIMITED         7
BATTERY STORAGE
IN NEW ZEALAND

    SERVICES                                         ASSUMPTIONS

    Transmission deferral                            The cost of transmission deferral covers a range from both short to long term.
    (transmission congestion relief)                 We used our Demand Response Programme3 trial payments as an estimate for short-term
                                                     substitute for transmission deferral. For long term deferral we used a significant proportion of
                                                     the capital component of the HVAC interconnection charge.
                                                     We have therefore assumed a LRMC value for transmission deferral for this report to be in
                                                     the range $30-$80/kW/pa.
                                                     If transmission upgrades can be deferred or avoided by a battery, then it is assumed the
                                                     owner will receive payments of similar value via either the Demand Response Programme or
                                                     a contract with the Grid Owner, but not both.

    Distribution deferral                            Network costs range from $100/kW/pa4 to greater than $200/kW/pa, depending on the
                                                     nature of the network. Australia (LV) ranges from $100-150/kW/pa. The analysis is based on
                                                     a mid-point of $150/kW/pa for distribution network expansion costs.

    Time-of-Use bill management                      Indicative TOU tariff for large commercial customers, including Wellington Electricity’s
                                                     variable lines charges.

    Increased PV self-consumption                    We assumed that the battery is fully charged with excess solar during the day and discharged
                                                     over the evening peak, with the avoided costs derived from an average feed-in tariff of 8c/
                                                     kWh. No allowance has been made for changes to network injection costs.

    Demand charge reduction                          We used the Wellington Electricity pricing schedule5 for 300-1500KVA ICPs, at ~$150/kW/pa.

    Reliability/Backup power                         There are many factors that go into determining the Value of lost load (Voll) for each
                                                     customer classification and geographical location. Our assumption in this report is based on
                                                     the 2013 EA Voll Survey6 Table 1. Refer to Appendix for a break-down by customer
                                                     classification.
                                                     For grid-connected assets, the simple average value of $25,300/MWh is used to value
                                                     reliability.

3
      See https://www.transpower.co.nz/keeping-you-connected/demand-response/our-demand-response-programme
4
      For example, Orion’s estimated network long run average incremental cost. Concept Consulting: Electric cars, solar panels, and
      batteries in New Zealand, Vol 2: The benefits and costs to consumers and society June 2016, Appendix C.
5
      See https://welectricity.co.nz/disclosures/pricing/2017-pricing/
6
      Electricity Authority, Investigation into the Value of Lost Load in New Zealand - Report on methodology and key findings, 23 July 2013
      VOLL: http://www.ea.govt.nz/dmsdocument/15385

                                                                                                                                  TRANSPOWER NEW ZEALAND LIMITED   8
BATTERY STORAGE
IN NEW ZEALAND

The value within New Zealand for each of the thirteen services a battery can potentially offer and its range
is shown in the following table. It should be noted that the “Black start” service has been ignored as the
New Zealand power system offers a low price for black start services compared to other countries. In other
fossil-fuelled based electricity systems, the power stations needed to restart the power system are located
close to or within major population centres where batteries would also be located – so in theory, batteries
can provide this service. In New Zealand, our renewable generation power stations are remote from where
batteries will most likely be located, and therefore offer little practical benefit to the power system restart
process.

              Table 2
   Table 2
              A summary of potential battery value for each service
   A SUMMARY OF POTENTIAL BATTERY VALUE FOR EACH SERVICE

                                                                 Service Value Range $/kW/pa

                                                        0   50        100         150          200   250    300       350

                                   Energy Arbitrage

                           Spin / Non-Spin Reserves

                               Frequency Regulation

                                    Voltage Support

             Resource Adequacy (Peaking Capacity)

                                 Demand Response

                               Transmission Deferral

                                Distribution Deferral

                        Time-of-Use Bill Management

                    Increased PV Self-Consumption

                          Demand Charge Reduction

                                     Backup Power

                                                                            low       high

The following table illustrates how the closer to the end-consumer
the batteries are located, the more services and value they could
earn if they could participate in all market services.

                                                                                                           TRANSPOWER NEW ZEALAND LIMITED   9
BATTERY STORAGE
IN NEW ZEALAND

                        Table 3
                        A summary of potential benefit for a battery at each place in the electricity supply chain
                          Table 3
                           A SUMMARY OF POTENTIAL BENEFIT FOR A BATTERY AT EACH
                           PLACE IN THE ELECTRICITY SUPPLY CHAIN

                                                   Potential Service Value by Location $/kW/pa

                                       0      50             100               150                 200          250

                                                                                                                               Peaking Capacity
                          Remote
                        Generation
                                                                                                                               Frequency Regulation

                                                                                                                               Voltage Support

                                                                                                                               Spin / Non-Spin Reserves

                               Grid                                                                                            Energy Arbitrage

                                                                                                                               Demand response

                                                                                                                               Transmission Deferral

                                                                                                                               Distribution Deferral
                        Distribution
                                                                                                                               Demand Charge Reduction

                                                                                                                               Increase PV Self-Consumption

                                                                                                                               Backup Power

                                                                                                                               Time-of-Use Bill Management
                         Customer

                  Revenue from providing battery services
                  There are some matters to keep in mind when                                         providing multiple services, not all possible
                  considering how much revenue a case study battery                                   revenue streams are likely to be practicable.
                  could theoretically provide.                                                   „„   Battery storage can only be assigned to one
                  „„   The battery’s location in the electricity supply chain                         contracted/paid use at a time. A battery being paid
                       determines which of these services it can provide.                             to act as a reserve cannot also provide that same
                       Generally, a battery at the consumer end of the                                stored energy to manage demand. A battery could
                       supply chain can, from a physics standpoint,                                   assign part of its storage to each activity, but
                       provide all these services. A battery located at a                             cannot ‘double-dip’, otherwise system stability
                       distribution substation site can provide fewer, and                            could be affected.
                       a battery at a generation site or on the transmission                     „„   The procurement of grid services in New Zealand
                       network can provide the fewest.                                                is generally low-cost, because of our flexible hydro
                  „„   Batteries can create the highest value when they                               generation. This means the potential revenue for a
                       are highly utilised, providing multiple services at                            battery from providing some services is lower than
                       the same time, or in sequence.                                                 has sometimes been seen in international
                  „„   Some services are not complementary. A battery                                 examples.
                       that is being used to manage capacity will be
                       completely discharged from full to empty and will                         In the New Zealand context, the mechanism to
                       not be able to provide back-up power supply or                            provide these services does not exist at all points in
                       stabilise the power system by providing reserves.                         the supply chain. Some services are not presently
                       A battery assigned to provide full back-up power                          monetised. Further, market mechanisms or platforms
                       supply would need to be fully charged for                                 where storage resources can be offered into the
                       maximum effectiveness and could not be used for                           market and openly traded through the supply chain do
                       other purposes. Therefore, when considering the                           not exist. For battery owners to realise value, these
                       maximum value that a battery could derive from                            limitations should change.

                                                                                                                       TRANSPOWER NEW ZEALAND LIMITED 10
BATTERY STORAGE
IN NEW ZEALAND

Some examples include:
„„     Energy arbitrage – not presently available to residential                  „„   Unconstrained network areas will see no value from
       customers on a fixed or flat tariff, or enabled by existing                     transmission/distribution deferral savings or demand response.
       market tools and rules.                                                    „„   Introducing cost-reflective tariffs has the potential to impact the
„„     Voltage support – not required in all regions.                                  value of solar PV self-consumption, demand charges and
                                                                                       time-of-use bill management for end-consumers.
„„     A battery cannot receive revenue for reserves or demand
       reduction at times of maximum discharge or at a very                       „„   Parties may have a different view on the value to them of loss
       low state of charge due to physical constraints and these                       of supply.
       will need to be reflected in market structures and prices.

In Appendix 2 we summarise these services in the electricity market.

Costs
Below we summarise our assumptions around battery costs. For full details around our assumptions on costs see Appendix 1.
Table 4
KEY COST ASSUMPTIONS

    COSTS                                           ASSUMPTIONS

    Capital costs                                   Based on recent market trends, mid-point costs are assumed for this report to be:
                                                                       Discharge capacity/Storage capacity                     Capital cost
                                                      Residential
BATTERY STORAGE
IN NEW ZEALAND

CASE STUDIES
We researched the applications          Location                                        Determining potential value of services

where batteries could be used in        We considered batteries located in four         We calculated a net present value for
                                        regions: the upper North Island, lower          each case study – this is the theoretical
New Zealand, and the additional         North Island, upper South Island and            maximum value that an optimised battery
services they might realistically       lower South Island. We also looked at           storage system could receive in an ideal
                                        batteries placed at each location in the        situation. This net present value is based
provide. Of all potential options, we
                                        electricity supply chain: generation,           on key assumptions about pricing, cost,
have fully developed the five most      transmission and distribution substation,       and dispatch profile. We also considered
useful (and economically promising)     commercial/industrial, and residential          several input scenarios for each case
                                        sites.                                          study, to compare possible groups of
as case studies, using the revenue
                                                                                        revenue streams.
and cost assumptions outlined in the    Battery use                                     In tables where we compare these
previous section. Summaries of          We defined and evaluated the potential          scenarios, we use a simple dollar sign
these five are presented here.          income available to each of these case          rating to indicate the size of the potential
                                        studies, and assumed that each battery          value ($ = some value; $$ = moderate
                                        will be utilised for all possible activity by   value; $$$ = high value).
                                        developing a dispatch scenario (refer to
                                                                                        Given we expect the cost of batteries to
                                        Appendix 1).
                                                                                        continue to decline, we have compared
                                        Typically, the battery in each case study       the potential revenue to present and
                                        is charged during low price periods             forecast installed capital costs for 2020
                                        overnight and dispatched once or twice          and 2026.
                                        each day to earn revenue from the spot
                                                                                        For the full data around our assumptions
                                        market during peak demand periods.
                                                                                        and value modelling, see Appendix 1.
                                        Revenue is earned for providing reserves
                                        and frequency-keeping services in off-
                                        peak times, and we assumed that voltage
                                        support services would be available when
                                        the battery was not at a low state of
                                        charge.

                                                                                                TRANSPOWER NEW ZEALAND LIMITED 12
BATTERY STORAGE
IN NEW ZEALAND

 CASE STUDY 1

GENERATION SITE, NORTH ISLAND

Battery size:                                           20MW/40MWh
Battery purpose: The battery’s primary purpose is to provide energy to cover peak demand, and ancillary services during the rest
                 of the day.

We considered two situations: a battery owned by the generator (merchant plant) and a battery contracted to a generator under a
capacity contract (hedged plant).
Figure 4 shows the potential present value of the revenue streams under both scenarios, comparing this to the cost of the battery,
both now and forecast in the future. Figure 5 compares the cost of the battery, against the alternative solution (new open cycle gas
turbine(s) (OCGT)).
When preparing these Figures we have shown the costs of a battery system today including capital, operating and tax as a stack of
bars on the left hand side. We have also shown our expected battery system costs as the stack of bars on the right-hand side.
Between these are the potential value stack of services, arranged in different combinations, a battery system may be able to turn
intoFigure
      revenue
           4
               to offset the cost if they were all available to the battery owner today. With regards
                                                                                               Figure 5
                                                                                                        to the key, for clarity we have
    Costs and potential revenue streams for generation-site battery
separated the revenue stream shown on top, from the cost items at the bottom.                  Costs of a battery compared to OCGT alternative

                         Figure 4                                                                                                                                                               Figure 5
                         COSTS AND POTENTIAL REVENUE STREAMS FOR                                                                                                                                COSTS OF A BATTERY COMPARED
                         GENERATION-SITE BATTERY                                                                                                                                                TO OCGT ALTERNATIVE

                                                                                                                                                                              Case 1
                                                                                                                                                                                                $/KW/Year                           Case 1
                                                                                                                                                                           Virtual peaker
                                                                                                                                                                                                                                 Virtual peaker
                         50,000                                                                                                                                                 UNI
                                                                                                                                                                                                300                                   UNI
                                                                                                                                                                          20MW/40MWh
                                                                                                                                                                                                                                20MW/40MWh

                         40,000
                                                                                                                                                                        Transmission Deferral
                                                                                                                                                                                                250

                                                                                                                                                                        Resource Adequacy                                       Black Start
                                                                                                                                                                        (Peaking Capacity)
  Present Value $(000)

                                                                                                                                                                                                                                Spin / Non-Spin
                                                                                                                                                                                                200
                         30,000                                                                                                                                         Black Start                                             Reserves

                                                                                                                                                                        Voltage Support                                         Voltage Support

                                                                                                                                                                                                150
                                                                                                                                                                        Frequency Regulation                                    Resource Adequacy
                         20,000                                                                                                                                                                                                 (Peaking Capacity)

                                                                                                                                                                        Energy Arbitrage
                                                                                                                                                                                                100                             Cost (2017)
                                                                                                                                                                        Spin / Non-spin
                         10,000                                                                                                                                         Reserves

                                                                                                                                                                                                 50
                                                                                                                                                                        Tax Cost

                             0                                                                                                                                          Operating cost
                                    COST 2017

                                                ENERGY + ANCILLARY
                                                          SERVICES

                                                                     + VOLTAGE

                                                                                 HIGH ENERGY AND
                                                                                   RESERVE PRICES

                                                                                                    + DISCOUNTED CAP
                                                                                                           CONTRACT

                                                                                                                       + FULL VALUE
                                                                                                                          CONTRACT

                                                                                                                                      VIRTUAL PEAKER
                                                                                                                                               20120

                                                                                                                                                       VIRTUAL PEAKER

                                                                                                                                                                                                  0
                                                                                                                                                                        Capital cost                  OCGT    COST   BENEFITS

The following table explores the revenue stream value for this case study.

                                                                                                                                                                                                             TRANSPOWER NEW ZEALAND LIMITED 13
BATTERY STORAGE
IN NEW ZEALAND

Table 5
REVENUE STREAM VALUE FOR BATTERY AT GENERATION SITE
 PRIMARY PURPOSE        REVENUE STREAMS

                          Energy     Black   Voltage   DRP    Capex                              Notes
                         Arbitrage   Start   Support         Deferral
                           and
                         Reserves

 Energy arbitrage                                                       - $30/MWh arbitrage value for UNI
 + Ancillary Services                                                   - Black Start contract
                            $         $                                 - Reserve services offered outside peaks
                                                                        - Capacity split each day: 20% Frequency keeping,
                                                                         80% Reserves

 Energy arbitrage                                                       Voltage support Contact for +/-20MVA
 + Ancillary Services       $         $        $
 + Voltage

 Energy /Reserves                                                       - Greater price volatility as supply of peaking capacity
 prices Increased                                                       tightens, peak to trough spot spread increases from
                            $         $        $                        $30-$50/MWh for energy
                                                                        - A tighter reserves and energy market, average
                                                                        annual Reserve prices lifts to $15/MWh

 Energy /Reserves                                                       - Capacity contract to make available 40MWh each
 prices Increased                                                       day at $100/kW/pa – any energy arbitrage revenue
 + Discounted Cap                                                       assumed included in the capacity contract
                         Reserves
 Contract                             $        $        $               - Reserves revenue available
                           only
                                                                        - +/- 20MVAR voltage support contract 24/7
                                                                        - Base Case for Figure 9

 Energy /Reserves                                                       - BSS close to load centre and can defer transmission
 prices Increased                                                       upgrades by at least 5 years (1/2 life of battery
 + Discounted Cap                                                       cycles) or alternatively participate in the DRP if the
 Contract                Reserves                                       cap contract is not called
                                      $        $        $       $
 + Full Value Cap          only                                         Provide equivalent peaking services to an OCGT
 Contract                                                               value lifts to $150/kW/pa
 + Transmission                                                         - Reserves revenue available
 Deferral                                                               - +/- 20MVAR voltage support contract 24/7

                                                                                            TRANSPOWER NEW ZEALAND LIMITED 14
BATTERY STORAGE
IN NEW ZEALAND

Findings: Battery owned by a generator                                        Findings: Battery located at a generator,
(merchant plant)                                                              under a capacity contract (hedged plant)

A significant increase in the difference between                              „„   This scenario envisages that the battery is under a capacity contract
peak and off-peak spot prices and/or ancillary                                     to the generator (for example, owned by a retailer wanting to
services price would be needed for a stand-alone                                   manage their exposure to high prices).
merchant project to be economically viable.                                   „„   Batteries can provide energy for short periods during demand
„„   An opportunity might emerge after 2020-25,                                    peaks to defer operational costs or replace the need for new OCGT.
     due to the planned closure of thermal plant at                                In a capacity market, this would be typically supported by a
     Huntly and tightening of the capacity market in                               long-term capacity contract valued at the carry cost of an equivalent
     the upper North Island as Auckland grows.                                     OCGT (approx. $150-170/kW/pa).*
„„   A battery storage system will enable a generator                         „„   In the present market, other capacity providers are more cost
     to be more responsive to the National Grid’s                                  effective than battery storage (that is, existing peaking OCGT has
     five-minute dispatch requirements. The battery                                sunk costs and low operating costs). However, as peak demand
     storage system can “fill in” and dispatch energy                              grows and existing OCGT plant reaches full capacity, we expect
     to the grid with very short notice while an OCGT                              batteries may be cost effective to supply the top of the demand
     starts and ramps up to full capacity, typically                               curve, deferring or replacing the need for new OCGTs.
     over a period of up to 10 minutes. This ability to                       „„   Battery storage appears comparable on a $/kW/year basis with
     provide instantaneous reserves will obtain                                    OCGT, but cannot be compared on an “apples for apples” basis.
     maximum value if spot prices move from the                                    Although they can both perform similar functions, each has
     30-minute average price to a 5-minute price                                   different start-up and short run marginal costs and operating
     settlement to match physical dispatch.13                                      characteristics. In addition to providing capacity at peak times,
„„   There are further benefits for generators in                                  OCGTs have the added value that they can supply energy on a
     reducing start-up times, short run cycles,                                    sustained basis (a valuable feature in a dry year) compared to a
     minimum stable generation and increasing the                                  battery which shifts energy across the day (little value in a dry year).
     response and efficiency of thermal plant.                                „„   A battery’s energy storage capacity is finite – it cannot deliver
     Generators that provide reserves from thermal                                 sustained output like other types of generating plant. A market
     plant could use batteries instead at much lower                               participant would therefore be unlikely to contract for battery
     marginal cost, creating operational savings. A                                capacity unless it was at a price below the carry cost of an existing
     study of energy storage in California found                                   thermal plant site, or offered other benefits.
     upwards of US$100/kW/pa value for the
     avoided start-up costs and variable operations
                                                                              „„   Given the absence of a liquid capacity market in New Zealand, the
     and maintenance. This figure is contextual to                                 Australian market was considered a reasonable proxy indicator of
     the California power system and the operational                               the value of capacity contracts.14
     savings in New Zealand, while positive and                               „„   The extent to which the operational characteristics of a battery
     increasing the value of such battery storage, are                             attract a discount or a premium compared to OCGT is uncertain.
     expected to be much lower.

* Capex recovery @ 10% over 20 years on $1,150 –1300/MW plus fixed operations and maintenance @ $14/MW per year.
13
     We note that the Australian Energy Market Commission has recently started consultation on the impacts of changing their settlement period for the electricity spot
     price from 30 minutes to 5 minutes. The change has been requested by major energy users to help reduce “distortions” in the market, lower prices, and deliver a
     signal for battery storage to enter the market with its ability for instantaneous response.
14
     It should be noted a project is under way by ASX NZ Electricity to launch four cap products with $130/MWh and 300/MWh strike prices (at Benmore and Otahuhu).

                                                                                                                               TRANSPOWER NEW ZEALAND LIMITED 15
BATTERY STORAGE
IN NEW ZEALAND

 CASE STUDY 2

TRANSPOWER SUBSTATION SITE, UPPER NORTH ISLAND

Battery size:              10MW/20MWh
Battery purpose:           The battery’s primary use is to defer planned capital expenditure, which is required to increase the capacity of
                           the substation. It does this by providing energy during infrequent periods of very high demand for a number of
                           years, until an upgrade is justified. Alternatively, or in combination with capital deferral, the battery could also
                           provide frequency control and voltage management services, and power to some essential users if power
                           supply is interrupted.

Figure 6 illustrates the potential present value of the revenue streams, comparing this to the cost of the battery, both now and
forecast in the future.

         Figure 6
         Costs and potential revenue streams for transmission substation site battery
                                          Figure 6
                                          COSTS AND POTENTIAL REVENUE STREAMS FOR
                                          TRANSMISSION SUBSTATION SITE BATTERY

                                                                                                                                                                                          Case 2

                                                                                                                                                                                         TP GXP
                                                                                                                                                                                           UNI
                                                     12,000
                                                                                                                                                                                       4MW/8MWh

                                                                                                                                                                                     Energy Arbitrage
                                                     10,000

                                                                                                                                                                                     Spin / Non-Spin Reserves
                              Present Value $(000)

                                                      8,000
                                                                                                                                                                                     Transmission Deferral

                                                                                                                                                                                     Voltage Support

                                                      6,000                                                                                                                          Back-up Power

                                                                                                                                                                                     Frequency Regulation
                                                      4,000

                                                                                                                                                                                     Tax Cost
                                                      2,000
                                                                                                                                                                                     Operating cost

                                                                                                                                                                                     Capital cost
                                                         0
                                                              COST 2017

                                                                          CAPEX DEFERRED 5 Y
                                                                                      (LOW)

                                                                                               CAPEX DEFERRED 5 Y
                                                                                                           (HIGH)

                                                                                                                    CAPEX DEFERRED 5 Y
                                                                                                                        (MID) + VOLTAGE

                                                                                                                                             PRIMARY GRID
                                                                                                                                          SUPPORT SERVICES

                                                                                                                                                             COST 2020

                                                                                                                                                                         COST 2026

                           The following table explores the revenue stream groups for this case study.

                                                                                                                                                                                                             TRANSPOWER NEW ZEALAND LIMITED 16
BATTERY STORAGE
IN NEW ZEALAND

Table 6
REVENUE STREAM VALUE FOR TRANSMISSION SUBSTATION SITE BATTERY

 PRIMARY PURPOSE        REVENUE STREAMS

                         Energy          Ancillary    Voltage      Capex
                                                                             Security                      Comments
                        Arbitrage        Services     Support     Deferral

 5 Year Capex
                                                                                        Primary role is to defer capital spend by 5 years
 Deferral (low)
                           $                $                        $                  provide Reserves Market
 + Energy Markets
                                                                                        Capex spend at LRMC low rate of $30/kW/pa
 + Ancillary Services

 5y Deferral (high)        $                $                       $$$         $       Capex spend at LRMC high rate of $80/kW/pa

 5y Deferral (mid)                                                                      Capex spend deferred 5 years at LRMC mid-rate
 + Voltage support         $                $            $          $$          $       of $50/kW/pa
 + Backup                                                                               Battery provides 8MWh to cover a loss of supply

 Grid support
 services
                                                                                        Primary role is to provide 24/7 system support in
 + Frequency                               $$$           $$          $          $
                                                                                        the form of Frequency and Voltage control
 + 5y Deferral (mid)
 + backup

                                    Findings: Battery at Transpower substation site

                                    „„   Capital deferral benefits alone are insufficient to provide a return on investment.
                                         However, using the battery for additional services and considering the forecast cost
                                         decline for the battery system could mean a project like this would be viable after
                                         2020.
                                    „„   The value of transmission deferral can be variable, so decisions about batteries for
                                         transmission deferral should be assessed on a project-by-project basis.
                                    „„   The most attractive battery application for the National Grid is likely to be to provide
                                         frequency control and voltage support.
                                    „„   In this case study, the potential revenue is at risk from competing suppliers: if there are
                                         a lot of batteries elsewhere on the power system, there may be an over-supply of
                                         energy available at peak times, eroding the benefit that this battery could provide.
                                    „„   The modular nature of battery systems means initial installation could be of the exact
                                         capacity required, with the possibility of increasing the storage capacity over time if
                                         growth in demand occurs, or relocating the battery if it was no longer needed. This
                                         helps lower initial capex and leverages the forecast declining cost curve of batteries
                                         over time.

                                                                                                        TRANSPOWER NEW ZEALAND LIMITED 17
BATTERY STORAGE
IN NEW ZEALAND

 CASE STUDY 3

DISTRIBUTION SUBSTATION SITE, UPPER NORTH ISLAND

Battery size:            1MW/2MWh
Battery purpose: The battery’s primary use is to defer planned capital expenditure required to increase the capacity of the
                 substation. It does this by providing energy during infrequent periods of very high demand for a number of
                 years, until an upgrade is justified. Alternatively, or in combination with capital deferral, the battery could also
                 provide frequency control and voltage management services, and power to some essential users if power supply
                 is interrupted.

The graph below shows the potential present value of the revenue streams, comparing this to the cost of the battery, both now and
forecast in the future.

        Figure 7
                                                     Figure 7
        Costs and potential revenue streams for distribution substation site battery
        Present Value $(000)
                                                     COSTS AND POTENTIAL REVENUE STREAMS FOR
                                                     DISTRIBUTION SUBSTATION SITE BATTERY

                                                                                                                                                                                                 Case 3

                                                                                                                                                                                             Dist Zone Sub
                                                     3,500
                                                                                                                                                                                                  UNI
                                                                                                                                                                                              1MW/2MWh

                                                     3,000
                                                                                                                                                                                            Frequency Regulation

                                                                                                                                                                                            Transmission Deferral
                                                     2,500
                                                                                                                                                                                            Energy Arbitrage
                              Present Value $(000)

                                                                                                                                                                                            Spin / Non-Spin Reserves
                                                     2,000

                                                                                                                                                                                            Voltage Support

                                                     1,500                                                                                                                                  Back-up Power

                                                                                                                                                                                            Distribution Deferral
                                                     1,000

                                                                                                                                                                                            Tax Cost
                                                      500
                                                                                                                                                                                            Operating cost

                                                                                                                                                                                            Capital cost
                                                        0
                                                             COST 2017

                                                                         ENERGY + ANCILLARY

                                                                                              MARKET SERVICES +
                                                                                              5Y CAPEX DEFERRED

                                                                                                                   MARKET SERVICES +
                                                                                                                  10Y CAPEX DEFERRED

                                                                                                                                       + VOLTAGE

                                                                                                                                                   ALL SERVICES +
                                                                                                                                                         BACK-UP

                                                                                                                                                                    COST 2020

                                                                                                                                                                                COST 2026

                          The following table explores the revenue stream groups for this case study.

                                                                                                                                                                                                                    TRANSPOWER NEW ZEALAND LIMITED 18
BATTERY STORAGE
IN NEW ZEALAND

Table 7
REVENUE STREAM VALUES FOR BATTERY AT DISTRIBUTION SUBSTATION

 PRIMARY PURPOSE         REVENUE STREAMS

                                                     Network
                          Energy       Ancillary                  Transmission      Voltage
                                                      Capex                                                     Notes
                         Arbitrage     Services                  Capex Deferral     support
                                                     Deferral

 Energy                                                                                         UNI 22KV or 11KV Zone
                            $              $
  + Ancillary Services                                                                          substation

 Energy
                                                                                                Capex spend deferred
  + Ancillary Services      $              $            $
                                                                                                5 years at UNI LRMC
 + 5y Deferral

 Energy
                                                                                                Capex spend deferred 10 years at
  + Ancillary Services      $              $            $
                                                                                                UNI LRMC
 +10y Deferral

 Energy
  + Ancillary Services                                                                          Contracted +/-1MVAR
 + Voltage Support          $              $            $               $               $       5 year Transmission deferral
 + Transmission                                                                                 applicable
 Deferral
                                                                                                Battery covers a 2MWh loss of supply
 All services               $              $            $               $               $       from the grid at Voll of $25,300/MWh
                                                                                                With 10-year capex deferral

                                 Findings: Battery at distribution substation

                                 „„   As in Case Study 2, capital deferral benefits alone are insufficient to provide a return on
                                      investment.
                                 „„   However, using the battery for additional services and considering the forecast cost decline
                                      for the battery system itself could mean a project like this would be viable after 2020.
                                 „„   The most attractive locations will be at substations with forecast low demand growth, where
                                      storage can both reduce peak demand and defer any upgrades.
                                 „„   The modular nature of battery systems means initial installation could be of the exact
                                      capacity required in the first year of need, with the possibility of increasing the storage
                                      capacity over time if growth in demand occurs, or relocating the battery if it was no longer
                                      needed. This helps lower initial capex and leverages the forecast declining cost curve of
                                      batteries over time.

                                                                                                   TRANSPOWER NEW ZEALAND LIMITED 19
BATTERY STORAGE
IN NEW ZEALAND

 CASE STUDY 3.1

– A REAL-LIFE EXAMPLE:
USING A BATTERY TO DEFER INVESTMENT
FOR WELLINGTON ELECTRICITY
                                Figure 8
                                Winter load duration at Palm Grove Substation
Wellington Electricity has investigated
                                Palm Grove Winter Load Duration

different sites where a battery could                                 Figure 8
be used to help defer investment in                                   WINTER LOAD DURATION AT PALM GROVE SUBSTATION
its network. The example used for this
report is based on Palm Grove                                    40

Substation, which is supplied by
                                                                 35                                                                                                                                               N-1 Subtrans Cable Cyclic
double circuit 33 kV underground                                                                                                                                                                                                     Capacity
cables from the Central Park GXP in                              30

central Wellington.
                                                                 25                                                                                                                                               N-1 Transformer Cyclic
Palm Grove substation supplies
                                                  Demand (MVA)

                                                                                                                                                                                                                                 Capacity
10,000 customers and essential water                             20
pumping and medical facilities. The
transformers are in good condition                               15

but have high criticality due to peak                                       134 Half-hour periods

loading. The sustained winter peak                               10

demand at Palm Grove currently just                               5
exceeds the capacity of the two
24MVA transformers. This is currently                             0
                                                                      1
                                                                          144
                                                                                287
                                                                                      430
                                                                                            573
                                                                                                  716
                                                                                                        859
                                                                                                              1002
                                                                                                                     1145
                                                                                                                            1288
                                                                                                                                   1431
                                                                                                                                          1574
                                                                                                                                                 1717
                                                                                                                                                        1860
                                                                                                                                                               2003
                                                                                                                                                                      2146
                                                                                                                                                                             2289
                                                                                                                                                                                    2432
                                                                                                                                                                                           2575
                                                                                                                                                                                                  2718
                                                                                                                                                                                                         2861
                                                                                                                                                                                                                3004
                                                                                                                                                                                                                       3147
                                                                                                                                                                                                                              3290
                                                                                                                                                                                                                                     3433
                                                                                                                                                                                                                                            3576
                                                                                                                                                                                                                                                   3719
                                                                                                                                                                                                                                                          3862
                                                                                                                                                                                                                                                                 4005
                                                                                                                                                                                                                                                                        4148
                                                                                                                                                                                                                                                                               4291
                                                                                                                                                                                                                                                                                      4434
                                                                                                                                                                                                                                                                                             4577
                                                                                                                                                                                                                                                                                                    4720
                                                                                                                                                                                                                                                                                                           4863
                                                                                                                                                                                                                                                                                                                  5006
                                                                                                                                                                                                                                                                                                                         5149
                                                                                                                                                                                                                                                                                                                                5292
                                                                                                                                                                                                                                                                                                                                       5435
                                                                                                                                                                                                                                                                                                                                              5578
                                                                                                                                                                                                                                                                                                                                                     5721
                                                                                                                                                                                                                                                                                                                                                            5864
                                                                                                                                                                                                                                                                                                                                                                   6007

managed by operational controls after
an event. As demand increases, a                                                                                                                                                              Half-hour Periods

further network solution will be                                                                                                                                                     Palm Grove Winter Demand (MVA)

required.

                                               Wellington Electricity has determined that a 1 MW/2MWh battery,
                                               reducing the peak load on this substation, would defer the need for
                                               additional capital expenditure of approximately $3m by five years.

                                                                                                                                                                                                                                               TRANSPOWER NEW ZEALAND LIMITED 20
BATTERY STORAGE
                   IN NEW ZEALAND

                   Figure 9 below shows the potential present value of
                   the revenue streams and compares this to the cost
                   of the battery, both now and forecast in the future.
                   Figure 10 compares the cost of the battery and the
                   cost of the alternative solution, a diesel generator.

Figure 7
                        Figure
Costs and potential revenue      9 for distribution substation site battery
                            streams                                                                                                                                                                           Figure   10
                                                                                                                                                                                                               Figure 10
Present Value $(000)                                                                                                                                                                                           Solution costs and potential battery benefits for Palm Grove substation
                                     COSTS AND POTENTIAL REVENUE STREAMS FOR BATTERY                                                                                                                          SOLUTION
                                                                                                                                                                                                               $/KW/Year
                                                                                                                                                                                                                                COSTS AND POTENTIAL BATTERY
                                     AT PALM GROVE SUBSTATION                                                                                                                                                 BENEFITS FOR PALM GROVE SUBSTATION

                                                                                                                                                                                       Case 3a                                                                 Case 3a
                                                                                                                                                                                     1MW/2MWh                                                               1MW/2MWh
                                                                                                                                                                                                               $/KW/Year
                                            3,500                                                                                                                                        LNI                                                                     LNI
                                                                                                                                                                                     Palm Grove                                                              Palm Grove
                                                                                                                                                                                                               400

                                            3,000
                                                                                                                                                                                   Frequency Regulation
                                                                                                                                                                                                                                                          Frequency
                                                                                                                                                                                                               350
                                                                                                                                                                                                                                                          Regulation
                                                                                                                                                                                   Transmission Deferral
                                            2,500
                                                                                                                                                                                                               300
                                                                                                                                                                                                                                                          Transmission
                                                                                                                                                                                   Energy Arbitrage
                                                                                                                                                                                                                                                          Deferral
                     Present Value $(000)

                                                                                                                                                                                   Spin / Non-Spin Reserves
                                            2,000                                                                                                                                                              250                                        Energy Arbitrage

                                                                                                                                                                                   Voltage Support
                                                                                                                                                                                                                                                          Spin / Non-Spin
                                                                                                                                                                                                               200                                        Reserves
                                            1,500                                                                                                                                  Back-up Power
                                                                                                                                                                                                                                                          Voltage Support
                                                                                                                                                                                   Distribution Deferral       150

                                            1,000                                                                                                                                                                                                         Backup Power

                                                                                                                                                                                                               100
                                                                                                                                                                                                                                                          Distribution
                                                                                                                                                                                   Tax Cost                                                               Deferral
                                             500
                                                                                                                                                                                   Operating cost               50
                                                                                                                                                                                                                                                          Cost (2017)

                                                                                                                                                                                   Capital cost
                                               0                                                                                                                                                                 0
                                                    COST 2017

                                                                ENERGY + ANCILLARY

                                                                                     MARKET SERVICES +
                                                                                     5Y CAPEX DEFERRED

                                                                                                          MARKET SERVICES +
                                                                                                         10Y CAPEX DEFERRED

                                                                                                                              + VOLTAGE

                                                                                                                                          ALL SERVICES +
                                                                                                                                                BACK-UP

                                                                                                                                                           COST 2020

                                                                                                                                                                       COST 2026

                                                                                                                                                                                                                     DIESEL      COST     BENEFITS

                    The following table explores the revenue streams for this case study.

                                                                                                                                                                                                                                  TRANSPOWER NEW ZEALAND LIMITED 21
BATTERY STORAGE
IN NEW ZEALAND

Table 8
REVENUE STREAMS FOR BATTERY AT PALM GROVE SUBSTATION SITE

 PRIMARY PURPOSE        REVENUE STREAMS

                        Distribution
                                          Energy Ancillary                  Transmission Capex     Voltage
                           capex                            Security                                                    Notes
                                         Arbitrage Services                      Deferral          support
                          deferral
 5y Deferral                 $                                                                               $3m deferred 5 years

 5y Deferral
                                                                                                             Arbitrage and Reserves +
 + Energy                    $                $          $
                                                                                                             Frequency Keeping
 + Ancillary services

                                                                                                             Backup: 2MWhr essential
 5y Deferral
                             $                $          $          $                                        services supply at Voll of
 + Security
                                                                                                             $25,300/MWh

 5y Deferral
                                                                                                             5 year deferral of TP
 + 5 year
                             $                $          $          $                $                       Central Park upgrade
 Transmission
                                                                                                             Base Case Figure 16
 Deferral

                                                                                                             Contracted +/-1MVAR
 All services                $                $           $         $                $                $
                                                                                                             voltage support

                                       Findings: Battery at Palm Grove substation

                                       The five-year deferral equates to approximately $100/kW/pa in the long run.
                                       „„   Using the battery for additional services as well as the savings from deferring investment
                                            indicates a battery could be a viable alternative after 2020 as battery costs decline,
                                            particularly if this project also defers upgrade costs up-stream on the Central Park/Wilton
                                            transmission infrastructure.
                                       „„   A battery of this size could be redeployed elsewhere at the end of the deferral period at
                                            Palm Grove.
                                       „„   The battery offers several hours of back-up power to Palm Grove’s essential water pumping
                                            and medical feeders.
                                       „„   Given Palm Grove’s location in the lower North Island, it is unlikely that voltage support
                                            contracts would be available or that revenue would be derived from Transpower’s Demand
                                            Response Programme.
                                       „„   Assuming demand response has been fully utilised already, a standby diesel generation set
                                            would be a lower cost alternative for Wellington Electricity. However, this comes with high
                                            operating and management costs and environmental impact considerations as well as
                                            consenting and planning constraints.

                                                                                                      TRANSPOWER NEW ZEALAND LIMITED 22
BATTERY STORAGE
IN NEW ZEALAND

 CASE STUDY 4

BATTERY AT A COMMERCIAL OR INDUSTRIAL SITE,
UPPER NORTH ISLAND

Battery size:        100kW/200kWh
Battery purpose:     the primary purpose is to lower the owner’s electricity bill by:
                    „„   moving energy to better manage peak demand charges and move use into the lower priced time periods;
                    „„   providing back-up power supply for essential systems (such as lighting, EFTPOS/IT systems, other critical
                         processes); and
                    „„   participating in demand response programmes and reserve markets.

In this example, we assumed the battery
site has consumption lower than 1GWh        pa,
                                        Figure 11
                                                              Figure
                                        Costs and potential revenue    11 for battery at a commercial or industrial site
                                                                    streams
such as a manufacturing facility or                           COSTS AND POTENTIAL REVENUE STREAMS FOR BATTERY
medium sized retail site. We also assumed                     AT A COMMERCIAL OR INDUSTRIAL SITE
that energy use at the site is low overnight                                                                                                                               Case 4
and generally flat during the day, and that                                                                                                                           0.1MW/0.2MWh

the owner is on a time-of-use energy plan                           350
                                                                                                                                                                            UNI
                                                                                                                                                                    Commercial Site 2017
with network charges generally comprising
a demand charge based on highest peaks
                                                                    300
                                                                                                                                                                     Demand Response (DRP)
over a defined period.
                                                                                                                                                                     Frequency Regulation
Figure 11 shows the potential present                                        250

value of the revenue streams and                                                                                                                                     Time-of-Use Bill Management

compares this to the cost of the battery,
                                                      Present Value $(000)

                                                                                                                                                                     Spin / Non-Spin Reserves
                                                                             200
both now and forecast in the future.
                                                                                                                                                                     Voltage Support

                                                                             150                                                                                     Demand Charge Reduction

                                                                                                                                                                     Back-up Power
                                                                             100

                                                                                                                                                                     Tax Cost
                                                                              50
                                                                                                                                                                     Operating cost

                                                                                                                                                                     Capital cost
                                                                               0
                                                                                   COST 2017

                                                                                               TOU

                                                                                                     + VOLTAGE + BACK-
                                                                                                        UP (LOW VALUE)

                                                                                                                         + BACKUP (HIGH
                                                                                                                                 VALUE)

                                                                                                                                          COST 2020

                                                                                                                                                        COST 2026

                                                   The following table explores the revenue streams for this case study.

                                                                                                                                                  TRANSPOWER NEW ZEALAND LIMITED 23
BATTERY STORAGE
IN NEW ZEALAND

Table 9
VALUE ASSUMPTIONS FOR BATTERY AT INDUSTRIAL OR COMMERCIAL SITE

 PRIMARY PURPOSE                REVENUE STREAMS

                                Energy                         Ancillary                 Voltage
                                                  Security                      DRP                      Notes
                                Arbitrage                      Services                  support
                                                                                                         Load shifting to manage a 25% demand charge
                                                                                                         reduction
     TOU Bill                                                                                            Participate in DRP15
     Management                        $              $              $             $                     Energy arbitrage on TOU
     +DRP                                                                                                IR Market revenue
                                                                                                         Backup of essential services at the average Voll of
                                                                                                         $25,300/MWh
     TOU Bill
                                                                                                         Load shifting to manage a 50% demand charge
     Management
                                                                                                         reduction
     +DRP
                                       $              $              $                         $         Add Frequency Keeping Services
     + Increase avoided
                                                                                                         Backup of essential services at the average Voll
     demand charges
                                                                                                         of $25,300/MWh
     + Frequency

     TOU Bill
     Management                                                                                          Backup of essential services at the higher Voll
     +DRP                              $              $              $                         $         rate for “Small Non-residential” rate of $57,000/
     +Backup                                                                                             MWh
     (high value)

                                             Findings: Battery at industrial or commercial site

                                             „„   This case study is potentially feasible after 2020, depending on the dollar value the customer
                                                  places on security of supply. (If security of supply is highly valued, it could be sooner as it
                                                  represents a good investment).
                                             „„   As a significant part of the potential value is related to managing electricity costs and avoiding
                                                  peak network charges, the final value will depend on the future shape of the current
                                                  Transmission and Distribution pricing reviews. In areas where demand is growing, the move
                                                  to more cost reflective/demand responsive pricing signals is expected to enhance battery
                                                  value. On the other hand, in areas where demand is flat or declining, there may be no benefit
                                                  as the network will likely only offer capacity-type charges.
                                             „„   The potential to add solar PV may further enhance the case for a battery.

15
      Participation in our demand response programme may be unrealistic if the battery is already managing peaks to avoid demand charges.
      Therefore, It is replaced by a greater reduction in demand charges in subsequent analysis.

                                                                                                                             TRANSPOWER NEW ZEALAND LIMITED 24
BATTERY STORAGE
IN NEW ZEALAND

 CASE STUDY 4.1

– A REAL-LIFE EXAMPLE:
                Figure 12
                                       NORTH ISLAND SUPERMARKET
                Profile of daily electricity demand at a North Island supermarket

A typical supermarket has a very
consistent daily demand profile                    Figure 12

with approximately 1.5GWh/pa                       PROFILE OF DAILY ELECTRICITY DEMAND AT A
                                                   NORTH ISLAND SUPERMARKET.
consumption.
The site studied in this example                                                                                               Daily Demand Profile
is on a time-of-use energy
account, with lines charges
                                                     200
dominated by a peak demand
charge set by the highest half-                      180

hour demand in the previous
month.                                               160
                                                KW

The site has a reasonably flat                       140

daytime electricity use, averaging
180kW.                                               120

                                                     100
                                                           1      3         5        7    9     11        13    15    17       19   21        23    25    27         29    31   33         35    37    39        41    43    45        47

                                 Figure 13                                                                                          TRADING PERIOD
                                 Profile of electricity use by 30-minute period at a North Island supermarket
                                                                                                   7 day avg                                       30 day avg                        1y avg

A closer look at the half hour
data shows arbitrary peaks                         Figure 13
spread across the day.                             PROFILE OF ELECTRICITY USE BY 30-MINUTE PERIOD AT A
                                                   NORTH ISLAND SUPERMARKET.

                                                                                                                           KW half hr >200 across a year
                                                      235

                                                      230

                                                      225

                                                      220

                                                      215

                                                      210

                                                      205

                                                      200

                                                      195
                                                               10 11   12       13   14   15   16    17    18   19   20   21   22   23   24    25    26   27    28    29   30   31    32    33   34   35    36    37   38   39    40

                                                                                                                                                                           TRANSPOWER NEW ZEALAND LIMITED 25
Figure 14
Profile of electricity demand by average weekly peak at a North Island supermarket
                  BATTERY STORAGE
                  IN NEW ZEALAND

                                 Figure 14
                                 PROFILE OF ELECTRICITY DEMAND BY AVERAGE WEEKLY PEAK AT A
                                 NORTH ISLAND SUPERMARKET.

                                                                               Typical weekly average peaks demand profile KW above 190

                                        45

                                        40                                                                                                                                                                  Findings:
                                        35
                                                                                                                                                                                                            Battery at large North Island
                                        30
                                                                                                                                                                                                            supermarket
                    KW Demand

                                        25

                                        20

                                        15                                                                                                                                                                  „„   We found an 18% reduction in
                                        10

                                             5
                                                                                                                                                                                                                 demand charges was possible
                                             0                                                                                                                                                                   (the battery was theoretically
                                                 1 2   3   4   5      6    7   8   9 10 11 12 13 14 15 16 17 18 19 20 21 22 23 24 25 26 27 28 29 30 31 32 33 34 35 36 37 38 39 40 41 42 43 44 45 46 47 48
                                                                                                                                                                                                                 sized to manage peak demand
                                                                                                                         Trading Period
                                                                                                                                                                                                                 greater than 190kW, requiring a
                                                                                                                                                                                                                 50kW/200kWh battery).
                                                                                                                                                                                                            „„   This suggests that a relatively
                  Figure 15 shows the potential present value of the revenue                                                                                                                                     small battery would reduce
                  streams and compares this to the cost of the battery, both now                                                                                                                                 demand peaks and avoid a
                  and forecast in 2020. It can be seen that it follows a similar                                                                                                                                 percentage of network lines
                  trend to the generic commercial case study but with differing                                                                                                                                  charges.
                  values, and is expected to be at a breakeven point 2020 and
                                                                                                                                                                                                            „„   Alternatively, smarter energy
                  therefore economic by 2026.
                                                                                                                                                                                                                 management may be a much
                                                                                                                                                                                                                 lower cost alternative, depending
                                 Figure 15                                                                                                                                                                       on what is driving the times of
Figure 15
                       COSTS AND POTENTIAL REVENUE          STREAMS FOR BATTERY                                                                                                                                  high energy use.
Costs and potential revenue streams for battery at a North Island supermarket
                                 AT A NORTH ISLAND SUPERMARKET.                                                                                                                                             „„   A significant factor in deriving
                                                                                                                                                                                                                 value for this battery is how
                                                                                                                                                                       Case 4a                                   much value the customer places
                                                                                                                                                                  0.05MW/0.1MWh
                                                                                                                                                                                                                 on having back up power to
                                                                                                                                                                         LNI
                                                 180
                                                                                                                                                                     Supermarket                                 maintain supply.

                                                 160
                                                                                                                                                                                                            „„   A significant part of value is
                                                                                                                                                                   Frequency Regulation                          related to lowering the electricity
                                                 140
                                                                                                                                                                   Time-of-Use Bill Management
                                                                                                                                                                                                                 bill and avoiding peak network
                                                                                                                                                                                                                 charges. The final value will be
                                                                                                                                                                   Spin / Non-Spin Reserves
                                                 120
                                                                                                                                                                                                                 dependent on the future shape
                      Present Value $(000)

                                                 100
                                                                                                                                                                   Voltage Support                               of the current Transmission and
                                                                                                                                                                   Demand Response (DRP)                         Distribution pricing reviews. The
                                                  80                                                                                                                                                             move to more cost-reflective/
                                                                                                                                                                   Demand Charge Reduction
                                                                                                                                                                                                                 demand-responsive pricing is
                                                  60                                                                                                               Back-up Power
                                                                                                                                                                                                                 expected to enhance the battery
                                                                                                                                                                                                                 value as charges are further
                                                  40
                                                                                                                                                                   Tax Cost                                      profiled to increase the
                                                  20                                                                                                               Operating cost                                difference in prices between
                                                                                                                                                                                                                 periods of low and high system
                                                                                                                                                                   Capital cost
                                                   0                                                                                                                                                             demand.
                                                               COST 2017

                                                                                      20% DEMAND
                                                                                   CHARGE AVOIDED
                                                                                       + DRP + LOW
                                                                                    SECURITY VALUE

                                                                                                          40% DEMAND
                                                                                                      CHARGE AVOIDED +
                                                                                                      MEDIUM SECURITY
                                                                                                                 VALUE

                                                                                                                          ALL SERVICES +
                                                                                                                          HIGH SECURITY
                                                                                                                                  VALUE

                                                                                                                                              COST 2020

                                                                                                                                                                                                            „„   The addition of multi-market
                                                                                                                                                                                                                 based services is required to
                                                                                                                                                                                                                 generate attractive returns after
                                                                                                                                                                                                                 2020.

                                                                                                                                                                                                             TRANSPOWER NEW ZEALAND LIMITED 26
BATTERY STORAGE
IN NEW ZEALAND

 CASE STUDY 5

BATTERY AT A RESIDENTIAL PROPERTY

Battery size:        3kW/6.5kWh

We considered two situations: one where the house already has a 3kW solar PV already installed
(as a sunk cost), and one where the house has a battery only.
We assumed the home consumes 20kWh/day (the national average for electricity use), and pays
approximately 26c/kWh for electricity consumed.
The house with the solar PV can produce 10kWh/day. 30% of this is consumed by the home and
70% is used to fully charge the battery; any residual energy is bought back by the electricity
retailer at 8c/kWh.16
Figure 16 shows the potential value of
the revenue streams compared to the
cost of the battery, and the forecast                     Figure   16
                                                              Figure 16
costs for 2020 and 2026.                                  COSTS  AND
                                                             Costs andPOTENTIAL     REVENUE
                                                                       potential revenue       STREAMS
                                                                                         streams for batteryFOR
                                                                                                             at aBATTERY
                                                                                                                  residentialAT A
                                                                                                                              home
                                                          RESIDENTIAL HOME
                                                                                    12
                                                                                                                                                                                                                                     Case 5

                                                                                                                                                                                                                                 3kW/6.5kWh
                                                                                                                                                                                                                                      UNI
                                                                                    10
                                                                                                                                                                                                                                  Residential

                                                                                     8                                                                                                                                       Frequency Regulation
                                                             Present Value $(000)

                                                                                                                                                                                                                             Spin / Non-Spin Reserves

                                                                                     6                                                                                                                                       Back-up Power

                                                                                                                                                                                                                             Increased PV Self-
                                                                                                                                                                                                                             Consumption
                                                                                     4
                                                                                                                                                                                                                             Time-of-Use Bill
                                                                                                                                                                                                                             Management

                                                                                     2
                                                                                                                                                                                                                             Operating Cost

                                                                                                                                                                                                                             Capital Cost

                                                                                     0
                                                                                         COST 2017

                                                                                                     ENERGY ARBITRAGE
                                                                                                          & ANCILLARY

                                                                                                                        + HIGH SECURITY
                                                                                                                                 VALUED

                                                                                                                                          +PV + ANCILLARY
                                                                                                                                                 SERVICES

                                                                                                                                                                  PV + HIGH
                                                                                                                                                            SECURITY VALUED

                                                                                                                                                                                + FULLY COST
                                                                                                                                                                              REFLECTIVE +PV

                                                                                                                                                                                               COST 2020

                                                                                                                                                                                                           COST 2026

                                                      The following table explores the revenue streams for this case study.

   16
        Concept Consulting: Electric, solar, and batteries in NZ Vol2 page 28, June 2016. This is a blended rate of Low User Fixed Charge & Standard
        tariffs and is broadly in line with the Ministry of Business, Innovation and Employment 2016 Quarterly Retail Sales Survey Report.

                                                                                                                                                                                                                       TRANSPOWER NEW ZEALAND LIMITED 27
BATTERY STORAGE
IN NEW ZEALAND

Table 10
REVENUE STREAMS FOR BATTERY AT RESIDENTIAL HOME

 PRIMARY PURPOSE                   REVENUE STREAMS

                                     Energy                         Ancillary      Solar
                                                    Security                                                                       Notes
                                    Arbitrage                       Services        PV

     No Solar PV                                                                            Reserves market
     + Energy arbitrage                  $               $              $                   Energy on TOU tariff17
     + Reserves                                                                             Fixed rate consumption based lines charges

     No Solar PV
                                                                                            Value of Lost Load (VOLL) is increased to national average of
     + Customer Values
                                         $              $$              $                   $25,300/MWh
     Security of Supply
                                                                                            Frequency Keeping Market
     +Frequency

     PV Self-Consumption
                                                                                            Maximise PV self-consumption – based on avoiding
     Maximised
                                                        $$              $             $     Standard Tariff
     +Frequency
                                                                                            Fixed rate consumption based tariff
     + Reserves

     PV
                                                                                            Voll increased to national average of $25,300/MWh
     + Higher Value on
                                                        $$              $                   Base Case for Figure 24
     Security +Frequency
     + Reserves

                                                                                            Fully cost reflective tariffs replace standard flat tariffs -
     PV                                                                                     Indicative tariff structured18 to reflect estimated total cost of
     All services, with fully           $$               $              $                   system peak capacity
     cost-reflective tariffs                                                                PV avoided costs much reduced19 due to cost reflective
                                                                                            tariffs lowering solar value over day time low demand period

17
      TOU energy only tariff assumed to reflect on average 17c/kWh off-peak and 25c/KWh on-peak.
18
      Based on a strawman cost reflective tariff structure of: 8c/KWh overnight, 45c/kWh over peaks, 12c/kWh during the day and
      18c/kW in the evening. This is based on achieving bill-equivalency to the current average consumer’s bill of ~$2000/pa and
      assuming no fixed charges with a shape across the day that reflects typical system peak costs for network and energy.
19
      Feed-in tariffs are assumed to remain at 8c/kWh thus the PV avoided cost drops to 12c/kWh minus 8c/kWh = 4c/KWh.

                                                                                                                               TRANSPOWER NEW ZEALAND LIMITED 28
You can also read