Analysis of conflicts with wild carnivores in the Humid Chaco, Argentina
←
→
Page content transcription
If your browser does not render page correctly, please read the page content below
Animal Biodiversity and Conservation 44.2 (2021)                                                              251

Analysis of conflicts
with wild carnivores
in the Humid Chaco, Argentina

M. P. Kihn, N. Caruso, K. Iaconis,
M. J. Palacios González, L. Soler

Kihn, M. P., Caruso, N., Iaconis, K., Palacios González, M. J., Soler, L., 2021. Analysis of conflicts with wild
carnivores in the Humid Chaco, Argentina. Animal Biodiversity and Conservation, 44.2: 251–265, https://doi.
org/10.32800/abc.2021.44.0251

Abstract
Analysis of conflicts with wild carnivores in the Humid Chaco, Argentina. Interactions between humans and
carnivores tend to be conflictual, especially due to predation on domestic animals. As certain landscape
characteristics predispose the occurrence of carnivore attacks, spatial modelling of predation events can be
particularly useful when developing management plans. In this study we determined the incidence of preda-
tion on the mortality of domestic animals by interviewing local inhabitants. In addition, we identified the spatial
variables that explain the distribution of the conflicts and we created a two–scale model based on the Maxent
algorithm. The results showed that Puma concolor (41.2 %) and the foxes Lycalopex gymnocercus and Cer-
docyon thous (33.3 %) were the most conflictive species. Predation accounted for only 5.6 % of the causes
of domestic animal mortality. The distribution models showed that the most probable variables for predicting
conflicts were the distance from the roads, livestock density and the proportion of anthropized areas. High–risk
areas represented 28 % of the study area and were distributed in broad patches around the protected areas
and in the eastern sector of the area.

Keys words: Predation, Livestock, Maxent, Spatial variables

Resumen
Análisis de los conflictos con carnívoros silvestres en el Chaco Húmedo de Argentina. Las interacciones entre
humanos y carnívoros suelen tornarse conflictivas, en especial debido a la depredación de animales domésticos.
Ciertas características del territorio favorecen que se produzcan ataques de carnívoros, por lo que puede ser
muy útil elaborar modelos espaciales de los episodios de depredación a la hora de preparar planes de manejo.
En este trabajo determinamos la incidencia de la depredación en la mortalidad de los animales domésticos a
través de entrevistas a pobladores locales. Además, determinamos las variables espaciales que explican la
distribución de los conflictos y construimos un modelo en dos escalas basado en el algoritmo de Maxent. Los
resultados mostraron que el puma, Puma concolor (41,2 %) y los zorros Lycalopex gymnocercus y Cerdocyon
thous (33,3 %) fueron las especies más conflictivas. La depredación representó solo el 5,6 % de las causas
de mortalidad de los animales domésticos. Los modelos de distribución mostraron que las variables más pro-
bables para predecir los conflictos eran la distancia a carreteras, la densidad de ganado y la proporción de
superficie antropizada. Las zonas de alto riesgo representaron el 28 % del área de estudio y se distribuyeron
en amplios parches alrededor de las zonas protegidas y en el sector oriental del área.

Palabras clave: Depredación, Ganado, Maxent, Variables espaciales

Received: 1 X 20; Conditional acceptance: 7 I 21; Final acceptance: 14 VII 21

ISSN: 1578–665 X                                        © [2021] Copyright belongs to the authors, who license the
eISSN: 2014–928 X                                       journal Animal Biodiversity and Conservation to publish the
                                                        paper under a Creative Commons Attribution 4.0 License.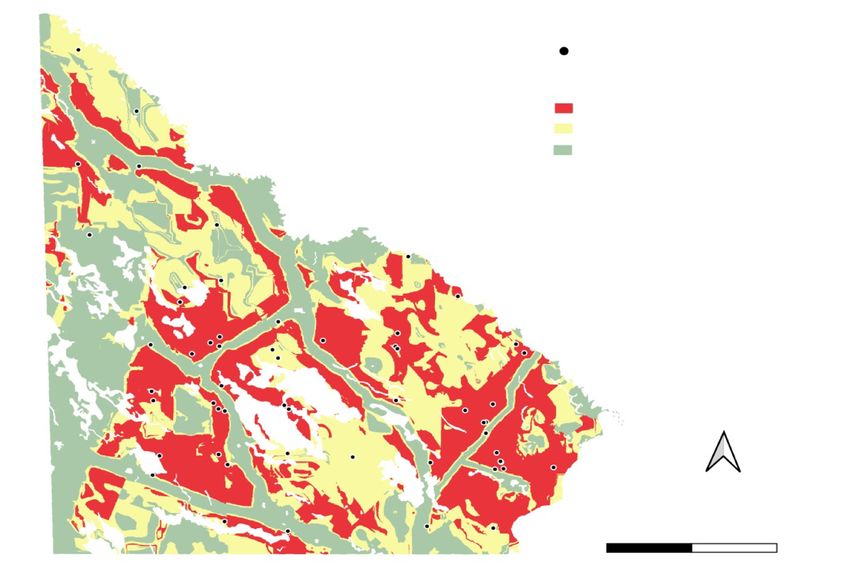
252                                                                                               Kihn et al.

M. P. Kihn, N. Caruso, L. Soler, Grupo de Ecología Comportamental de Mamíferos (GECM), Depto. de Biología,
Bioquímica y Farmacia, Universidad Nacional del Sur (UNS), San Juan 670, Bahía Blanca 8000, Buenos Aires,
Argentina; and Asociación Huellas, Asociación para el Estudio y la Conservación de la Biodiversidad, Bahía
Blanca 8000, Buenos Aires, Argentina.– N. Caruso, L. Soler, Instituto de Ciencias Biológicas y Biomédicas
del Sur, Universidad Nacional del Sur (UNS) – CONICET, San Juan 671, Bahía Blanca 8000, Buenos Aires,
Argentina.– K. Iaconis, Asociación Huellas, Asociación para el Estudio y la Conservación de la Biodiversidad,
Bahía Blanca 8000, Buenos Aires, Argentina.– M. J. Palacios González, Dirección General de Medio Ambiente,
Extremadura, Spain.

Corresponding author: M. P. Kihn. E–mail: melisakihn@gmail.com

ORCID ID: 0000–0002–4529–3084
Animal Biodiversity and Conservation 44.2 (2021)                                                                   253

Introduction                                                  to determine which environmental variables are most
                                                              associated with these conflicts.
The expansion of human activities in many ecosystems
has decreased the geographic range and popula-
tions of numerous carnivores and has also led to the          Material and methods
fragmentation of their habitats (Morrison et al., 2007;
Inskip and Zimmermann, 2009). As a consequence,               Study area
predators are forced to live in anthropized environments
where interactions with man may become conflictive            The research was carried out in the northeast of
(Rippel et al., 2014). Although there are other causes,       Chaco province, an area belonging to the Humid
such as the transmission of diseases, competition for         Chaco ecoregion (fig. 1). In Argentina, this ecore-
game and direct attacks on humans, the predation              gion encompasses the eastern half of the provinces
of domestic animals is the greatest source of conflict        of Chaco and Formosa, the north of Santa Fe and
between humans and carnivores, with lethal control            northwest of Corrientes (Morello et al., 2012). It is a
being the most common method used to reduce the               plain with a slope slightly inclined towards the east
impact (Inskip and Zimmermann, 2009). Such control            in which depressed environments predominate, so
can have a devastating effect on the size and distri-         it is prone to significant flooding. The predominant
bution of carnivore populations (Treves et al., 2011)         landscape is a mosaic of strips of well–drained high
and modify ecosystems, since they play an important           land with forests, accompanying the course of the
role in their regulation (Prugh et al., 2009).                rivers and alternating with low interfluves, estuaries
    Numerous studies on conflicts between humans and          and ravines, with features of grassland, savanna and
carnivores due to livestock predation have identified         scrubland (Naumann, 2006). The climate is temperate
characteristics of the landscape that favour such attacks     to humid and rainfall follows a longitudinal gradient,
(Zarco González et al., 2012; Miller, 2015; Sarmiento         with maximum records in the east of more than
Giraldo et al., 2016). As these characteristics are distri-   1,300 mm that decline in the west to 750 mm on the
buted in non–random patterns, their study can be used         border with the Dry Chaco (Ginzburg and Adámoli,
to create predictive models and diagrams to develop           2006). The ecoregion presents a remarkable diversity
conflict–mitigation strategies (Treves et al., 2011). Many    of wild fauna due to the heterogeneity of habitats,
researchers have used interviews or surveys with ex-          among which the community of carnivores includes
perts to determine the location of livestock attack events    fourteen species (Ginzburg and Adámoli, 2006).
(Van Bommel et al., 2007; Zarco González, et al. 2012;            The main livestock activity in Chaco province is
Broekhuis et al., 2017). Surveys can provide valuable         the extensive breeding of cattle, which mostly graze
information that is often impossible to obtain from other     on natural grassland. The other livestock species are
sources at a relatively low cost (Masenga et al., 2017).      mostly reared to complement other activities such as
    In the Humid Chaco of Argentina, much of the              cotton cultivation, hunting, forestry and fishing. Lives-
economy is based on agricultural production, generally        tock production in this area is characterized by a lack of
carried out in natural environments where conflicts           planning, a lack of facilities, and and sanitary deficien-
between humans and carnivores are often part of daily         cies (Subsecretaria de Planificación Económica, 2016).
life. In many cases the subsistence of rural people
is linked to raising livestock and poultry (Morello et        Surveys of local inhabitants
al., 2012). The presence of these carnivores is the-
refore potentially conflictive, especially that of larger     Data were obtained through surveys carried out in
species. However, information on the relationship of          two stages. Surveys in 2016 carried out in rural areas
the inhabitants with the carnivores in this region is         were aimed at local inhabitants and were oral and
scarcely documented. Soler et al. (2004) carried out          semi–structured (see annex). The survey sites were
the first diagnosis of the conservation situation of wild     chosen opportunistically based on the possibility of
carnivores in the provinces of Chaco and Corrientes,          access with the vehicle used, and in each of them the
showing that foxes Cerdocyon thous and Lycalopex              location was recorded with a GPS device. In 2019,
gymnocercus were the species mentioned by the                 surveys were sent by the Google forms application to
inhabitants as being the most conflictive, followed by        producers, extension workers of the National Institute
small felines, Herpailurus yagouaroundi and Leopardus         of Agricultural Technology (INTA) and park rangers.
geoffroyi. In several regions of Argentina, Puma con-         The questions were structured or closed. The survey
color is the carnivore that attacks domestic livestock        included a gridded and numbered image of the stu-
most frequently. Farmers consider it is highly harmful        dy area so that the respondents could identify cells
and admit to hunting it regularly (e.g., Luengos Vidal        with conflicts with carnivores (see annex). Each grid
et al., 2016).                                                covered an area of 400 km2, with a total of 44 grids
    In this study we explored the scope of conflicts          covering an area of 17,600 km2. The exact conflict site
between humans and carnivores and their spatial               within the cell was located based on the information
distribution in the Humid Chaco ecoregion in northern         provided by the respondents about the particular
Argentina. Our main objectives were to identify the           environments where conflicts occurred (e.g. areas
most conflictive species of wild carnivore and analyze        with dense vegetation, close to protected areas, far
their incidence on domestic animal mortality, and to          from towns, etc.) and with the help of a satellite image
develop spatial distribution models at different scales       extracted from Google Earth.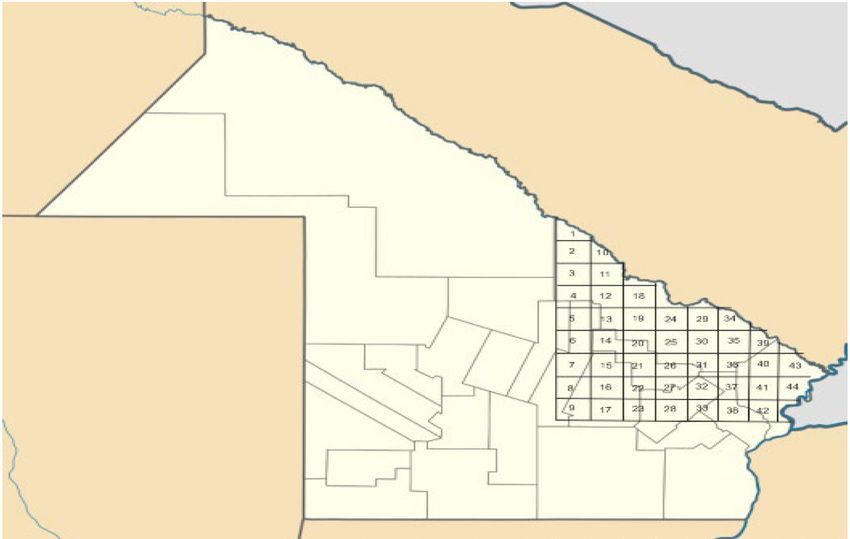
254 Kihn et al.
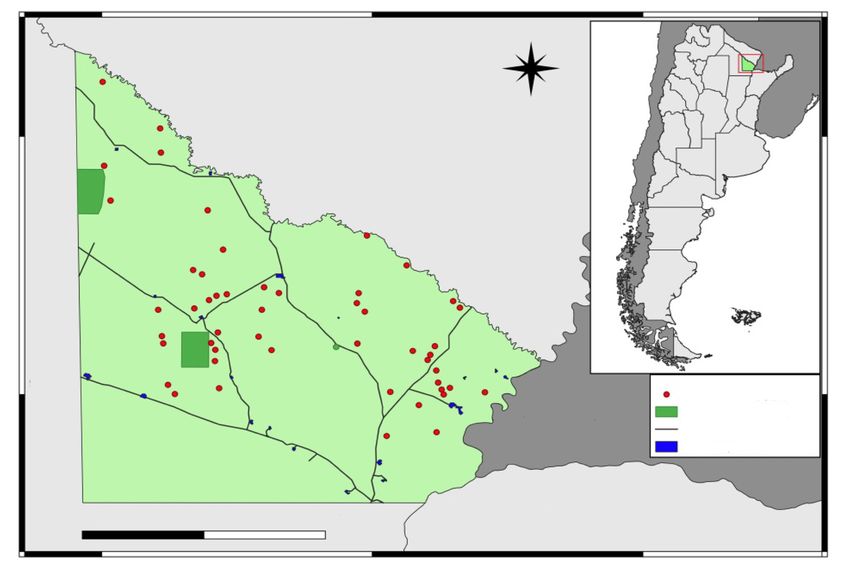
60º 0' O 59º 0' O
N
26º 0' S
Formosa
27º 0' S
Conflict location
Protected area
Paraguay Road
Human settlement
Corrientes
0 50 100 km
Fig. 1. Map showing the location of the study area in the province of Chaco, Argentina, and the location
of the sites with conflicts, together with some spatial characteristics used in the analysis.
Fig. 1. Mapa de la ubicación de la zona de estudio en la provincia del Chaco, en Argentina. Se muestran
la ubicación de los lugares donde se produjeron conflictos y algunas características especiales utilizadas
en el análisis.
Spatial variables were calculated using the neighborhood analysis with
the average function in QGIS using two sizes of radius
Spatial data were processed using the QGIS program (846 m and 2877 m). The different radius distances
(version 3.10.0, QGIS Development Team, 2019) that were selected to represent the approximate size of
included the geographical location of the points of the home range of P. concolor females: 26 km2 (De
conflicts indicated by the respondents, and the natural Angelo et al., 2011), and of mesocarnivores: 2.25 km2
and anthropogenic variables, potentially determining (Maffei and Taber, 2003; Luengos Vidal, 2009; Castillo
factors of the spatial distribution of conflicts. To select et al., 2019), because the carnivores’ perception of the
the variables, we considered the interviewees’ respon- landscape is often related to the size of their home
ses and various related studies (Treves et al., 2011; range (De Angelo et al., 2011).
Karanth et al., 2013; Miller, 2015; Rostro García et al., We evaluated the correlation between pairs of
2016; Broekhuis et al., 2017). Populated areas with variables using a Pearson correlation analysis (Le-
more than 200 inhabitants, estuaries and permanent gendre and Legendre, 2012) and no pair showed a
water bodies were excluded from the analysis, as they correlation greater than 60 %. It was thus decided to
are environments where there are no carnivores or use the entire set of variables in the models. They
livestock. For each selected variable, we constructed were then cropped to the same geographic extension
raster maps of 100 m resolution. Eight variables were and transformed into ASCII format for manipulation
included in the analysis (table 1). in the Maxent program.
To quantify the livestock density predictor variable,
the total heads of cattle, sheep, goats, pigs and horses Modeling and mapping of the probabilities of conflicts
was extracted from the National Agricultural Census
2008 (INDEC, 2008). This information was used to The modeling of the spatial distribution of conflict risk
create a vector map (heads/km2) of the study area. was developed in the MaxEnt 3.4.1 program (Maximum
All the variables were reprojected to the WGS 84/ Entropy Species Distribution Modeling: Phillips et al.,
UTM zone 21S coordinate system, which corresponds 2006). This software uses the algorithm of maximum
to the reference system for the study area. The entropy (the most uniform distribution possible) to
proportions of anthropized environment, herbaceous model the most probable geographic distribution of a
vegetation, arboreal vegetation, and livestock density species from data of occurrence. In this study we usedAnimal Biodiversity and Conservation 44.2 (2021) 255
Table 1. Variables used in the spatial models of predation risk to predict the probability of the presence
of conflicts between humans and carnivores.
Tabla 1. Variables utilizadas en los modelos espaciales del riesgo de depredación para predecir la
probabilidad de que se produzcan conflictos entre humanos y carnívoros.
Predictor
variable (unit) Prediction Reference Data source
Population
Lower risk of There is a strong association between INDEC (2010)
density
conflicts (number high human density and the loss of
of people/km2) carnivore populations (Woodroffe, 2000)
Distance Greater risk at The greatest number of attacks on livestock IGN (2017)
from greater distance occurs further away from human settlements
towns (m) from towns because predators avoid contact with humans
(Davie et al., 2014; Soh et al., 2014; Constant,
et al., 2015; Loveridge et al., 2016)
Distance Greater risk at The risk of predation is positively associated IGN (2017)
from greater distance with the distance from roads (Zarco González
roads (m) from roads et al., 2012; Balbuena Serrano, 2017; Soh et al.,
2014; Constant et al., 2015; Miller et al., 2015)
Livestock Higher risk at Livestock density is one of the strongest INDEC (2008)
density higher density predictors of predation by carnivore
(number of of livestock (Karanth et al. 2013; Carvalho et al., 2015)
heads/km2)
Distance from Greater risk at Human–wildlife conflicts of all kinds are UNEP–WCMC
protected a shorter distance concentrated on the borders of protected (2019)
areas (m) from protected areas (Van Bommel et al. 2007; Karanth
areas et al., 2013; Constant et al., 2015)
Proportion of Lower risk Carnivores avoid highly modified environments IGN (2017)
anthropized to higher preferring natural or relative conserved
environment proportion of sites (Caruso et al., 2017)
anthropized
environment
Proportion of Lower risk Open areas, such as grassland and wetlands, IGN (2017)
herbaceous to higher do not offer cover for hunters that stalk their
vegetation proportion of prey, such as pumas and other cats
herbaceous (Miller et al., 2015; Zarco Gonzales et al., 2012)
vegetation
Proportion of Higher risk Too much coverage can reduce the chance IGN (2017)
arboreal at intermediate of finding prey and prevents the growth
vegetation proportion of of grass consumed by livestock
arboreal (Rostro García et al., 2016)
vegetation
(land covered by
approximately 50 %
trees and shrubs)
it in an alternative context to measure the spatial risk data for the geographic area of interest. Based on this
of predation. The MaxEnt model requires two types information, MaxEnt estimates the distribution of those
of input data: georeferenced carnivore conflict cases areas that present the conditions for the occurrence
and raster maps with environmental and anthropogenic of conflicts.256 Kihn et al.
90 %
80 %
70 %
60 %
Presence
50 %
40 % Prey on
domestic animals
30 %
20 %
10 %
0%
Pca Gc Eb Cc Ll Lg Lp Hy Pco F
Carnivore species
Fig. 2. Percentages of the responses of people interviewed concerning the presence of carnivore species
and predation on domestic animals in the study area (N = 51): Pca, P. cancrivorus; Gc, G. cuja; Eb, E.
barbara; Cc, C. chinga; Ll, L. longicaudis; Lg, L. geoffroyi; Lp, L. pardalis; Hy, H. yagouaroundi; Pco, P.
concolor; F, foxes.
Fig. 2. Porcentaje de las respuestas de las personas encuestadas sobre la presencia de especies de
carnívoros y la depredación de animales domésticos en la zona de estudio (N = 51). (Para las abrevia-
turas de las especies de carnívoro, véase arriba.)
Performance of the model was evaluated using Pando and Peñas de Giles, 2007). The models with
Area Under the Curve (AUC) of Receiver Operat- AUC values between 0.7–0.9 can be considered as
ing Characteristic (ROC). This tool is widely used to moderate discrimination, whereas values > 0.9 indi-
measure the predictive capacity of a logistic regres- cate high discrimination (Rostro García et al., 2016).
sion model, with the result obtained being a direct Two models were made, one using the variables
measure of the discrimination capacity of the model. calculated with the scale less than 846 m in radius
AUC takes values close to 1 when there is a good fit and the other with those obtained for the scale greater
with the evaluation data and close to 0.5 when the fit than 2,877 m in radius. The models were run using the
is not better than that obtained by chance (Benito de automatic 'features' option, which uses an algorithm to
Livestock areas
Far from towns
Close to protected areas
Close to wooden areas
Dense vegetation
0% 20 % 40 % 60 %
Fig. 3. Environments most conducive to attacks of domestic animals by carnivores based on the perception
of the respondents (N = 16).
Fig. 3. Entornos más propicios para los ataques de carnívoros a animales domésticos según la percepción
de los encuestados (N = 16).Animal Biodiversity and Conservation 44.2 (2021) 257
100 %
90 %
80 %
70 %
60 % Carnivore attack
50 % Flood/drought
Theft/loss
40 %
Diseases
30 %
20 %
10 %
0%
1st 2nd 3rd 4th
Fig. 4. Main causes of mortality of domestic animals ranked from 1st to 4th according to the respondents
(N = 16).
Fig. 4. Principales causas de mortalidad de los animales domésticos ordenadas de la primera a la cuarta
por los encuestados (N = 16).
determine the most appropriate complexity based on P. cancrivorus (49 %). Regarding the predation of
the number of presence records (Syfert et al., 2013). domestic animals, 64.7 % of those surveyed knew of
Default settings were used and 10 replicates were attacks by carnivores, with P. concolor being the most
performed. A random subset corresponding to 75 % conflictive (41.2 %), followed by foxes (33.3 %) (fig. 2).
of the presence data was used as training to create Among the total of respondents who mentioned
the model and the remaining 25 % was used as test cases of conflict (N = 43), 51 % indicated that these
data to assess the precision of the training model. The were due to attacks on poultry, 44.2 % on small li-
'bootstrap' resampling technique was selected and the vestock (goats, sheep and pigs) and 9.3 % on large
'Cloglog' output was obtained, which is proportional to livestock (cows and horses). The latter cases occurred
the probability of conflicts (Rostro García et al., 2016). occasionally and the animals attacked were calves
In addition, the response curves of each variable were and foals.
obtained with graphs to illustrate how the prediction In relation to the perception of carnivores, 41.5 %
of the model changes with each variable studied. The of those surveyed expressed a positive perception,
maps obtained for each model were analyzed in QGIS. 39.2 % considered them harmful, 9.8 % showed indi-
The probability of conflicts was divided into three quan- fference and 5.9 % did not respond. In general, the
tiles to obtain the categories of conflict probability: high, negative opinions came from respondents linked to
medium, and low. Finally, we calculated the surface animal husbandry.
area that covered the category of high probability of In the 2019 surveys, participants were also asked
the presence of conflicts in the study area. if the carnivore attacks occurred in particular environ-
ments, to which 68.75 % answered yes, 12.5 % no, and
18.75% did not know of any particular associations.
Results The environments mentioned by those surveyed as
being the most conducive to carnivore attacks were
Surveys areas with dense vegetation (54.5 %), areas far from
towns (36.4 %), and environments close to protected
A total of 51 inhabitants were surveyed, 35 in 2016 areas (27.3 %) (fig. 3).
(62.8 % rural inhabitants; 11.4 % park rangers and se- However, the attack of carnivores was the least
curity; 25.8 % farm employees), and 16 in 2019 (75 % mentioned cause of loss of domestic animals; 61 %
producers and INTA extension workers and 25 % park of those surveyed (N = 16) cited floods and droughts
rangers). These surveys indicated that foxes were the as the most frequent cause, 16.7 % named theft or
most frequently observed carnivores (78.4 %), but the loss and, in the same percentage, diseases that affect
respondents did not distinguish between the two spe- animals after shortage of resources due to floods and
cies present in the area (C. thous and L. gymnocercus). droughts. Only 5.6 % ranked carnivore attacks as the
Secondly, they mentioned P. concolor (66.7 %) and first cause of mortality (fig. 4).
.258 Kihn et al.
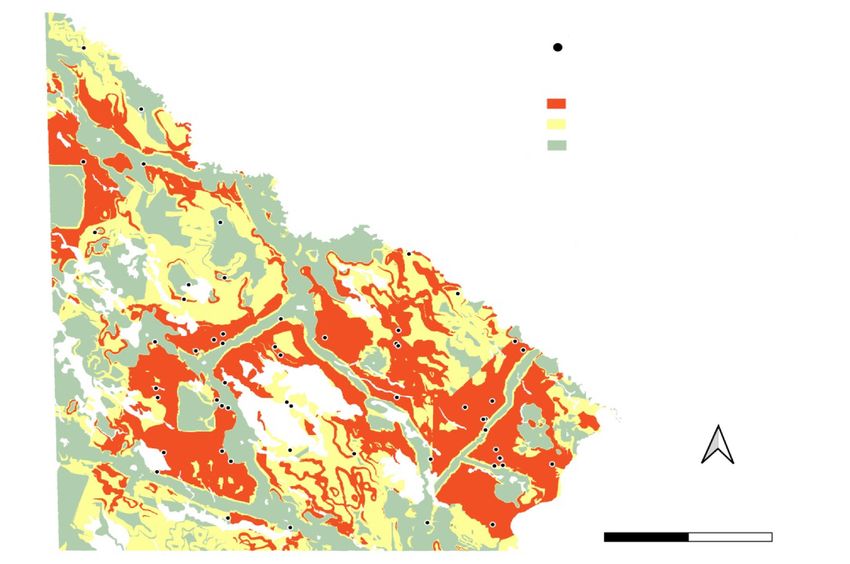
Presence of conflicts
Probability of conflicts
High
Medium
Low
N
0 25 50 km
Fig. 5. Distribution of the probability of conflicts with carnivores for the smaller–scale model (846 m radius)
in the northeast sector of Chaco province, Argentina.
Fig. 5. Distribución de la probabilidad de que se produzcan conflictos con carnívoros según el modelo
de menor escala (radio de 846 m) en el sector nororiental de la provincia del Chaco, en Argentina.
Conflict probability distribution models in the probability of conflicts was also observed with
the increase in the livestock density and with the
A total of 57 sites of presence of conflict with carni- increase in the distance from protected areas.
vores were obtained from both surveys, 20 of which The larger scale model (radius 2,877 m) also
corresponded to the surveys of 2016 and 37 to those presented moderate discrimination in relation to
of 2019. In the latter, the majority of respondents the AUC of the ROC curve (0.888) and a low stan-
indicated more than one site of conflict. For the dard error (0.012). The area corresponding to the
smaller scale model, the AUC value of the receiver 'high probability' category covered approximately
operated characteristic curve (ROC) was of moderate 4,958 km2, which represents 28.2 % of the study
discrimination (0.865) and the standard deviation was area (fig. 7).
low (0.022). The area corresponding to the 'high pro- The variables that contributed most to this model
bability' category covered approximately 5,005 km2, were livestock density (20.4 %), distance from roads
which represents 28.4 % of the total study area (fig. 5). (20.2 %) and proportion of anthropized area (13.9 %)
The variables that most contributed to the distri- (table 3).
bution model of the probability of conflicts with carni- The response curves of each variable indicated that
vores were: distance from roads (20.5 %), proportion the probability of conflicts decreased with the increase
of anthropized area (18.2 %) and livestock density in both the livestock density and the proportion of
(17.4 %) (table 2). anthropized area. The variable distance from roads
The response curves of each variable (fig. 6) generated the same response as for the previous
showed that the probability of conflicts increased at model (fig. 8).
a greater distance from the roads, but this happened The predictive maps made it posible to see that
up to 3 km, from when on the probability decreased the areas with a high probability of conflict were dis-
but increased again after 8 km. On the other hand, tributed in wide patches and in various sectors of the
the probability of conflicts was higher at proportions study area, at the eastern end, around the protected
between 0.2 and 0.3 of anthropized areas, after which areas, and on the edges of main roads, showing
it decreased as the proportion increased. A decrease considerable similarity for the two models.Animal Biodiversity and Conservation 44.2 (2021) 259
Discussion
Table 2. Percentage of contribution (P) of each
Our study provides novel data on the conflicts between variable to the smaller–scale Maxent model
humans and carnivores in the Argentine Humid Chaco. (846 m radius). This model had a mean ± SE
On the one hand, it provides complementary results area under the curve (AUC) of 0.865 ± 0.022.
to those previously obtained in the study area (Soler
et al., 2004) on the perceptions and attitudes of rural Tabla 2. Porcentaje de la contribución (P) de
inhabitants about carnivores and the identification of cada variable al modelo Maxent de menor
the most problematic species. On the other hand, it escala (radio de 846 m). Este modelo tenía
provides the first data on the environmental variables un área media ± EE debajo de la curva de
associated with conflicts and their spatial distribution, 0,865 ± 0,022.
which arose mainly as a result of the predation of
domestic animals whose distribution was associated
with anthropogenic variables, such as distance from Variable P
roads, livestock density and the proportion of anthro-
pized environment. Distance from roads 20.5
Proportion of anthropized area 18.2
Characterization of the conflicts Livestock density 17.4
Distance from protected areas 13.2
Through the surveys we found that the mountain lion
Distance from towns 12.0
P. concolor and foxes C. thous and L. gymnocercus
were considered the most conflictive species due to Proportion of arboreal vegetation 7.5
attacks on small livestock and poultry. Similar results Population density 7.1
were found in research carried out in other regions Proportion of herbaceous vegetation 4.1
of the country, such as the central mountainous area
(Pia, 2013), the central east (Caruso et al., 2017), the
high Andean area of the northwest (Lucherini et al.,
2016), and Patagonia Argentina (Novaro et al., 2017),
and also in other areas of South America (Uruguay: species in recent years in areas where it had previ-
Cravino et al., 1999; Bolivia: Pacheco et al., 2004). ously been thought to be extinct. However, Quiroga
In contrast to the results obtained by Soler et al. et al. (2016) found a low density of pumas in the
(2004), in the present study the cases of predation Western Chaco, assuming that this could be mainly
by P. concolor represented a high proportion. This due to retaliation by local ranchers in response to
might be due to a possible increase in the number goat predation. Therefore, the density of the spe-
of pumas in recent years. Recent studies indicate cies should be corroborated with specific studies in
that in nearby regions the species has recolonized the different areas. Pumas can cause considerable
areas where it had previously been eliminated, for economic loss when an attack involves the death of
example in the provinces of Entre Ríos (Bonnot et several animals (Pacheco et al., 2004) as is common
al., 2011; Muzzachiodi, 2012; Carmarán, 2013), behavior of the female during the breeding season,
Corrientes (Soler and Cáceres, 2008) and Buenos according to several respondents. Its impact on the
Aires (Chimento and De Lucca, 2014), as well as in livestock, especially when they are with young, can
Uruguay (Martínez et al., 2010) and Brazil (Mazzoli, be very harmful, since a single individual can kill
2012), where it has been possible to detect the several sheep and goats (Ruth and Murphy, 2009).
Proportion of
Distance from road anthropized area Livestock density
1.0 1.0 1.0
Probability
of conflict
0.5 0.5 0.5
0.0 0.0 0.0
0 39320.447 m 0 1 34.106 101.54
Fig. 6. Response curves of the Maxent model on the smaller scale, showing the relationship between
the variables that contribute most to the model and the probability of the presence of conflicts.
Fig. 6. Curvas de respuesta del modelo de Maxent en menor escala que muestran la relación entre las
variables que más contribuyen al modelo y la probabilidad de que se produzcan conflictos.260 Kihn et al.
Presence of conflicts
Probability of conflicts
High
Medium
Low
N
0 25 50 km
Fig. 7. Distribution of the probability of conflicts with carnivores for the larger–scale model (2,877 m
radius) in the northeast sector of Chaco province, Argentina.
Fig. 7. Distribución de la probabilidad de que se produzcan conflictos con carnívoros según el modelo
de mayor escala (radio de 2.877 m) en el sector nororiental de la provincia del Chaco, en Argentina.
In the case of the other species mentioned as to an actual threat. People's perceptions do not al-
conflictive in this study, and as reported by Soler et ways match the real behavior of carnivores as they
al. (2004), foxes are the most problematical preda- can be shaped by social and cultural influences,
tors, followed by H. yagouaroundi, L. geoffroyi, C. economic pressure, personal values, and historical
brachyurus and C. chinga. Both species of foxes, events (Bruskotter and Wilson, 2014; Suryawanshi et
L. gymnocercus in particular, would be the most al., 2013). Moreover, farmers may overestimate the
common carnivores in the study area, in the Dry presence of conflictive species (Caruso et al., 2017)
Chaco (Paulucci, 2018) and in other ecoregions of and the levels of mortality caused by predation due
Argentina such as the Monte and the Pampa (Luen- to confusion with post–mortem mutilation (Cravino et
gos Vidal et al., 2019). These species are generally al., 1999). In general, the respondents had not kept
considered predators of lambs and poultry, despite track of the number of lost animals, and thiscould
the fact that previous studies on their trophic niche, also have led them to overestimate losses caused by
in the same study area, did not report any signs of predators. Besides, predation of poultry by domestic
domestic livestock in their diet (Iaconis, 2015). On dogs might account for the harm caused by foxes
the contrary, the most commonly consumed items being overestimated.
mentioned were insects, small mammals, and fruit Our sampling to measure perceptions included
(Iaconis, 2015). Likewise, studies carried out in Brazil diverse perspectives from the people living in the
(Pradella Dotto, 1997) and in Uruguay (Cravino et al., study area. The results showed that the perception
1999) did not present sufficient evidence to consider of carnivores varied according to the occupation of
L. gymnocercus as an important predator of livestock. the respondent, with positive opinions coming from
Other studies carried out in the Dry or Western conservation agents and agricultural advisors, proba-
Chaco of Argentina showed that fruit predominated bly due to their better understanding of the ecological
in the diet of L. gymnocercus, and the predation on role of carnivore species and appreciation of nature.
domestic cattle was insignificant (Varela et al., 2008). Several studies have shown that human perceptions
The predation mentioned by respondents would thus of wildlife are affected not only by educational level
appear to be due to a perceived threat rather than (Conforti and de Azevedo, 2003; Røskaft et al.,Animal Biodiversity and Conservation 44.2 (2021) 261
2007), but also by economic interests, so it can be
expected that people who rear animals may have Table 3. Percentage of contribution (P) of each
negative opinions. variable to the larger–scale Maxent model
The prevalence of causes of mortality of domestic (2,877 m radius). This model had a mean ± SE
animals that are not related to predation indicates that area under the curve (AUC) of 0.888 ± 0.012.
conflicts with carnivores in the study area are relatively
less relevant than in previously mentioned areas such Tabla 3. Porcentaje de la contribución (P) de
as northern Patagonia (Novaro et al., 2017) and the cada variable al modelo Maxent de mayor
southwest of Buenos Aires province (Guerisoli et al., escala (radio de 2.877 m). Este modelo tenía
2017) where predation was considered the main cause un área media ± EE debajo de la curva de
of livestock loss. In the Humid Chaco the rearing of 0,888 ± 0,012.
goats and sheep is lower than in these two regions
(INDEC, 2008) and large livestock –that are predomi-
nant in our study area– are less vulnerable to attack Variable P
by carnivores than small livestock, which is a feasible
explanation for the low rate of predation. Diseases Livestock density 20.4
and cycles of floods and droughts under conditions Distance from roads 20.2
of scarce adoption of agricultural technology created Proportion of anthropized area 13.9
the greatest losses. Cravino et al. (1999) reported that Proportion of herbaceous vegetation 12.8
producers in Uruguay recognized that the mortality of Distance from protected areas 9.0
lambs due to climatic causes far exceeded that ascribed
to predation even though hunting and the placement Distance from towns 8.7
of poison and traps for foxes was a common practice. Proportion of arboreal vegetation 7.7
Population density 7.3
Spacial distribution of the conflicts
The results of the spatial risk modeling of the con-
flicts between humans and carnivores showed that
regardless of the scale of analysis, the variables that presence. On the other hand, our results might reflect the
contributed most to explaining the distribution of the use of roads by carnivores for their dispersal within their
conflicts were the distance from roads, the proportion territories, which could be particularly true in areas with
of anthropized environment, and livestock density. All of dense vegetation, such as in crop fields, grasslands, and
these variables are associated with human presence, scrublands. Local roads may enable permeability through
suggesting that carnivore behavior could be strongly habitat structures (Červinka et al., 2013), resulting in a higher
determined by human activities and infrastructure. The proportion of conflicts. Many large species of predators move
distance from the roads showed a maximum probability on roads with low traffic, as reported found by Forman and
of conflict within 3 km. This result coincides with that Alexander (1998). Wolves, for example, may select roads
documented by Miller et al. (2015) in India where the of low use as travel routes (e.g., Whittington et al., 2005).
risk of attacks on livestock by tigers (Panthera tigris) Research on the use of the roads by carnivores in the area
reached its maximum point at 1 km from the roads, a could shed light on this assumption.
value which could represent a threshold distance, as In our study area, the livestock density showed a nega-
here livestock can access quality pastures and carni- tive relationship with respect to the probability of conflicts,
vores can access prey without the inhibition of human that is, the higher the livestock density, the lower the risk of
Proportion of
Distance from road anthropized area Livestock density
1.0 1.0 1.0
Probability
of conflict
0.5 0.5 0.5
0.0 0.0 0.0
0 39894.359 m 0 1 34.106 68.441
Fig. 8. Response curves of the Maxent model on the larger scale, showing the relationship between
the variables with the greatest contribution to the model and the probability of the presence of conflicts.
Fig. 8. Curvas de respuesta del modelo de Maxent en mayor escala que muestran la relación entre las
variables que más contribuyen al modelo y la probabilidad de que se produzcan conflictos.262 Kihn et al.
predation. This may seem contradictory and contrary to in our study. This potential bias can have an impact
that recorded by Karanth et al. (2013) and Carvalho et on the modeling process and give results that reflect
al. (2015), who concluded that high livestock densities sampling effort rather than the actual distribution of a
were related to a higher risk of predation. However species or process (Syfert et al., 2013).
Zarco González et al. (2012) showed the existence of a On the other hand, it is possible that other factors,
negative relationship for the cases of puma predation, such as the abundance of prey, could be important
as in our research, which in their case might be due to predictors of the distribution of conflicts, despite the
the fact that the livestock were kept in protected yards fact that they were not taken into account in this
and far from wooded areas. On the other hand, we think study due to the lack of such information. Moreover,
that these results may also be due to the fact that a our study did not consider any possible differences,
higher livestock density is associated with degraded en- in particular, of the predation by each of the species
vironments and a higher density of human settlements. that make up the carnivore guild in this region, so it
However, our results could be explained on the basis would be important to take this into account in future
of the sampling method implemented in 2016, where studies. The nature of the surveys did not allow the
the surveys were concentrated in the eastern sector of interviewers to verify which species of carnivores were
the study area where the livestock density was lower responsible for the attacks and, therefore, we grouped
than in the western sector. Uniform sampling would be all the data to generate a map of the general risk of
necessary to define the influence of this variable on the conflicts. The environmental variables had almost the
distribution of conflict probabilities. Finally, it is neces- same influence in both scales of analysis, so we can
sary to bear in mind that we are studying a community assume that the presence of conflicts in our study area
of carnivores where, in general, mesocarnivores prey does not depend on the scales we used, unlike those
preferentially on poultry, whose distribution and density found by several studies that analyzed the dependency
were not analyzed. Future research should consider a of the spatial scale on the predation events (Miller et
more homogeneous sampling design, considering the al., 2015; Rostro García et al., 2016; Broekhuis et al.,
probabilities of attacks by pumas and mesocarnivores 2017). On the other hand, no significant differences
separately and accompanied by a distribution map of were observed in the distribution of conflicts in the
the density of poultry. study area, corroborating the importance of the three
The lower probability of conflict in highly altered variables that contributed most to the models.
environments could indicate that carnivores avoid de- Although the conflict probability maps showed a wide
graded areas, which supports our prediction. Although distribution of the areas with the highest probability,
human activities can affect all species of carnivores, the respondents identified other causes of mortality of
this effect varies depending on the ecological and domestic animals that produce more losses than preda-
behavioral attributes of each species (Caruso et al., tion. Dissemination campaigns that provide information
2016). For example, the puma prefers less degraded related to improving livestock management practices
sites and is seriously affected by habitat destruction, are thus recommended. Monitoring cases of predation
although it is able to tolerate some degree of frag- and community workshops should be organized to
mentation of natural environments (De Angelo et al., agree on strategies aimed at preventing predation and
2011). On the other hand, L. gymnocercus and L. promoting coexistence with the native fauna.
geoffroyi can inhabit highly modified areas (Pereira
et al., 2012; Caruso et al., 2016), demonstrating a
degree of ecological plasticity that allows them to Acknowledgements
tolerate human disturbance, and they survive even
in strictly agricultural areas (Pereira et al., 2012). To the Cátedra de Fisiología Animal of the Departa-
However, it can not be overlooked that the absence, mento de Biología Bioquímica y Farmacia, Universidad
or lower density, of carnivores in anthropized envi- Nacional del Sur (Argentina) for facilitating the space
ronments may also be due to their elimination by the for the analysis of the information. We also thank Dr.
inhabitants and their dogs, or to a lower abundance Boló Bolaños and Sr. Céspedes for helping with the
of their natural prey (Pereira et al., 2012). logistics and accommodation for the development of
the project in the Eastern Chaco, and Juan de Franco
Conclusions and Rebecca Greenberg for their volunteering support
in the field. Finally, we wish to thank the inhabitants for
Our analysis of the distribution of conflicts is an their time and collaboration with the information they
estimate of the probability of their presence, and the- provided. The field study had the financial support of
refore, it is subject to the initial data that we decided the Zoo des Sables d’Olonne (France) and the ZACC
to incorporate as predictor variables. In addition, the Conference, Zoos and Aquariums: Commiting to Con-
geographic location of presence data may exhibit spa- servation (USA).
tial autocorrelation, and biases due to sampling.The
selection of the options offered by the Maxent software
can also affect the results. The location and intensity References
of data collection in wildlife studies are usually strongly
influenced by accessibility to the terrain. Samples are Balbuena Serrano, A., 2017. Modelos espaciales de
often collected in relatively accessible locations near to riesgo de depredación de animales domésticos
roads, urban settlements, and rivers, as was the case por grandes carnívoros en Brasil. M. Sc. Thesis,Animal Biodiversity and Conservation 44.2 (2021) 263 Universidad Autónoma del Estado de México. ros: un estudio de caso, con énfasis en la acción Benito de Pando, B., Peñas de Giles, J., 2007. Apli- de los zorros (Mammalia, Canidae). Veterinaria, cación de modelos de distribución de especies a 35: 24–41. la conservación de la biodiversidad en el sureste Davie, H. S., Murdoch, J. D., Lhagvasuren, A., Reading, de la Península Ibérica. GeoFocus, 7: 100–119. R. P., 2014. Measuring and mapping the influence of Bonnot, G., Muzzachiodi, N., Fulvio Perez, C., landscape factors on livestock predation by wolves Sauthier, W., Udrizar Sauthier, D.,011. Nuevos in Mongolia. Journal of Arid Environments, 103: registros de Puma concolor para la provincia 85–91, Doi: 10.1016/j.jaridenv.2014.01.008 de Entre Ríos, Argentina. Natura Neotropicalis, De Angelo, C., Paviolo A., Di Bitetti, M., 2011. Differen- 42(1–2): 65–70. tial impact of landscape transformation on pumas Broekhuis, F., Cushman, S. A., Elliot, N. B., 2017. (Puma concolor) and jaguars (Panthera onca) in Identification of human–carnivore conflict hotspots the Upper Paraná Atlantic Forest. Diversity and to prioritize mitigation efforts. Ecology and Evolu- Distributions, 17(3): 422–36. tion, 7(24): 10630–10639. Forman, R. T. T., Alexander, L. E., 1998. Roads and Bruskotter, J. T., Wilson, R. S., 2014. Determining their major ecological effects. Annual Review where the wild things will be: using psychological of Ecology and Systematics, 29: 207–231, Doi: theory to find tolerance for large carnivores. Con- 10.1146/annurev.ecolsys.29.1.207 servation Letters, 7: 158–65. Ginzburg, R., Adámoli, J., 2006. Situación ambiental Carmarán, A., 2013. Estudio exploratorio de Puma en el Chaco Húmedo. In: La situación ambiental concolor (Linnaeus, 1771) en el Parque Nacional argentina 2005: 103–113 (A. Brown, U. Martínez Pre Delta y zona de influencia, Provincia de Entre Ortíz, M. Acerbi, J. Corcuera, Eds.). Fundación Ríos, Argentina. Revista Biológica, 16: 83–95. Vida Silvestre, Buenos Aires. Carvalho, E. A. R., Zarco González, M. M., Monroy Guerisoli, M. M., Luengos Vidal, E., Franchini, M., Vilchis, O., Morato, R. G., 2015. Modeling the Caruso, N., Casanave, E. B., Lucherini, M., 2017. risk of livestock depredation by jaguar along the Characterization of puma–livestock conflicts in ran- Transamazon highway. Basic and Applied Ecology. gelands of central Argentina. Royal Society Open 16(5): 413–419, Doi: 10.1016/j.baae.2015.03.005 Science, 4: 170852, Doi: 10.1098/rsos.170852 Caruso, N., Lucherini, M., Fortin, D., Casanave, E. B., Iaconis, K. M., 2015. Hábitos alimenticios de algunos 2016. Species–specific responses of carnivores to carnívoros del nordeste argentino e implicancias human–induced landscape changes in central Ar- en su conservación. Unpublished B. Sc. thesis, gentina. Plos One, 11(3): e0150488, Doi: 10.1371/ Universidad Nacional del Sur, Argentina. journal.pone.0150488 IGN, 2017. Capas de información geoespacial estan- Caruso, N., Luengos Vidal, E. L., Guerisoli, M., Luche- darizadas según normas de IDERA. https://www. rini, M., 2017. Carnivore occurrence: do interview– ign.gob.ar/NuestrasActividades/InformacionGeo- based surveys produce unreliable results? Oryx, espacial/CapasSIG [Accessed on August 2019]. 51(2): 240–245, Doi: 10.1017/S0030605315001192. INDEC, 2008. Censo Nacional Agropecuario 2008. Castillo, D. F., Luengos Vidal, E. M., Caruso, N. Available online at: https://www.indec.gob.ar/indec/ C., Manfredi, C., Lucherini, M., Casanave, E. B., web/Nivel4-Tema-3-8-87 [Accessed on August 2019. Spatial organization and habitat selection of 2019]. Geoffroy’s cat in the Espinal of central Argentina. – 2010. Censo Nacional de Población, Hogares y Mammalian Biology 94: 30–37. Viviendas 2010 y geografía y códigos geográficos Červinka, J., Šálek, M., Padyšáková, E.,, Šmilauer, P., del Sistema Estadístico Nacional. Available online 2013. The effects of local and landscape–scale ha- at: http://www.indec.gob.ar/codgeo.asp [Accessed bitat characteristics and prey availability on corridor on August 2019]. use by carnivores: A comparison of two contrasting Inskip, C., Zimmermann, A., 2009. Human–felid conflict: farmlands. Journal for Nature Conservation, 21(2): a review of patterns and priorities worldwide. Oryx, 105–113, Doi: 10.1016/J.JNC.2012.11.004 43: 18–34, Doi: 10.1017/S003060530899030X Chimento, N., De Lucca, E., 2014. El puma (Puma Karanth, K. K., Gopalaswamy, A. M., Prasad, P. K., concolor) recoloniza el centro y el este del ecosis- Dasgupta, S., 2013. Patterns of human–wildlife tema de las Pampas. Historia Natural, 4(2): 13–51. conflicts and compensation: Insights from Wes- Conforti, V. A., de Azevedo, F. C., 2003. Local tern Ghats protected áreas. Biological Conser- perceptions of jaguars (Panthera onca) and pu- vation, 116: 175–185, Doi: 10.24272/j.issn.2095- mas (Puma concolor) in the Iguacu National Park 8137.2018.056 area, south Brazil. Biological Conservation, 111: Legendre, P., Legendre, L., 2012. Numerical Ecology, 215–221, Doi: 10.1016/S0006-3207(02)00277-X 3th edition. Elsevier, Amsterdam. Constant, N. L., Bell, S., Hill, R. A., 2015. The im- Loveridge, A. J., Valeix, M., Elliot, N. B., Macdonald pacts, characterisation and management of hu- D. W., 2016. The landscape of anthropogenic mor- man–leopard conflict in a multi–use land system tality: how African lions respond to spatial variation in South Africa. Biodiversity and Conservation, in risk. Journal of Applied Ecology. 54: 815–825, 24: 2967–2989, Doi: 10.1007/s10531-015-0989-2 Doi: 10.1111/1365-2664.12794 Cravino, J. L., Calvar, J. C., Poetti, M. A., Berrutti, N. Lucherini, M., Cruz, A., Fajardo Quispe, U., Iriarte A., Fontana, M. E., Brando A., Fernández, J. A., Walton. A., Merino, M. J., Reppucci, J. I., Se- 1999. Análisis holístico de la predación de corde- púlveda, C., Tellaeche, C. G., Villalobos Aguirre,
264                                                                                                       Kihn et al.

   R., Villalba, L., 2016. Conflicto entre humanos y            Doi: 10.1644/06-MAMM-A-124R2.1
   pequeños felinos andinos. In: II. Conflictos entre        Muzzachiodi, N., 2012. Nuevo registro de puma
   felinos y humanos en América Latina: 377–387                 (Puma concolor) en la provincia de Entre Ríos,
   (C. Castaño Uribe, C. A. Lasso, R. Hoogesteijn,              Argentina. Nótulas Faunísticas (segunda serie)
   A. Díaz Pulido, E. Payán, Eds.). Fauna Silvestre             100: 1–4.
   Neotropical. Instituto de Investigación de Recursos       Naumann, M., 2006. Atlas del Gran Chaco Sudameri-
   Biológicos Alexander von Humboldt (IAvH), Bogotá.            cano. Sociedad Alemana de Cooperación Técnica
Luengos Vidal, E. M., 2009. Organización espacial               (GTZ). ErreGé, Asoc., Buenos Aires.
   de Pseudalopex gymnocercus en los pastizales              Novaro, A. J., González, A., Pailacura, O., Bolgeri,
   pampeanos. Ph.D. thesis, Universidad Nacional                M. J., Hertel, M. F., Funes, M. C., Walker, R. S.,
   del Sur, Argentina.                                          2017. Manejo del conflicto entre carnívoros y ga-
Luengos Vidal, E. M., Guerisoli, M., Caruso, N.,                nadería en Patagonia utilizando perros mestizos
   Casanave, E. B., Lucherini, M., 2016. Conflictos             protectores de ganado. Mastozoología Neotropical,
   con el puma en el sur del Espinal argentino. In:             24(1): 47–58.
   II. Conflictos entre felinos y humanos en América         Pacheco, L., Lucero, A., Villca, M., 2004. Dieta del
   Latina: 363–375 (C. Castaño Uribe, C. A. Lasso,              puma (Puma concolor) en el Parque Nacional
   R. Hoogesteijn, A. Díaz Pulido, E. Payán, Eds.).             Sajama, Bolivia y su conflicto con la ganadería.
   Fauna Silvestre Neotropical. Instituto de Inves-             Ecología en Bolivia, 39(1): 75–83.
   tigación de Recursos Biológicos Alexander von             Paulucci, J., 2018. El ensamble de carnívoros me-
   Humboldt (IAvH), Bogotá.                                     dianos y pequeños de la Reserva de Recursos
Luengos Vidal, E., Farías A., Valenzuela, A. E. J.,             La Fidelidad (Chaco): estado poblacional y su
   Caruso, N., 2019. Lycalopex gymnocercus. In: Ca-             relación con variables ambientales. B. Sc. thesis,
   tegorización 2019 de los mamíferos de Argentina              Universidad Nacional de Córdoba, Argentina.
   según su riesgo de extinción (SAyDS–SAREM,                Pereira, J., Walker, R., Novaro, A., 2012. Effects of
   Eds.). Lista Roja de los mamíferos de Argentina.             livestock on the feeding and spatial ecology of
   Digital version available online at: http://cma.sarem.       Geoffroy's cat. Journal of Arid Environments, 76:
   org.ar [Accessed on 21 July 2021]                            36–42.
Maffei, L., Taber, A., 2003. Área de acción, actividad       Phillips, S. J., Anderson, R. P., Schapire, R., 2006.
   y uso de hábitat del zorro patas negras, Cerdo-              Maximum entropy modeling of species geogra-
   cyon thous, en un Bosque seco. Mastozoología                 phic distributions. Ecological Modelling, 190(3–4):
   Neotropical. 10: 154–160.                                    231–259.
Martínez, J. A., Rudolf, J. C., Queirolo D., 2010.           Pia, M. V., 2013. Evaluación del conflicto entre los
   Puma concolor (Carnivora, Felidae) en Uruguay:               carnívoros tope y productores ganaderos colin-
   situación local y contexto regional. Mastozoología           dantes al parque nacional quebrada del condorito,
   Neotropical, 17: 153–159.                                    sierras grandes de córdoba, argentina. Nótulas
Masenga, H. E., Lyamuya, R. D., Eblate Mjingo, E.,              Faunísticas, 117: 1–10.
   Fyumagwa, R. D., Røskaft, E., 2017. Communal              Pradella Dotto, J., 1997. Estudo da dieta de Pseuda-
   knowledge and perceptions of African wild dog                lopex gymnocercus (Fischer, 1814) e de Cerdocyon
   (Lycaon pictus) reintroduction in the western part           thous (Linnaeus, 1766) (Mammalia, Canidae) e
   of Serengeti National Park, Tanzania. Academic               sua relaçao com a mortalidade de cordeiros no
   Journals, 9(5): 122–129.                                     Rio Grande do Sul. M. Sc. thesis, Universidade
Mazzoli, M., 2012. Natural recolonization and subur-            Catolica do Rio Grande do Sul, Brasil.
   ban presence of pumas (Puma concolor) in Brazil.          Prugh, L. R., Stoner, C. J., Epps C. W., Bean W. T.,
   Journal of Ecology and the Natural Environment,              Ripple W. J., Laliberte A. S., Brashares J. S., 2009.
   4(14): 344–362.                                              The rise of the mesopredator. BioScience, 59(9):
Miller, J. R. B., 2015. Mapping attack hotspots to              779–791, Doi: 10.1525/bio.2009.59.9.9
   mitigate human–carnivore conflict: approaches             QGIS Development Team, 2019. QGIS Geographic
   and applications of spatial predation risk modeling.         Information System. Open Source Geospatial
   Biodiversity and Conservation, 24(12): 2887–2911,            Foundation. Available online at: http://qgis.osgeo.
   Doi: 10.1007/s10531-015-0993-6                               org [Accessed on June 2019].
Miller, J. R. B, Jhala, Y. V., Jena, J., Schmitz, O. J.,     Quiroga, V. A., Noss, A. J., Paviolo, A., Boaglio, G. I.,
   2015. Landscape–scale accessibility of livestock             Di Bitetti, M. S., 2016. Puma density, habitat use
   to tigers: implications of spatial grain for modeling        and conflict with humans in the Argentine Chaco.
   predation risk to mitigate human–carnivore con-              Journal for Nature Conservation, 31, 9–15, Doi:
   flict. Ecology and Evolution, 5: 1354–1367, Doi:             10.1016/j.jnc.2016.02.004
   10.1002/ece3.1440.                                        Rippel, W. J., Estes, J. A., Beschta, R. L., Wilmers,
Morello, J., Matteucci, S. D., Rodríguez, A. F., Silva, M.      CH. C., Ritchie, E. G., Hebblewhite, M., Berger, J.,
   E., 2012. Ecorregiones y complejos ecosistémicos             Elmhagen, B., Letnic, M., Nelson, M. P., Schmitz,
   argentinos. Orientación Gráfica, Buenos Aires.               O. J., Smith, D. W., Wallach, A. D., Wirsing, A. J.,
Morrison, J. C., Sechrest, W., Dinerstein, E., Wilcove,         2014. Status and ecological effects of the world’s
   D. S., Lamoreux, J. F., 2007. Persistence of large           largest carnivores. Science, 343(6167): 1241484,
   mammal faunas as indicators of global human                  Doi: 10.1126/science.1241484
   impacts. Journal of Mammalogy, 88: 1363–1380,             Røskaft, E., Händel, B., Bjerke, T., Kaltenborn, B. P.,
Animal Biodiversity and Conservation 44.2 (2021)                                                             265

  2007. Human attitudes towards large carnivores             online at: https://www.economia.gob.ar/peconomica/
  in Norway. Wildlife Biology, 13: 172–185, Doi:             dnper/fichas_provinciales/SSPE-Informe_Producti-
  10.2981/0909-6396(2007)13[172:HATLCI]2.0.CO;2              vo_Provincial-Chaco.pdf [Accessed on December
Rostro García, S., Tharchen, L., Abade, L., Astaras,         2019].
  CH., Cushman, S. A., MacDonald, D.W., 2016.             Suryawanshi, K. R., Bhatnagar, Y. V., Redpath, S.,
  Scale dependence of felid predation risk: identifying      Mishra, C., 2013. People, predators and percep-
  predictors of livestock kills by tiger and leopard in      tions: patterns of livestock depredation by snow
  Bhutan. Landscape Ecology, 31: 1277–1298, Doi:             leopards and wolves. Journal of Applied Ecology,
  10.1007/s10980-015-0335-9                                  50: 550–560, Doi: 10.1111/1365-2664.12061
Ruth, T. K., Murphy, K., 2009. Cougar–prey rela-          Syfert, M. M., Smith, M. J., Coomes, D. A., 2013.
  tionships. In: Cougar: Ecology and Conservation:           The effects of sampling Bias and model complexity
  138–162 (M. Hornocker, Sh. Negri, Eds.). Univer-           on the predictive performance of MaxEnt species
  sity of Chicago Press, Chicago.                            distribution models. Plos One, 8(2): e55158, Doi:
Sarmiento Giraldo, M. V., Sánchez Palomino, P., Mon-         10.1371/journal.pone.0055158
  roy Vilchis, O., 2016. Depredación de ganado por        Treves, A., Martin, K. A., Wydeven, A. P., Wiedenhoeft,
  jaguar (Panthera onca) y puma (Puma concolor)              J. E., 2011. Forecasting environmental hazards and
  en las sabanas inundables de Arauca y Casanare,            the application of risk maps to predator attacks
  Colombia. In: II. Conflictos entre felinos y humanos       on livestock. BioScience, 61(6): 451–458, Doi:
  en América Latina: 103–121 (C. Castaño Uribe, C.           10.1525/bio.2011.61.6.7
  A. Lasso, R. Hoogesteijn, A. Díaz Pulido, E. Payán,     UNEP–WCMC, 2019. Protected Area Profile for
  Eds.). Fauna Silvestre Neotropical. Instituto de           Argentina from the World Database of Protected
  Investigación de Recursos Biológicos Alexander             Areas. Available online at: https://www.protected-
  von Humboldt (IAvH), Bogotá.                               planet.net/ [Accessed on August 2019].
Soh, Y. H., Carrasco, L. R., Miquelle, D. G., Jiang,      Van Bommel, L., Bij De Vaate, M. D., De Boer, W.
  J., Yang, J. Stokes, E. J., Tang, J., Kang, A., Liu,       F., Iongh, H. H., 2007. Factors affecting livestock
  P.,Rao, M., 2014. Spatial correlates of livestock          predation by lions in Cameroon. African Journal
  depredation by Amur tigers in Hunchun, China:              of Ecology, 45: 490–498.
  relevance of prey density and implications for pro-     Varela, O., Cormenzana Méndez, A., Krapovickas, L.,
  tected area management. Biological Conservation.           Bucher, H. B., 2008. Seasonal diet of the pampas
  169: 117–127, Doi: 10.1016/j.biocon.2013.10.011            fox (Lycalopex gymnocercus) in the Chaco dry
Soler, L., Carenton, J. M., Cáceres, C., Pérez, P.,          woodland Northwestern Argentina. Journal of
  Fleita, A., Taboada, A., Miller, G., González, R..         Mammalogy, 89(4): 1012–1019.
  2004. La conservación de los carnívoros silvestres      Whittington, J., St Clair, C. C., Mercer, G., 2005.
  del Nordeste Argentino a través de la participación        Spatial responses of wolves to roads and trails in
  de los pobladores locales. Imagen y respuestas             mountain valleys. Ecological Applications, 15(2):
  de los lugareños rurales hacia los predadores.             543–553. JSTOR, www.jstor.org/stable/4543373.
  In: Memorias VI Congreso Internacional sobre el            [Accessed on 21 July 2021]
  Manejo de Fauna Silvestre en la Amazonía y Lati-        Woodroffe, R., 2000. Predators and people: using
  noamérica (R. Bodmed, Ed.). Universidad Nacional           human densities to interpret declines of large
  de la Amazonía Peruana, Iquitos.                           carnivores. Animal Conservation, 3: 165–173, Doi:
Soler, L., Cáceres, F., 2008. Breve análisis sobre la        10.1111/acv.2000.3.issue-2
  presencia del puma en la provincia de Corrientes.       Zarco González, M. M., Monroy Vilchis, O., Rodríguez
  Biológica, Naturaleza, Conservación y Sociedad,            Soto, C., Urios, V., 2012. Spatial factors and
  10: 67–69.                                                 management associated with livestock predations
Subsecretaría de Planificación Económica, 2016. In-          by Puma concolor in Central Mexico. Human
  formes Productivos Provinciales–Chaco. Available           Ecology, 40(4): 631–638.
You can also read