An interactive tool for identifying patient subgroups based on arbitrary characteristics for medical research
←
→
Page content transcription
If your browser does not render page correctly, please read the page content below
DE GRUYTER                                                             Current Directions in Biomedical Engineering 2021;7(1): 20211111

Lena Spitz*, Vanessa M. Swiatek, Belal Neyazi, I. Erol Sandalcioglu, Bernhard Preim,
Sylvia Saalfeld

An interactive tool for identifying patient
subgroups based on arbitrary characteristics
for medical research

Abstract: We present an analysis tool for subgroup                          In this paper, we focus on the application area of
identification in medical research based on feature analysis.          intracranial aneurysms (IAs). IAs are pathological
Our use case is intracranial aneurysms. In the tool, an                deformations of the intracranial blood vessel walls that bear
aneurysm-of-interest’s most similar aneurysms within a                 the risk of rupture with the consequence of subarachnoid
database are found. Similarity is defined via user-selected            hemorrhages, which have a high mortality rate [1, 2]. The
parameters, which can be entirely arbitrary. Different                 morphological parameters of such aneurysms can be used as
interactive outputs and visualizations include a heatmap view          preliminary rupture risk assessment by comparing an
and a graph, which give an intuitive feedback to support               aneurysm-of-interest’s morphology to that of already treated
researchers in the consideration of research questions, which          ones and their outcomes [3, 4]. Metadata and hemodynamics
in the present use case often relate to rupture risk analysis.         can also be crucial to analyze and possibly give an idea of
The tool was evaluated with a pilot study and phantom                  which patients are at a higher risk [5].
database and received favorable results for its requirements                Careful consideration of treatment is particularly
of reliability and appropriate and clear outputs.                      important for IAs, as both endovascular treatment and
                                                                       microsurgical clipping may entail unnecessary complications
Keywords: subgroup selection, feature analysis, intracranial
                                                                       for the patients, especially for aneurysms with a low rupture
aneurysms.
                                                                       risk [1]. Rupture risk assessment and subgroup selection
                                                                       therefore are of high value in this area [1, 3, 4, 5].
https://doi.org/10.1515/cdbme-2021-1010
                                                                            The identification of such subgroups is not trivial. The
                                                                       complexity of the task rises with the number of both patients
                                                                       and features based on which similarity shall be determined,
1 Introduction                                                         and as well as with the different kinds of features that shall
                                                                       be considered. With manual selection of similar cases, it is
     When researching pathologies and their causalities,               often only possible to select few features that shall match,
finding cases with similar features, i.e. identifying certain          and these matches often have to be exact or are based on a
patient subgroups, is an important step in determining                 threshold, making no use of the distances of continuous
possible risk factors. This is not only relevant for research,         variables [6, 7, 8].
but also for clinical practice, as finding similar features of              To make this clinical research task automatic, reliable
incoming patients to those of already treated ones can support         and capable of answering complex research questions, we
physicians in diagnosis and treatment decisions.                       present a tool that identifies subgroups of user-defined sizes
______                                                                 among a database of patients based on arbitrary, user-selected
*Lena Spitz, Bernhard Preim: Faculty of Computer Science,              features, including an additional feature classification.
Otto-von-Guericke University Magdeburg, Universitätsplatz 2, D-
39106 Magdeburg, Germany, e-mail: lena@isg.cs.uni-
magdeburg.de
Vanessa M. Swiatek, Belal Neyazi, I. Erol Sandalcioglu:                2 Method
Department of Neurosurgery, Otto-von-Guericke University
Magdeburg, Germany
Sylvia Saalfeld: Faculty of Computer Science and Research              Using Matlab R2020a (MathWorks, Natick, U.S.), we
Campus STIMULATE, Otto-von-Guericke University Magdeburg,              extended a previously developed tool for case-based
Germany

 Open Access. © 2021 The Author(s), published by De Gruyter.      This work is licensed under the Creative Commons Attribution 4.0 License.
An interactive tool for identifying patient subgroups based on arbitrary characteristics for medical research
reasoning and rupture risk assessment support for IAs based an arbitrary parameter. To further make the tool more
on their morphological parameters [9]. suitable and robust for use in clinical practice, it also
The base tool loads a database of aneurysms and their accounts for missing data values by treating them as non-
morphological parameters, normalizes them, and then equal categorical values.
calculates distances between them, with special consideration Another new functionality is preselection. Here, the user
given to one aneurysm-of-interest (AOI). The distances can select any feature that is part of the database and select a
represent how similar two aneurysms are based on the input value. Similarity calculation and subgroup identification will
features, here morphological parameters, and thus the most then only be executed within the preselected subgroup that
similar aneurysms to the AOI have the smallest distances. has the value in the selected feature.
All distances d calculated make use of the Euclidean Other additions include direct feedback to user-defined
distance measure: variables and a more user-friendly and intuitive input via a
√∑ (
n csv table (e.g. Figure 2) rather than having to manually load
2
d ( p , q )= qi − p i ) (1) multiple individual files.
i=1
where p and q are features of two aneurysms, i is the current
feature and n is the total number of features
Figure 2: An example database with categorical and numerical
metadata and continuous morphological parameters.
All data and features used are anonymized patient data of
verified IA diagnoses, acquired during clinical routine at the
neurosurgery department at the university hospital in
Magdeburg, Germany. Thus we gain image data, manual
annotations, and derived data, including metadata and
pathology and treatment developments as categorical data, as
well as hemodynamic and morphological values as
continuous data.
Figure 1: The Graphical User Interface, showing the settings (A)
and result (B) panels as well as the graph (C) and heatmap
(D) visualization.
Another functionality is classification of rupture status: using
the most similar aneurysms, three different k-nearest-
neighbor classifiers predict if the AOI’s morphology is more
similar to that of ruptured or unruptured aneurysms. Since the
aneurysms in the database have already been treated, the
classification result can support the rupture risk assessment
and treatment decision for the AOI.
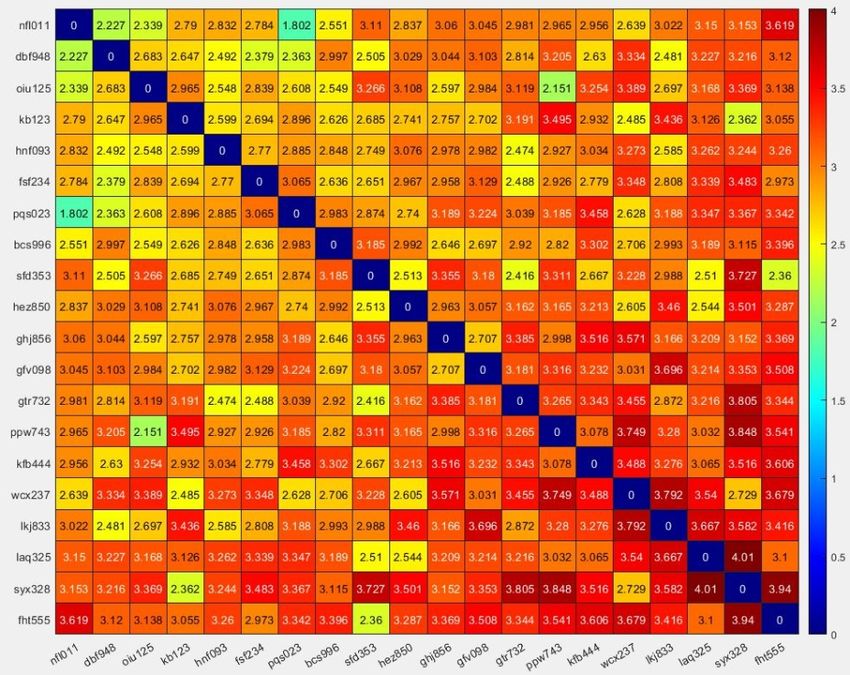
In this study, we extend the described tool to patient Figure 3: Heatmap visualization. Each entry encodes the distance
subgroup identification. This includes enabling the use of between the row and column aneurysm.
arbitrary features in the database and no longer limiting
similarity calculation to morphological parameters and The Graphical User Interface (GUI), visible in Figure 1, of
classification of rupture status. Instead, nominal and the tool includes a Settings panel (A) that handles all user
numerical features with categorical and continuous values input, and three output panels. One output panel is a text field
can be part of the database, and classification can be done for that returns the defined subgroup and patient names, as well
An interactive tool for identifying patient subgroups based on arbitrary characteristics for medical research
as the results of the classification (B). The two other output Reliability: It shall reliably return the most similar
panels (C and D) are visualizations that illustrate the cases to the AOI. Similarity shall be defined by the
similarity relationships of the patients based on their closest possible match within the user-selected
calculated distances across the defined features. The user features.
furthermore has the option to view segmented 3D models of Appropriate feedback: The output of the tool shall
the AOI and its most similar aneurysms, as well as view a correspond to the selected features.
scatterplot matrix visualization that gives information about Clear visualization: the visualizations shall put the
the correlations and information gain of the individual numerical results into context, and it shall be
features used for similarity calculation. immediately clear which cases are most similar.
The first visualization in the GUI is a heatmap (see
Figure 3). Here, each row and each column represents one To assess reliability, a phantom database of IAs based
aneurysm in the database, and each corresponding entry of on true patient data was created by a medical engineer
the heatmap represents the distance between them. The familiar with the field. In this phantom database, the
distances are color-coded based on similarity according to a resulting subgroups were known, providing a ground
rainbow color map selected by the end users. truth to compare the tool’s results to.
The second visualization is a graph (see Figure 4) that For feedback and visualization evaluation, a survey
illustrates information about distances within the defined was presented to clinicians where they could rate the
subgroup and the aneurysms immediately outside of it as different components of the tool and its output.
partial graph. Each node is an aneurysm, and the edges Within the phantom database, several clusters
between nodes represent their distance. The AOI and its most around example AOIs were created to check if the tool
similar aneurysms are highlighted, and the classification identified them as subgroups, and if the order of most to
feature is encoded in node shape. Node colors again encode least similar cases would be recognized. There were
distance to the AOI, using the same color scheme as in the five AOI with corresponding subgroups. The most
heatmap. The graph can be shown as partial graph (as in similar aneurysm was found reliably for all AOIs. In two
Figure 1), or a full graph with all aneurysms in the database cases, one of the aneurysms that belonged to the
and their distance to the AOI being visible (as in Figure 4). subgroup was not identified, however, in both of those
cases the aneurysm that wasn’t assigned to the
subgroup was the one that was the least similar to the
AOI. The order from most to least similar aneurysm
within the identified subgroup was not always correct,
but errors within the order were only found towards the
least similar ones, never within the most similar
aneurysm. Out of the five subgroups, two had perfect
orders. In many of the research questions posed during
discussion with clinicians, finding the most similar case
or a subgroup as a whole was sufficient, rather than
finding the specific order of similarity within a subgroup.
The tool can therefore reliably identify the most similar
Figure 4: Graph visualization. Each node represents and aneurysm to an AOI.
aneurysms and their connecting edges the distances
The survey was sent to eight medical researchers
between them. Only distances between most similar
aneurysms are depicted by edges. within the fields of neurosurgery and medical
engineering who had experience ranging from one to
ten years. This included two practicing doctors, and all
participants were familiar with IA research. The
participants were asked to rate the different outputs and
3 Evaluation visualizations on a five-point Likert scale.
Overall, the tool’s output was rated as appropriate,
In dialogue with the end users of the application, three with an average of 4.6 out of 5. The heatmap received
criteria were determined to be crucial for the tool to the best ratings, it was deemed the most helpful and
fulfill: appropriate. The result panel was rated as the least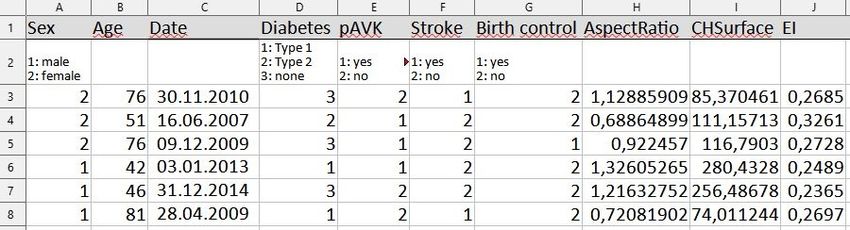
An interactive tool for identifying patient subgroups based on arbitrary characteristics for medical research

intuitive, but more participants said they would use it                       impacts on research questions [8], which shall also be
when considering a research question than the graph,                          visualized. This will also lead to an overworking of the graph
though the classifier results need elaboration to be                          visualization to give all distances within it a meaning, rather
understood. It is important to note that preferences                          than just the ones encoded via an edge.
varied significantly between users. This was illustrated
when the participants were asked for their favorite of                        Author Statement
the outputs, where answers were non-conclusive.                               Research funding: The authors state no funding involved.
Overall, the graph was mentioned the most when asked                          Conflict of interest: Authors state no conflict of interest.
for the most helpful, intuitive and appropriate output,                       Informed consent: Informed consent has been obtained from
despite the heatmap receiving the most favorable                              all individuals included in this study. Ethical approval: The
rating.                                                                       research related to human use complies with all the relevant
     The tool’s evaluation in regards to reliability,                         national regulations, institutional policies and was performed
appropriate and clear feedback was therefore positive.                        in accordance with the tenets of the Helsinki Declaration, and
However, there were limitations.                                              has been approved by the authors’ institutional review board
     Especially the graph visualization, while receiving                      or equivalent committee.
good ratings, was mentioned to be confusing. This is
because only the distances between nodes connected
by edges have meaning, and even these distances are                           References
not always true to scale due to Matlab’s internal
                                                                              [1]   Keedy A. An overview of intracranial aneurysms. McGill
handling. Additionally, the graph isn’t always readable.                            Journal of Medicine, 9(2):141-146, 2006.
Completely re-working the graph to make all distances                         [2]   Schievink WI Intracranial Aneurysms. The New England
meaningful would be desired, especially in combination                              Journal of Medicine, 336:28-40, 1997.
with a state-of-the-art dimension reduction that could                        [3]   Dhar S, Tremmel M, Mocco K, Kim M, Yamamoto J, Sidiqui
                                                                                    AH, Hopkins LN, Meng H. Morphology parameters for
reduce the distances to a 2D problem.                                               intracranial aneurysm rupture risk assessment.
     Another valuable addition could be an overview of                              Neurosurgery, 63(2):185-196, 2008.
the similar and non-similar features of the identified                        [4]   Niemann U, Berg P, Niemann A, Beuing O, Preim B,
subgroup. Such additions could be made in the results                               Spiliopoulou M, Saalfeld S. Rupture status classification of
                                                                                    intracranial aneurysms using morphologcial parameters. In:
panel.
                                                                                    Proc. of IEEE symposium on computer-based medical
                                                                                    systems, 48-53, 2018.
                                                                              [5]   Detmer FJ, Hadad S, Chung B, Mut F, Slawski M, Juchler N,
                                                                                    Kurtcuoglu V, Hirsch S, Bijlenga P, Uchiyama Y, Fujimura S,
4 Conclusion                                                                        Yamamoto M, Murayama Y, Takao H, Koivisto T, Frösen J,
                                                                                    Cebral JR. Extending statistical learning for aneurysm
We presented an interactive tool for patient subgroup                               rupture assessment to Finnish and Japanese populations
                                                                                    using morphology, hemodynamics and patient
identification based on arbitrary characteristics. The tool
                                                                                    characteristics. Neurosurg Focus 47(1):E16, DOI:
supports a mix of categorical and continuous features and                           10.3171/2019.4FOCUS19145, 2019.
includes a classification feature as well as visualizations of                [6]   Lewallen S, Courtright P, Epidemiology in Practice: Case-
the most similar cases to the case of interest. It can account                      Control Studies, Common Eye Health, 11(28):57-58, 1998.
                                                                              [7]   Kaspera W, Ćmiel-Smorzyk K, Wolański W, Kawlewska E,
for missing values and automatically identifies subgroups of
                                                                                    Hebda A, Gzik M, Ładziński P. Morphological and
patients according to their similarities in user-defined                            hemodynamic risk factors for middle cerebral artery
features. It can thus not only find an arbitrary number of                          aneurysm: a case-control study of 190 patients. Scientific
cases for a subgroup, but also find the most similar case to                        Reports, 10:2016, 2020. DOI: 10.1038/s41598-019-56061-2
the one of interest. It was tested in context of intracranial                 [8]   Neyazi B, Swiatek VM, Skalej M, Beuing O, Stein KP,
                                                                                    Hattingen J, Preim B, Berg P, Saalfeld S. Rupture risk
aneurysms and grants sufficient results to support clinicians                       assessment for multiple intracranial aneurysms: why there is
in research questions. As features and cases are arbitrary, the                     no need for dozens of clinical, morphological and
tool can be used for any pathology or even outside of the                           hemodynamic parameters. Therapeutic Advances in
medical research field.                                                             Neurological Disorders, 13, 2020, DOI:
                                                                                    10.1177/1756286420966159.
     Future work will include a suitable, state-of-the-art
                                                                              [9]   Spitz L, Niemann U, Beuing O, Neyazi B, Sandalcioglu IE,
dimension reduction to address curse of dimensionality. In                          Preim B, Saalfeld S. Combining visual analytics and case-
this context, a weighting of different parameters shall                             based reasoning for rupture risk assessment of intracranial
additionally be enabled as different parameters have different                      aneurysms. International Journal of Computer Assisted
                                                                                    Radiology and Surgery, 15(9):1525-1535, 2020 DOI:
                                                                                     10.1007/s11548-020-02217-9.
You can also read