An Expandable Informatics Framework for Enhancing Central Cancer Registries with Digital Pathology Specimens, Computational Imaging Tools, and ...
←
→
Page content transcription
If your browser does not render page correctly, please read the page content below
[Downloaded free from http://www.jpathinformatics.org on Thursday, January 6, 2022, IP: 243.195.204.225]

                                                                            Original Article

              An Expandable Informatics Framework for Enhancing
           Central Cancer Registries with Digital Pathology Specimens,
               Computational Imaging Tools, and Advanced Mining
                                   Capabilities
      David J. Foran1,2, Eric B. Durbin3,4, Wenjin Chen1, Evita Sadimin1,2, Ashish Sharma5, Imon Banerjee5, Tahsin Kurc6, Nan Li5, Antoinette M. Stroup7, Gerald Harris7,
        Annie Gu5, Maria Schymura8, Rajarsi Gupta6, Erich Bremer6, Joseph Balsamo6, Tammy DiPrima6, Feiqiao Wang6, Shahira Abousamra9, Dimitris Samaras9,
                                                                   Isaac Hands4, Kevin Ward10, Joel H. Saltz6
       1
         Center for Biomedical Informatics, Rutgers Cancer Institute of New Jersey, New Brunswick, NJ, USA, 2Department of Pathology and Laboratory Medicine, Rutgers-
             Robert Wood Johnson Medical School, Piscataway, NJ, USA, 3Kentucky Cancer Registry, Markey Cancer Center, University of Kentucky, Lexington, KY, USA,
           4
            Division of Biomedical Informatics, Department of Internal Medicine, College of Medicine, Lexington, KY, USA, 5Department of Biomedical Informatics, Emory
         University School of Medicine, Atlanta, GA, USA, 6Department of Biomedical Informatics, Stony Brook University, Stony Brook, NY, USA, 7New Jersey State Cancer
       Registry, Rutgers Cancer Institute of New Jersey, New Brunswick, NJ, USA, 8New York State Cancer Registry, New York State Department of Health, Albany, NY, USA,
       9
        Department of Computer Science, Stony Brook University, Stony Brook, NY, USA, 10Georgia State Cancer Registry, Georgia Department of Public Health, Atlanta, GA,
                                                                                        USA

      Submitted: 30-April-2021		Accepted: 30-April-2021                                 Published: 05-January-2022

        Abstract
      Background: Population-based state cancer registries are an authoritative source for cancer statistics in the United States. They
      routinely collect a variety of data, including patient demographics, primary tumor site, stage at diagnosis, first course of treatment,
      and survival, on every cancer case that is reported across all U.S. states and territories. The goal of our project is to enrich NCI’s
      Surveillance, Epidemiology, and End Results (SEER) registry data with high-quality population-based biospecimen data in the form
      of digital pathology, machine-learning-based classifications, and quantitative histopathology imaging feature sets (referred to here as
      Pathomics features). Materials and Methods: As part of the project, the underlying informatics infrastructure was designed, tested,
      and implemented through close collaboration with several participating SEER registries to ensure consistency with registry processes,
      computational scalability, and ability to support creation of population cohorts that span multiple sites. Utilizing computational
      imaging algorithms and methods to both generate indices and search for matches makes it possible to reduce inter- and intra-observer
      inconsistencies and to improve the objectivity with which large image repositories are interrogated. Results: Our team has created and
      continues to expand a well-curated repository of high-quality digitized pathology images corresponding to subjects whose data are
      routinely collected by the collaborating registries. Our team has systematically deployed and tested key, visual analytic methods to
      facilitate automated creation of population cohorts for epidemiological studies and tools to support visualization of feature clusters
      and evaluation of whole-slide images. As part of these efforts, we are developing and optimizing advanced search and matching
      algorithms to facilitate automated, content-based retrieval of digitized specimens based on their underlying image features and staining
      characteristics. Conclusion: To meet the challenges of this project, we established the analytic pipelines, methods, and workflows to

                                                                                                                        Address for correspondence: Dr. David J. Foran,
                                                                                              Center for Biomedical Informatics, Rutgers Cancer Institute of New Jersey,
                                                                                                         195 Little Albany Street, New Brunswick, NJ 08903-2681, USA.
                                                                                                                                          E-mail: foran@cinj.rutgers.edu

                                                                                          This is an open access journal, and articles are distributed under the terms of the
                                                                                          Creative Commons Attribution-NonCommercial-ShareAlike 4.0 License, which allows
                                                                                          others to remix, tweak, and build upon the work non-commercially, as long as
                                                                                          appropriate credit is given and the new creations are licensed under the identical terms.

                                                                                          For reprints contact: WKHLRPMedknow_reprints@wolterskluwer.com
                                  Access this article online
           Quick Response Code:                                                            How to cite this article: Foran DJ, Durbin EB, Chen W, Sadimin E,
                                        Website:
                                        www.jpathinformatics.org
                                                                                           Sharma A, Banerjee I, et al. An expandable informatics framework for
                                                                                           enhancing central cancer registries with digital pathology specimens,
                                                                                           computational imaging tools, and advanced mining capabilities. J
                                        DOI:                                               Pathol Inform 2022;13:5.
                                        10.4103/jpi.jpi_31_21                              Available FREE in open access from: http://www.jpathinformatics.org/
                                                                                           text.asp?2022/13/1/5/334787

© 2022 Journal of Pathology Informatics | Published by Wolters Kluwer - Medknow 1 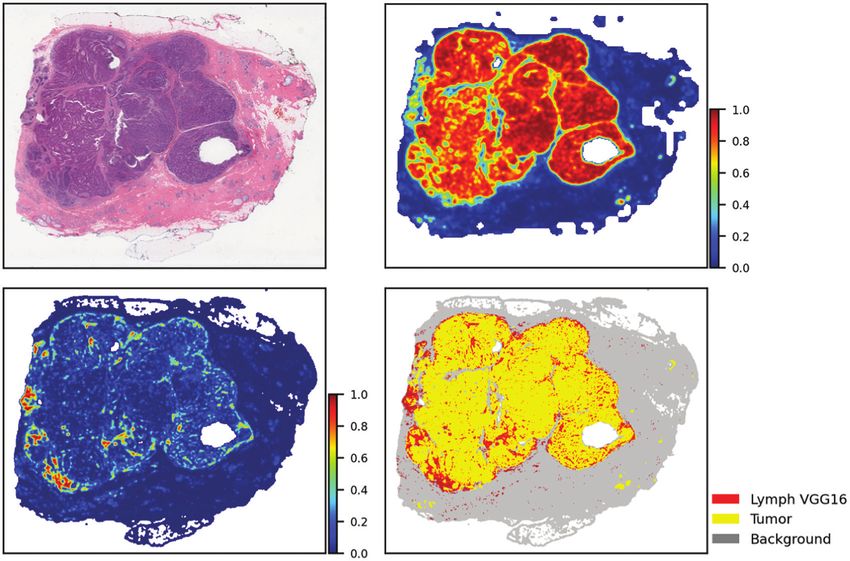
[Downloaded free from http://www.jpathinformatics.org on Thursday, January 6, 2022, IP: 243.195.204.225]

      Pathol Inform 2022, 1:5                                                                    http://www.jpathinformatics.org/content/13/1/5

      support the expansion and management of a growing repository of high-quality digitized pathology and information-rich, population
      cohorts containing objective imaging and clinical attributes to facilitate studies that seek to discriminate among different subtypes of
      disease, stratify patient populations, and perform comparisons of tumor characteristics within and across patient cohorts. We have
      also successfully developed a suite of tools based on a deep-learning method to perform quantitative characterizations of tumor
      regions, assess infiltrating lymphocyte distributions, and generate objective nuclear feature measurements. As part of these efforts, our
      team has implemented reliable methods that enable investigators to systematically search through large repositories to automatically
      retrieve digitized pathology specimens and correlated clinical data based on their computational signatures.

      Keywords: Cancer registries, computational imaging, deep-learning, digital pathology

      Introduction                                                            a pathology report. The important distinction is that these
                                                                              features are reproducible, unlike human observations, which
      The NCI’s Surveillance, Epidemiology, and End Results
                                                                              are highly qualitative and subject to a high degree of inter-
      (SEER) program is a coordinated system of 19 cancer
                                                                              and intra-observer variability. The importance of increasing
      registries that is charged with providing timely and accurate
                                                                              reproducibility and reducing inter-observer variability in
      data regarding cancer incidence, mortality, treatment,
                                                                              pathology studies has been previously reported.[1-26] Moreover,
      and survival. Pathology datasets currently available in
                                                                              many studies have demonstrated that quantitative image
      the SEER registries are qualitative in nature, consisting
                                                                              characterizations (e.g., nuclear features, patterns of TILs) are
      of scoring and staging data captured in normal registry
                                                                              promising biomarkers which can be used to predict outcome
      abstracts and pathology reports. Such datasets are generally
                                                                              and treatment response, if available in a large population.[27-39]
      subject to inter-observer variability, which can result in
                                                                              These biomarkers integrated with clinical and genomics data
      biases in population-wide studies of cancer incidence,
                                                                              can provide new opportunities to enhance our understanding
      mortality, survival, and prevalence. The main goal of our
                                                                              of cancer incidence, mortality, survival, along with statistical
      project is to enrich SEER registry data with high-quality
                                                                              characterizations of lifetime risk, and to improve prediction
      population-based digital biospecimen data in the form of
                                                                              and assessment of therapeutic effectiveness.
      pathology tissue images and detailed computational tissue
      characterizations and features (also referred to as Pathomics           Our project began as collaboration among investigators
      features) derived from the images. Examples of Pathomics                within the state cancer registries of New Jersey, Georgia,
      data include detailed characterizations of cancer and                   and Kentucky. The consortium of partnering sites has
      stromal nuclei and quantification and mapping of tumor-                 recently expanded to include the newly established New
      infiltrating lymphocytes (TILs) along a supplementary                   York Cancer Registry. In this collaborative effort, we are
      histology classification generated through deep-learning                implementing a framework of data curation and analysis
      algorithms. These data will augment existing registry data              workflows, computational imaging tools, and informatics
      with quantitative features obtained directly from clinically            infrastructure to support the creation and management of a
      acquired whole slide tissue images and provide detailed and             well-curated, integrated repository of high-quality digitized
      nuanced information on tumor histology.                                 pathology images and Pathomics features, for subjects whose
                                                                              data are being collected by the registries. The framework is
      The scientific premise motivating this work is that the
                                                                              being developed in close collaboration with SEER registries
      incorporation of quantitative digital pathology into the
                                                                              to ensure that it is scalable and in-line with existing registry
      cancer registries will result in a valuable population-wide
                                                                              processes and can support queries and the creation of
      dataset that can provide additional insight into the underlying
                                                                              population cohorts that span multiple registries.
      characteristics of cancer. Next Generation Sequencing
      (NGS) technologies have captured much attention of the                  In our framework, whole slide tissue images in the repository
      clinical community for their capacity to provide insight as             are systematically processed to compute Pathomics data
      to personalized choice in treatment and therapy. A major                and to establish linkages with registry data. The current set
      limitation of NGS technologies is that they obliterate the              of Pathomics data includes (1) quantification of TILs, (2)
      spatial information associated within and throughout the                segmentation and computational description of cancerous
      tumor environment. Histopathology and immunostaining                    and stromal nuclei, (3) segmentation of tumor regions, (4)
      localization techniques preserve this information which is              characterization of regional Gleason grade for prostate
      invaluable in making accurate determinations. In fact, it is            cancer, and (5) identification of non-small cell lung cancer
      through the process of histopathology examination that                  (NSCLC) adenocarcinoma subtypes. This initial set is
      tumor margins/volumes are determined by pathologists prior              primarily motivated by an increasing number of scientific
      to the NGS analysis. These parameters are subsequently used             studies that investigate TILs and the relationships among
      to help guide decisions regarding appropriate cut-offs for allele       TILs, tumors, and nuclear structure of tissue.[40-45] Such
      frequencies and drive other components of the overall analysis.         investigations can provide important information to
      Pathomics features extracted from high-resolution pathology             advance our understanding of immune response in many
      images are a quantitative surrogate of what is described in             cancer types. In the future, additional Pathomics features,


      2                                                                                             2  Journal of Pathology Informatics
[Downloaded free from http://www.jpathinformatics.org on Thursday, January 6, 2022, IP: 243.195.204.225]

      Pathol Inform 2022, 1:5                                                                    http://www.jpathinformatics.org/content/13/1/5

      such as the spectral and spatial signatures of staining                 Institute of New Jersey (RCINJ). Breast, colorectal, lung,
      characteristics exhibited by the digitized specimens, will              melanoma, and prostate cancer cases suitable for the project
      be incorporated into our framework.                                     exhibiting well-defined tumor type and diagnoses are
                                                                              selected by a pathologist at the RCINJ and Rutgers Robert
      The informatics infrastructure for this project is being built
                                                                              Wood Johnson Medical School. Cases within approximately
      on open-source software and leverages modern software
                                                                              a 2-year window are retrieved from onsite storage, whereas
      technologies, such as containerization and web-based
                                                                              others are requested from offsite storage with the help
      applications, for a scalable, extensible implementation.[46,47]
                                                                              of BioSpecimens Repository Service of RCINJ. After a
      The infrastructure facilitates visualization of high-
                                                                              certified pathologist selects suitable slides according to
      resolution whole slide tissue images along with associated
                                                                              requirement of each cancer type—e.g., prostate cancer
      Pathomics datasets. User authentication and access
                                                                              specimens are selected according to the Gleason grade—the
      controls are implemented to thwart unauthorized access
                                                                              specimens are imaged with an Olympus VS120 whole slide
      to data. The informatics infrastructure is being expanded
                                                                              scanner with no protected health information appearing in
      to include tools to support content-based image retrieval.
                                                                              image filename, image metadata, or the images themselves.
      Presently, the repository manages diagnostic whole slide
                                                                              Team members from the BISR and NJCR perform cross-
      tissue images and analysis results obtained from 772
                                                                              specialty review of the data for quality control. A secure,
      prostate cases, 1410 NSCLC cases, 70 breast cancer cases,
                                                                              IRB-approved, Oracle-based (Redwood Shores, CA, USA)
      and 48 lymphoma cases from the New Jersey State Cancer                  Clinical Research Data Warehouse is used at Rutgers
      Registry and from 198 breast cancer cases from the                      to facilitate review of imaging and correlated clinical
      Georgia State Cancer Registry. The scientific validation                information on an individual patient basis or as part of
      of the proposed environment will be undertaken through                  large cohorts. The data warehouse has been commissioned
      performance studies led by investigators throughout the                 to house multimodal data (genomics, digital pathology,
      four collaborating sites with an overarching focus on                   radiology images). It orchestrates aggregation of information
      breast cancer, colorectal cancer, lymphoma, melanoma,                   originating from multiple data sources including Electronic
      NSCLC, and prostate cancer. We are confident that this                  Medical Records, Clinical Trial Management Systems,
      repository will enable effective integration of pathology               Tumor Registries, Biospecimen Repositories, Radiology
      imaging and feature data as an invaluable resource in                   and Pathology archives, and Next Generation Sequencing
      SEER registries.                                                        services [Figure 2]. Innovative solutions were implemented
      In the rest of the paper, we describe the design and                    in the warehouse to detect and extract unstructured clinical
      implementation of the key components of the framework:                  information that was embedded in paper/text documents,
      the data curation and analysis processes, the initial set of            including synoptic pathology reports. The Warehouse
      image analysis methods, and the underlying informatics                  receives objective oversight by a standing Data Governance
      infrastructure for data management and visualization.                   Council.[48] An Informatica-based (Redwood City, CA,
                                                                              USA) extraction transformation and load interface (ETL)
                                                                              has been developed to automatically populate the Data
      Materials and Methods                                                   Warehouse with data elements originating from the multi-
                                                                              modal data sources. This past year our team worked closely
      Aggregation, quality control, and linkage of image data                 with the Google Healthcare team to successfully create
      The first component of our framework is the curation of                 and test an instance of the Data Warehouse on the Google
      pathology imaging data and linkage with other data from                 Cloud Platform (GCP). In May 2020, we demonstrated the
      the cancer registries. Image quality control is an essential            scalability of the cloud-based ETL, Warehouse, and Data
      step, because specimen preparation protocols and tissue                 Mart. As part of the project, our team will expand the use
      scanning procedures may result in imaging artifacts and                 of the Warehouse by configuring it to integrate digitized
      variations in image quality. We devised and refined a                   pathology specimens with data originating from all of the
      workflow to facilitate the collection and quality control               collaborating cancer registries.
      of digitized tissue specimens and linkage of images with
                                                                              The images and cases are linked through deidentified ID
      correlated data extracted from the cancer registries. Here
                                                                              sequences. The New Jersey State Cancer Registry receives
      we describe the workflow deployed at Rutgers and the
                                                                              the deidentified ID as well as case information including
      New Jersey SEER registry; the other sites—Georgia,
                                                                              specific surgery number and date, so that after data retrieval
      Kentucky, and New York—are incrementally adopting
                                                                              and decoding encrypted fields, the deidentified ID is linked
      analogous workflows as approved by their SEER registries
                                                                              with clinical data associated with the case and, more
      and Institutional Review Boards (IRBs).
                                                                              specifically, with the diagnostic surgery. This ensures that
      Figure 1 depicts an instance of the workflow. Specimen                  the cancer specimen images are associated with the correct
      retrieval and imaging are coordinated at the Biomedical                 staging of the disease at the time of diagnosis so that it
      Informatics Shared Resource (BISR) of Rutgers Cancer                    can be used in downstream research. The total corpus of

Journal of Pathology Informatics 3 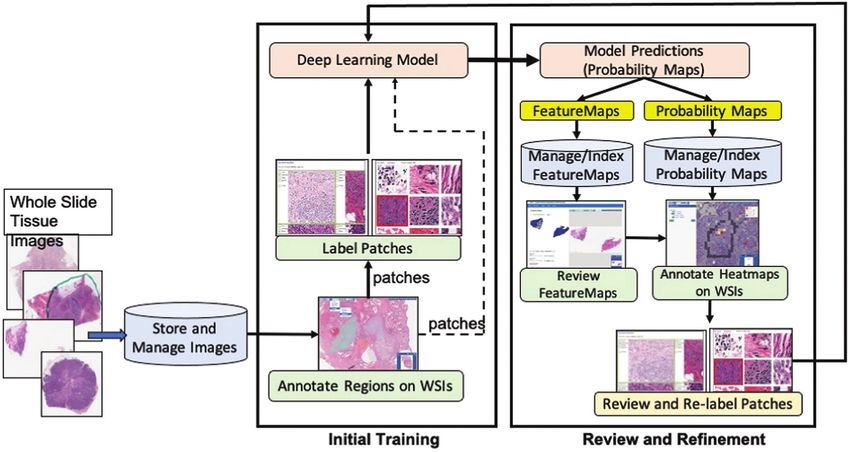
[Downloaded free from http://www.jpathinformatics.org on Thursday, January 6, 2022, IP: 243.195.204.225]

      Pathol Inform 2022, 1:5                                                                           http://www.jpathinformatics.org/content/13/1/5

      Figure 1: Workflow for assembling linked image/data cohorts

      Figure 2: Clinical Research Data Warehouse workflow. The research data warehouse aggregates information from multiple data sources such as
      electronic health records, tumor registries, and radiology and pathology archives. It facilitates review of imaging data and linked clinical data on a
      single patient or cohort basis

      data comprising the linked data sets encompasses more                        of analysis methods for segmentation and classification
      than 150 data elements, including the de-coded NAACCR                        of objects, regions, and structures (such as nuclei,
      data, as shown in Table 1. The de-identified images are                      tumors, glands) in tissue images have been developed.
      analyzed through a set of deep-learning analysis pipelines                   Excellent overviews of existing techniques can be found
      as described in the subsequent sections.                                     in several review papers.[49-55] Deep-learning-based analysis
                                                                                   approaches have become popular, because deep-learning
      Extraction of Pathomics features                                             methods have been shown to outperform traditional image
      Development of tissue image analysis methods is a highly                     analysis methods in many application domains, including
      active area of research and implementation. A variety                        digital pathology. Our current tissue image analysis


      4                                                                                                    4  Journal of Pathology Informatics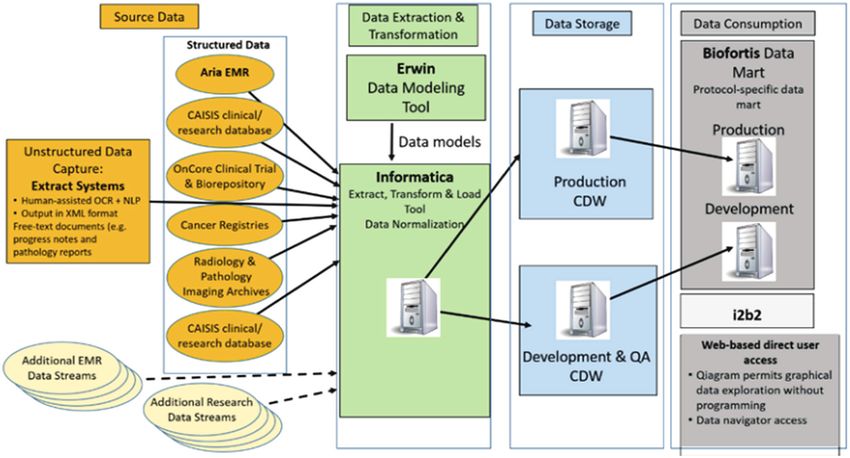
[Downloaded free from http://www.jpathinformatics.org on Thursday, January 6, 2022, IP: 243.195.204.225]

      Pathol Inform 2022, 1:5                                                                              http://www.jpathinformatics.org/content/13/1/5

      library consists of deep-learning methods developed by                         used to determine cancer stage and evaluate response to
      our group to classify patterns of TILs,[56,57] segment tumor                   treatment. Our current models can segment tumor regions
      regions, classify tumor subtypes,[58,59] and segment nuclei                    in lung, prostate, pancreatic, and breast cancer types and
      in whole slide images (WSIs) of hematoxylin and eosin-                         can classify tumor and non-tumor regions at the level of
      stained tissue samples.[60,61]                                                 88 × 88 µm2 patches. The model for prostate cancer can
                                                                                     segment and label a tumor subregion with one of the three
      We should note that the analysis functionality is not
                                                                                     Gleason scores: Benign, Grade 3, and Grade 4+5. The lung
      limited to methods implemented by our group only. We
                                                                                     tumor segmentation model is able to segment and label
      have started with these methods because (1) they are
                                                                                     a tumor subregion with one of the six tumor subtypes:
      based on state-of-the-art convolutional neural network
                                                                                     acinar, benign, lepidic, micropapillary, mucinous, and
      architectures, such as VGG16,[62] Inception V4,[63] ResNet,[64]
                                                                                     solid. Nucleus segmentation is one of the core digital
      and U-Net,[65] (2) they have achieved high accuracy scores,
                                                                                     pathology analysis steps. The shape and texture properties
      and (3) they have been previously used, refined, and
                                                                                     and spatial distributions of nuclei in tissue specimens
      validated in generating large, curated Pathomics datasets.
                                                                                     are used in cancer diagnosis and staging. Our nucleus
      For example, the TIL models were developed in close
                                                                                     segmentation model can detect nuclei and delineate their
      collaboration with pathologists, who generated a large
                                                                                     boundaries in WSIs. After a WSI has been processed
      set of training data, evaluated analysis results, and helped
                                                                                     by the segmentation model, we compute a set of shape,
      refine the models. The final models were employed to
                                                                                     intensity, and texture features. We use the PyRadiomics
      produce and publish a TIL dataset from 5202 WSIs from
                                                                                     library[68] to compute the patch-level features.
      13 cancer types.[56,57] The nucleus segmentation model was
      developed in a similar approach with one difference. In
      addition to manually annotated segmentations, a synthetic                      Management, visualization, and review of Pathomics
      data generation method, based on generative adversarial
                                                                                     features
      networks,[66] was used to significantly increase the diversity
                                                                                     Our data analysis workflow implements an iterative train-
      and size of training data.[60] The model trained with the
                                                                                     predict-review-refine process to curate robust Pathomics
      combined manual and synthetic training data was used
                                                                                     features. This process is based on our earlier works in
      to generate a quality-controlled dataset of 5 billion
                                                                                     curating large Pathomics datasets[57,59,61] and is carried out
      segmented nuclei in 5060 WSIs from 10 cancer types[61] in
                                                                                     as part of the training and prediction phases of the deep-
      the Cancer Genome Atlas (TCGA) repository. We plan
                                                                                     learning analysis pipelines. We developed a set of tools to
      to expand the suite of analysis methods and incorporate
                                                                                     enable the iterative process and to provide support for the
      state-of-the-art methods developed by other groups over
                                                                                     management, indexing, and interactive viewing of WSIs
      time. Indeed, at the time of writing this manuscript, we are
                                                                                     and analysis results. The tools are implemented as a set
      in the process of integrating and validating Hover-Net[67]
                                                                                     of web-based applications and services in the PRISM
      in the framework for segmentation and classification of
                                                                                     and QuIP software platforms.[46,47] Using these tools,
      nuclei.
                                                                                     pathologists can inspect the output of a tumor or TIL
      The current suite of TIL analysis models can resolve TIL                       analysis pipeline as full-resolution heatmap overlays on
      distributions in a WSI at the level of 50 × 50 µm2 patches.                    WSIs. A heatmap is a spatial representation of prediction
      The characteristics of tumor regions and the relationship                      probabilities assigned to individual image patches by the
      between tumor regions and lymphocyte cells can be                              deep-learning model; the probability value indicates if a

       Table 1: Representative categories and linked data elements
       Source      Category              Representative elements
       Cancer      Demographics          age_at_dx, sex, marital_status_at_dx, race, nhia, napiia, county_at_dx, etc
       Registry
                   Vital information     vital_status, date_of_death, primary_cause
                   Tumor information     Primary_site, laterality, grade, diagnosis_confirmation
                   Tumor extension       cs_extension, cs_tumor_size, cs_lymph_nodes, cs_mets_at_dx
                   and metastasis
                   Pathology info and    histology_icdo3, behavior_icdo3, clinical and pathology staging in AJCC 6, 7, 8 and SEER staging
                   tumor staging
                   Site-specific data    cs_site_specific factors
                   Tumor treatments      Surgical, radiation, hormone, BRM, and other cancer treatment information
       Imaging     Pathology images      Digitized representative diagnostic slides in Olympus (.vsi) and Philips (.svs?) whole slide image formats,
                                         including image metadata such as imaging device, optical settings and configuration, specimen staining,
                                         etc.
                   Computational         Tumor-infiltrating lymphocytes; tumor pattern segmentation; tumor and stromal nuclei segmenta-
                   imaging signatures    tion; spatial and spectral signatures

Journal of Pathology Informatics 5 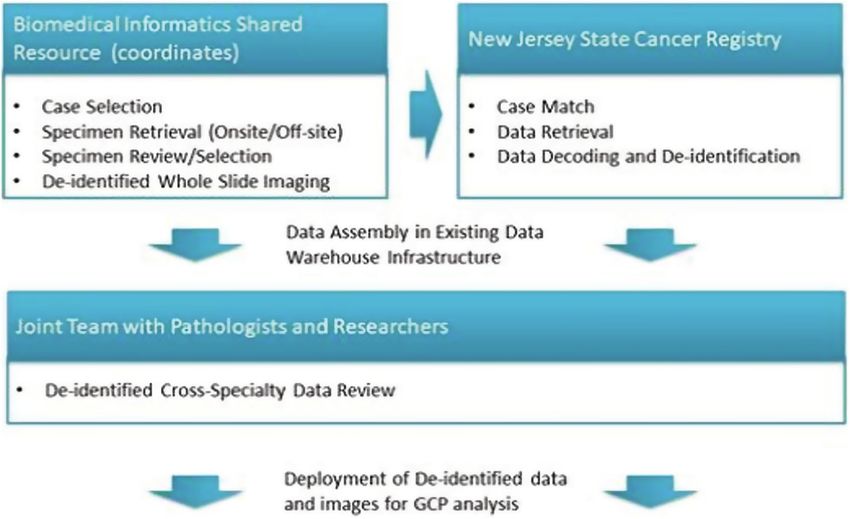
[Downloaded free from http://www.jpathinformatics.org on Thursday, January 6, 2022, IP: 243.195.204.225]
Pathol Inform 2022, 1:5 http://www.jpathinformatics.org/content/13/1/5
patch is class-positive (e.g., TIL-positive, tumor-positive).
Figure 3 shows example heatmaps generated from the TIL
(upper figure) and tumor (lower figure) analysis pipelines.
Nuclear segmentation results can be viewed as polygons,
which represent the boundaries of segmented nuclei as
overlays on the images in QuIP [Figure 4].
Figure 5 shows how the iterative process is executed with
QuIP. For example, after a set of WSIs are processed by
the TIL and tumor segmentation models, the source WSIs
and the heatmaps are loaded to QuIP for management
and visualization. The heatmaps and WSIs are also
transformed into feature maps. Feature maps are lower
resolution representations of the heatmaps and WSIs in a
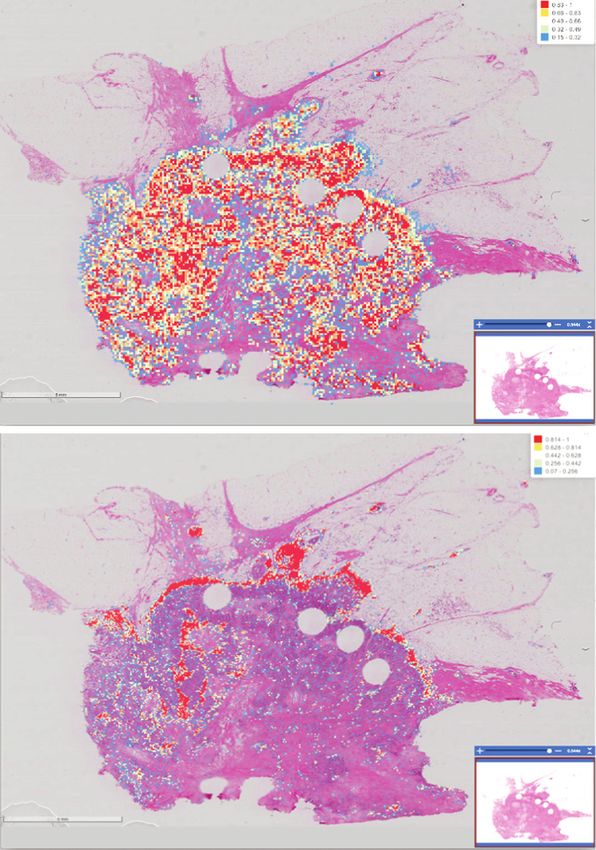
four-panel image. Figure 6 illustrates an example feature
map which combines TIL results from a VGG16 model
and tumor segmentation results from a ResNet model. The
upper left corner of the image is the low-resolution tissue
image, the upper right corner is the tumor segmentation
map, the lower left corner represents the TIL map, and
the lower right corner is the combined and thresholded
TIL and tumor maps. Feature maps allow a pathologist
to review results more efficiently than examining full-
resolution images and maps. If the pathologist sees
potential problems with the results during this review,
they use the web applications in QuIP to visualize the
WSIs and heatmaps at higher resolutions. If the review
necessitates refinements to the model, additional training
data are generated and added to the training dataset.
They can annotate regions in an image using web-based
visualization and annotation tools. Patches extracted Figure 3: TIL and tumor analysis results displayed as a heatmap on
from these annotations are reviewed and labeled to the whole slide tissue image. TIL analysis results on the left and the
create additional training data. The model is refined by tumor segmentation results on the right. The red color indicates a higher
re-training the method with the updated training dataset. probability of a patch being TIL-positive (or tumor-positive) and the blue
color indicates a lower probability
Results Discussion and Conclusions
The current implementation of the framework—the Evaluation of cancer control interventions in prevention,
curation and analysis workflows, analysis methods, screening, and treatment and their effects on population
and informatics infrastructure—has been successfully trends in incidence and mortality hinge on accurate,
deployed. The workflows and analytic methods have reproducible, and nuanced pathology characterizations.
received IRB approval at all collaborating institutions. Diagnostic and treatment guidelines also specify detailed
The framework has been employed to create a repository measurements of TILs, nuclear grade; i.e., evaluation
of diagnostic images from 772 prostate cases, 1410 of the size and shape of the nucleus in the tumor cells,
NSCLC cases, 70 breast cancer cases, and 48 lymphoma mitoses, and IHC staining, which are currently not
cases from the New Jersey State Cancer Registry and included in cancer registry data abstraction. Presently, the
from 198 breast cancer cases from the Georgia State SEER Pathology workflow, depicted in Figure 7, begins
Cancer Registry. The repository also contains results from with normal registry abstracts and electronic pathology
TIL and tumor segmentation for each image and more (e-Path) reports securely transmitted to the SEER
than 2.5 billion segmented nuclei from all of the images. registries. Although scoring and staging data are captured
For each image, there are two TIL analysis results (one and made available through the registries, there have
generated from the VGG16 network and the other from been numerous studies that showed a high level of inter-
the Inception V4 network). The images and Pathomics observer variability among the diagnostic classifications
data are managed by an instance of QuIP running at rendered by pathologists, which can potentially give rise to
Stony Brook for interactive visualization of images and biases when conducting population-wide studies. As the
Pathomics features. All of the results and images are also diagnosis of cancer and its immune response to therapy is
stored in Box folders to facilitate bulk data downloads. made through tissue studies, the integration of pathology
6 6 Journal of Pathology Informatics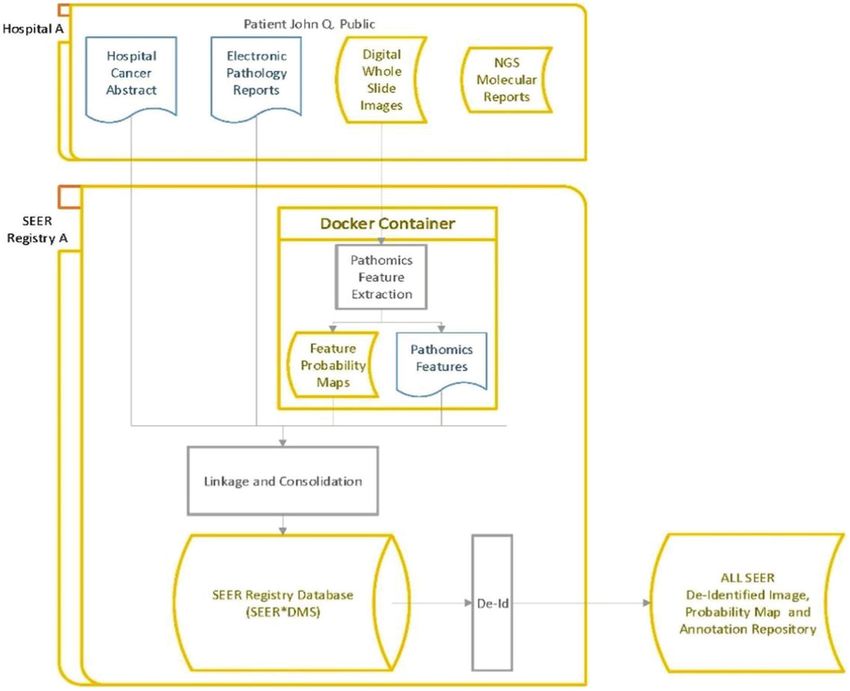
[Downloaded free from http://www.jpathinformatics.org on Thursday, January 6, 2022, IP: 243.195.204.225]

      Pathol Inform 2022, 1:5                                                                             http://www.jpathinformatics.org/content/13/1/5

      Figure 4: Segmented nuclei overlaid as polygons shown in blue on the WSI. Each polygon represents the boundary of a segmented nucleus

      Figure 5: The iterative workflow starts with a set of patches which are extracted from whole slide tissue images and labeled for initial model training.
      Predictions from the trained model are reviewed as feature maps and heatmaps. The heatmaps are annotated to generate additional labeled patches
      which are added to the training dataset. The deep learning network is retrained with the updated training dataset to refine the model

      imaging in SEER registries is critical to precisely classify                  of routine pathology workflows at hospitals and medical
      tumors and predict tumor response to therapies.                               research centers. As institutions adopt digital WSIs into
      Whole slide tissue scanning technologies have advanced                        their pathology workflows, we can envision that the images
      significantly over the past 20 years.[69] They are capable                    and molecular reports will also be securely transmitted
      of imaging tissue specimens at high resolution in several                     to the SEER registries. Within the SEER registry, images
      minutes, and with advanced auto-focussing mechanisms                          will be automatically processed by the suite of feature
      and automated slide trays, they can process batches of                        extraction pipelines appropriate for the type of cancer. The
      tissue samples with little-to-no manual intervention.                         SEER database will be enhanced with quantitative features
      Several studies have evaluated the utility of imaged                          and the accompanying pipeline distribution version.
      tissue data in pathology workflows.[70-75] The Food and                       SEER*DMS will be used to link and integrate cancer
      Drug Administration has approved a number of digital                          abstracts, e-Path reports, WSIs, and Pathomics feature
      pathology systems for diagnostic use.[76] We expect that                      sets from all reporting facilities. De-identified images and
      digital pathology will be employed increasingly as part                       annotations will then be extracted for data mining and

            Journal of Pathology Informatics                                                                                                              7
[Downloaded free from http://www.jpathinformatics.org on Thursday, January 6, 2022, IP: 243.195.204.225]
Pathol Inform 2022, 1:5 http://www.jpathinformatics.org/content/13/1/5
Figure 6: A feature map representation of TIL and tumor analysis results generated from a WSI in the Cancer Genome Atlas repository. The low-
resolution version of the input WSI is displayed in the upper left corner. The upper right corner is the tumor segmentation map. The TIL map is
displayed in the lower left corner. The lower right corner is the combined and thresholded TIL and tumor maps
research use. Our work on building a repository of curated design, develop, and optimize algorithms and methods
WSIs and Pathomics features is an important step toward that can quickly and reliably search through a growing
realizing this capability. Availability of tissue images and reference library of cases to automatically identify and
Pathomics datasets will also provide an invaluable resource retrieve previously analyzed lesions which exhibit the
for medical education and Pathology training as well as to most similar characteristics to a given query case for
facilitate multi-disciplinary approaches, improved quality clinical decision support[20-22,25,79-86] and to conduct more
control, and more efficient remote and collaborative access granular comparisons of tumors within and across
to tissue information.[77,78] patient populations. One of the potential advantages of
this approach over purely alphanumeric search strategies
The first phase of our project focussed on the collection is that it will enable investigators to systematically
of cases and correlated pathology specimens from the interrogate the data while visualizing the most relevant
archives of New Jersey State Cancer Registries and digitized pathology specimens.[32,33]
Rutgers Cancer Institute of New Jersey and on targeted
prostate and NSCLC cases. To date, we have established As part of the next phase of our project, we plan to
a repository of (1) high-quality digitized pathology investigate the automated nature of the full range of
images for subjects whose data are already being algorithms and methods for their capacity to enable
routinely collected by the collaborating registries and (2) clinicians and investigators to quickly and reliably answer
Pathomics features consisting of patterns of TILs, tumor questions such as: (a) What level of morphological
region segmentations and classifications, and segmented variations are detected among a given set of tumors or
nuclei. We have completed the initial linkages with specimens? (b) What changes in computational biomarker
registry data, thus enabling the creation of information- signatures occur at onset and key stages of disease
rich, population cohorts containing objective imaging progression? (c) What is the likely prognosis for a given
and clinical attributes that can be mined. As part of the patient population?
second phase of the effort, we have increased the number
of contributing state registries to include Georgia, Software availability
Kentucky, and New York and we have simultaneously The QuIP software and analysis methods are available as
expanded the scope of cancers under study by including open-source codes for use by other research groups. The
melanoma, breast, and colorectal cancers. We will QuIP software platform can be downloaded and built
also build upon our team’s previous research efforts to from https://github.com/SBU-BMI/quip_distro.
8 8 Journal of Pathology Informatics[Downloaded free from http://www.jpathinformatics.org on Thursday, January 6, 2022, IP: 243.195.204.225]
Pathol Inform 2022, 1:5 http://www.jpathinformatics.org/content/13/1/5
Figure 7: Pathology image workflow. WSIs are de-identified and analyzed by deep-learning analysis pipelines deployed in containers. Image data are
linked to the SEER Registry database to enhance it with quantitative imaging features (such as TIL distributions and tumor segmentations) extracted
by deep-learning models. De-identified images and imaging features can then be used for data mining and research purposes
The codes for the analysis methods can be accessed 2. Berney DM, Algaba F, Camparo P, Compérat E, Griffiths D,
from links at https://github.com/SBU-BMI/ Kristiansen G, et al. The reasons behind variation in Gleason grading
of prostatic biopsies: Areas of agreement and misconception among
histopathology_analysis. 266 European pathologists. Histopathology 2014;64:405-11.
3. Bueno-de-Mesquita JM, Nuyten DS, Wesseling J, van Tinteren H,
Financial support and sponsorship Linn SC, van de Vijver MJ. The impact of inter-observer variation
in pathological assessment of node-negative breast cancer on
This work is supported, in part, by UG3CA225021, clinical risk assessment and patient selection for adjuvant systemic
UH3CA225021, U24 CA215109, U24CA180924-01A1, treatment. Ann Oncol 2010;21: 40-7.
and 5UL1TR003017 grants from the National Institutes of 4. Grilley-Olson JE, Hayes DN, Moore DT, Leslie KO, Wilkerson MD,
Health and generous contributions to Stony Brook from Bob Qaqish BF, et al. Validation of interobserver agreement in lung
cancer assessment: Hematoxylin-eosin diagnostic reproducibility
Beals and Betsy Barton. Additional support was provided for non-small cell lung cancer: The 2004 World Health Organization
through funding from the U.S. Department of Veterans classification and therapeutically relevant subsets. Arch Pathol Lab
Affairs – Boston Healthcare System through contract, Med 2013;137:32-40.
IPA-RU-092920. This work leveraged resources from 5. Matasar MJ, Shi W, Silberstien J, Lin O, Busam KJ, Teruya-
Feldstein J, et al. Expert second-opinion pathology review of
XSEDE, which is supported by NSF ACI-1548562 grant, lymphoma in the era of the World Health Organization classification.
including the Bridges system (NSF ACI-1445606) at the Ann Oncol 2012;23:159-66.
Pittsburgh Supercomputing Center. Services, results and/or 6. Muenzel D, Engels HP, Bruegel M, Kehl V, Rummeny EJ, Metz S.
products in support of the research were generated by Rutgers Intra- and inter-observer variability in measurement of target
lesions: Implication on response evaluation according to RECIST
Cancer Institute of New Jersey Biomedical Informatics 1.1. Radiol Oncol 2012;46:8-18.
Shared Resource NCI-CCSG P30CA072720-5917. 7. Nakazato Y, Maeshima AM, Ishikawa Y, Yatabe Y, Fukuoka J,
Yokose T, et al. Interobserver agreement in the nuclear grading of
primary pulmonary adenocarcinoma. J Thorac Oncol 2013;8:736-43.
Conflicts of interest 8. Netto GJ, Eisenberger M, Epstein JI; TAX 3501 Trial Investigators.
There are no conflicts of interest. Interobserver variability in histologic evaluation of radical
prostatectomy between central and local pathologists: Findings of
TAX 3501 multinational clinical trial. Urology 2011;77:1155-60.
References 9. Rizzardi AE, Johnson AT, Vogel RI, Pambuccian SE, Henriksen J,
1. Allsbrook WC Jr, Mangold KA, Johnson MH, Lane RB, Lane CG, Skubitz AP, et al. Quantitative comparison of immunohistochemical
Epstein JI. Interobserver reproducibility of Gleason grading of staining measured by digital image analysis versus pathologist visual
prostatic carcinoma: General pathologist. Hum Pathol 2001;32:81-8. scoring. Diagn Pathol 2012;7:42.
Journal of Pathology Informatics 9 [Downloaded free from http://www.jpathinformatics.org on Thursday, January 6, 2022, IP: 243.195.204.225]
Pathol Inform 2022, 1:5 http://www.jpathinformatics.org/content/13/1/5
10. Roggli VL, Vollmer RT, Greenberg SD, McGavran MH, Spjut HJ, correlation with oncotype DX risk categories in ER+ breast cancer
Yesner R. Lung cancer heterogeneity: A blinded and randomized whole slide images. Sci Rep 2016;6:32706.
study of 100 consecutive cases. Hum Pathol 1985;16:569-79. 29. Leo P, Lee G, Shih NN, Elliott R, Feldman MD, Madabhushi A.
11. Sørensen JB, Hirsch FR, Gazdar A, Olsen JE. Interobserver Evaluating stability of histomorphometric features across scanner
variability in histopathologic subtyping and grading of pulmonary and staining variations: Prostate cancer diagnosis from whole slide
adenocarcinoma. Cancer 1993;71:2971-6. images. J Med Imaging (Bellingham) 2016;3:047502.
12. Warth A, Stenzinger A, von Brünneck AC, Goeppert B, Cortis J, 30. Cooper LA, Gutman DA, Chisolm C, Appin C, Kong J, Rong Y,
Petersen I, et al. Interobserver variability in the application et al. The tumor microenvironment strongly impacts master
of the novel IASLC/ATS/ERS classification for pulmonary transcriptional regulators and gene expression class of glioblastoma.
adenocarcinomas. Eur Respir J 2012;40:1221-7. Am J Pathol 2012;180:2108-19.
13. Wilkins BS, Erber WN, Bareford D, Buck G, Wheatley K, East CL, 31. Chen XS, Wu JY, Huang O, Chen CM, Wu J, Lu JS, et al. Molecular
et al. Bone marrow pathology in essential thrombocythemia: subtype can predict the response and outcome of Chinese locally
Interobserver reliability and utility for identifying disease subtypes. advanced breast cancer patients treated with preoperative therapy.
Blood 2008;111:60-70. Oncol Rep 2010;23:1213-20.
14. Yoon SH, Kim KW, Goo JM, Kim DW, Hahn S. Observer variability 32. Beck AH, Sangoi AR, Leung S, Marinelli RJ, Nielsen TO,
in RECIST-based tumour burden measurements: A meta-analysis. van de Vijver MJ, et al. Systematic analysis of breast cancer
Eur J Cancer 2016;53:5-15. morphology uncovers stromal features associated with survival. Sci
15. Bennett JM. The FAB/MIC/WHO proposals for the classification Transl Med 2011;3:108ra113.
of the chronic lymphoid leukemias. Rev Clin Exp Hematol 33. Jögi A, Vaapil M, Johansson M, Påhlman S. Cancer cell
2002;6:330-4. differentiation heterogeneity and aggressive behavior in solid
16. Head DR, Savage RA, Cerezo L, Craven CM, Bickers JN, tumors. Ups J Med Sci 2012;117:217-24.
Hartsock R, et al. Reproducibility of the French-American-British 34. Ojansivu V, Linder N, Rahtu E, Pietikäinen M, Lundin M,
classification of acute leukemia: The Southwest Oncology Group Joensuu H, et al. Automated classification of breast cancer
Experience. Am J Hematol 1985;18:47-57. morphology in histopathological images. Diagn Pathol 2013;8:1-4.
17. Baumann I, Nenninger R, Harms H, Zwierzina H, Wilms K, 35. Cheng J, Mo X, Wang X, Parwani A, Feng Q, Huang K. Identification
Feller AC, et al. Image analysis detects lineage-specific of topological features in renal tumor microenvironment associated
morphologic markers in leukemic blast cells. Am J Clin Pathol with patient survival. Bioinformatics 2018;34:1024-30.
1996;105:23-30. 36. Chennubhotla C, Clarke LP, Fedorov A, Foran D, Harris G,
18. Gabril MY, Yousef GM. Informatics for practicing anatomical Helton E, et al. An assessment of imaging informatics for precision
pathologists: Marking a new era in pathology practice. Mod Pathol medicine in cancer. Yearb Med Inform 2017;26:110-9.
2010;23:349-58. 37. Colen R, Foster I, Gatenby R, Giger ME, Gillies R, Gutman D, et al.
19. Wedman P, Aladhami A, Beste M, Edwards MK, Chumanevich A, NCI workshop report: Clinical and computational requirements for
Fuseler JW, et al. A new image analysis method based on correlating imaging phenotypes with genomics signatures. Transl
morphometric and fractal parameters for rapid evaluation of in situ Oncol 2014;7:556-69.
mammalian mast cell status. Microsc Microanal 2015;21:1573-81. 38. Luo X, Zang X, Yang L, Huang J, Liang F, Rodriguez-Canales J,
20. Foran DJ, Comaniciu D, Meer P, Goodell LA. Computer-assisted et al. Comprehensive computational pathological image analysis
discrimination among malignant lymphomas and leukemia predicts lung cancer prognosis. J Thorac Oncol 2017;12:501-9.
using immunophenotyping, intelligent image repositories, and 39. Wang C, Pécot T, Zynger DL, Machiraju R, Shapiro CL, Huang K.
telemicroscopy. IEEE Trans Inf Technol Biomed 2000;4:265-73. Identifying survival associated morphological features of triple
21. Yang L, Tuzel O, Chen W, Meer P, Salaru G, Goodell LA, et al. negative breast cancer using multiple datasets. J Am Med Inform
Pathminer: A web-based tool for computer-assisted diagnostics in Assoc 2013;20:680-7.
pathology. IEEE Trans Inf Technol Biomed 2009;13:291-9. 40. Thorsson V, Gibbs DL, Brown SD, Wolf D, Bortone DS,
22. Foran DJ, Yang L, Chen W, Hu J, Goodell LA, Reiss M, et al. Imageminer: Ou Yang TH, et al.; Cancer Genome Atlas Research Network. The
A software system for comparative analysis of tissue microarrays using immune landscape of cancer. Immunity 2019;51:411-2.
content-based image retrieval, high-performance computing, and grid 41. Tille JC, Vieira AF, Saint-Martin C, Djerroudi L, Furhmann L,
technology. J Am Med Inform Assoc 2011;18:403-15. Bidard FC, et al. Tumor-infiltrating lymphocytes are associated with
23. Kurc T, Qi X, Wang D, Wang F, Teodoro G, Cooper L, et al. Scalable poor prognosis in invasive lobular breast carcinoma. Mod Pathol
analysis of big pathology image data cohorts using efficient methods 2020;33:2198-207.
and high-performance computing strategies. BMC Bioinform 42. Amgad M, Stovgaard ES, Balslev E, Thagaard J, Chen W,
2015;16:399. Dudgeon S, et al.; International Immuno-Oncology Biomarker
24. Ren J, Karagoz K, Gatza ML, Singer EA, Sadimin E, Foran DJ, et al. Working Group. Report on computational assessment of tumor
Recurrence analysis on prostate cancer patients with Gleason score infiltrating lymphocytes from the International Immuno-Oncology
7 using integrated histopathology whole-slide images and genomic Biomarker Working Group. NPJ Breast Cancer 2020;6:16.
data through deep neural networks. J Med Imaging (Bellingham) 43. Koh J, Kim S, Kim MY, Go H, Jeon YK, Chung DH. Prognostic
2018;5:047501. implications of intratumoral CD103+ tumor-infiltrating
25. Chen W, Meer P, Georgescu B, He W, Goodell LA, Foran DJ. lymphocytes in pulmonary squamous cell carcinoma. Oncotarget
Image mining for investigative pathology using optimized feature 2017;8:13762-9.
extraction and data fusion. Comput Methods Programs Biomed 44. Eriksen AC, Sørensen FB, Lindebjerg J, Hager H,
2005;79:59-72. dePont Christensen R, Kjær-Frifeldt S, et al. The prognostic
26. Girolami I, Gambaro G, Ghimenton C, Beccari S, Caliò A, value of tumor-infiltrating lymphocytes in stage II colon cancer.
Brunelli M, et al. Pre-implantation kidney biopsy: Value of A nationwide population-based study. Transl Oncol 2018;11:979-87.
the expertise in determining histological score and comparison 45. Zito Marino F, Ascierto PA, Rossi G, Staibano S, Montella M,
with the whole organ on a series of discarded kidneys. J Nephrol Russo D, et al. Are tumor-infiltrating lymphocytes protagonists or
2020;33:167-76. background actors in patient selection for cancer immunotherapy?
27. Yu KH, Zhang C, Berry GJ, Altman RB, Ré C, Rubin DL, et al. Exp Opin Biol Ther 2017;17:735-46.
Predicting non-small cell lung cancer prognosis by fully automated 46. Saltz J, Sharma A, Iyer G, Bremer E, Wang F, Jasniewski A, et al.
microscopic pathology image features. Nat Commun 2016;7:12474. A containerized software system for generation, management, and
28. Romo-Bucheli D, Janowczyk A, Gilmore H, Romero E, exploration of features from whole slide tissue images. Cancer Res
Madabhushi A. Automated tubule nuclei quantification and 2017;77:e79-82.
10 10 Journal of Pathology Informatics[Downloaded free from http://www.jpathinformatics.org on Thursday, January 6, 2022, IP: 243.195.204.225]
Pathol Inform 2022, 1:5 http://www.jpathinformatics.org/content/13/1/5
47. Sharma A, Tarbox L, Kurc T, Bona J, Smith K, Kathiravelu P, et al. 2014. [updated 2014 Jun 10; cited 2021 Oct 19]. Available from:
PRISM: A platform for imaging in precision medicine. JCO Clin http://arxiv.org/abs/1406.2661.
Cancer Inform 2020;4:491-9. 67. Graham S, Vu QD, Raza SEA, Azam A, Tsang YW, Kwak JT, et al.
48. Foran DJ, Chen W, Chu H, Sadimin E, Loh D, Riedlinger G, HoVer-Net: Simultaneous segmentation and classification of nuclei
et al. Roadmap to a comprehensive clinical data warehouse for in multi-tissue histology images. Med Image Anal 2019;58:101563.
precision medicine applications in oncology. Cancer Inform 68. van Griethuysen JJM, Fedorov A, Parmar C, Hosny A, Aucoin N,
2017;16:1176935117694349. Narayan V, et al. Computational radiomics system to decode the
49. Madabhushi A, Lee G. Image analysis and machine learning in radiographic phenotype. Cancer Res 2017;77:e104-7.
digital pathology: Challenges and opportunities. Med Image Anal 69. Pantanowitz L, Sharma A, Carter AB, Kurc T, Sussman A, Saltz J.
2016;33:170-5. Twenty years of digital pathology: An overview of the road
50. Wang S, Yang DM, Rong R, Zhan X, Xiao G. Pathology image travelled, what is on the horizon, and the emergence of vendor-
analysis using segmentation deep learning algorithms. Am J Pathol neutral archives. J Pathol Inform 2018;9:40.
2019;189:1686-98. 70. Brunelli M, Beccari S, Colombari R, Gobbo S, Giobelli L,
51. Bozorgtabar B, Mahapatra D, Zlobec I, Rau TT, Thiran JP. Editorial: Pellegrini A, et al. iPathology cockpit diagnostic station: Validation
Computational pathology. Front Med (Lausanne) 2020;7:245. according to College of American Pathologists Pathology and
52. Deng S, Zhang X, Yan W, Chang EI, Fan Y, Lai M, et al. Deep Laboratory Quality Center recommendation at the hospital trust
learning in digital pathology image analysis: A survey. Front Med and University of Verona. Diagn Pathol 2014;9(Suppl. 1):S12.
2020;14:470-87. 71. Griffin J, Treanor D. Digital pathology in clinical use: Where are we
53. Niazi MKK, Parwani AV, Gurcan MN. Digital pathology and now and what is holding us back? Histopathology 2017;70:134-45.
artificial intelligence. Lancet Oncol 2019;20:e253-61. 72. Zarella MD, Bowman D, Aeffner F, Farahani N, Xthona A,
54. Gurcan MN, Boucheron LE, Can A, Madabhushi A, Rajpoot NM, Absar SF, et al. A practical guide to whole slide imaging: A white
Yener B. Histopathological image analysis: A review. IEEE Rev paper from the digital pathology association. Arch Pathol Lab Med
Biomed Eng 2009;2:147-71. 2019;143:222-34.
55. Panayides AS, Amini A, Filipovic ND, Sharma A, Tsaftaris SA, 73. Aeffner F, Zarella MD, Buchbinder N, Bui MM, Goodman MR,
Young A, et al. AI in medical imaging informatics: Current Hartman DJ, et al. Introduction to digital image analysis in whole-
challenges and future directions. IEEE J Biomed Health Inform slide imaging: A white paper from the Digital Pathology Association.
2020;24:1837-57. J Pathol Inform 2019;10:9.
56. Abousamra S, Hou L, Gupta R, Chen C, Samaras D, Kurc T, et al. 74. Lee JJ, Jedrych J, Pantanowitz L, Ho J. Validation of digital
Learning from thresholds: Fully automated classification of tumor pathology for primary histopathological diagnosis of routine,
infiltrating lymphocytes for multiple cancer types. arXiv [eess.IV] inflammatory dermatopathology cases. Am J Dermatopathol
2019. [updated 2019 Jul 9; cited 2021 Oct 19]. Available from: http:// 2018;40:17-23.
arxiv.org/abs/1907.03960. 75. Pantanowitz L, Michelow P, Hazelhurst S, Kalra S, Choi C, Shah S,
57. Saltz J, Gupta R, Hou L, Kurc T, Singh P, Nguyen V, et al.; Cancer et al. A digital pathology solution to resolve the tissue floater
Genome Atlas Research Network. Spatial organization and conundrum. Arch Pathol Lab Med 2021;145:359-64.
molecular correlation of tumor-infiltrating lymphocytes using deep 76. Evans AJ, Bauer TW, Bui MM, Cornish TC, Duncan H, Glassy EF,
learning on pathology images. Cell Rep 2018;23:181-93.e7. et al. US Food and Drug Administration approval of whole slide
58. Le H, Samaras D, Kurc T, Gupta R, Shroyer K, Saltz J. Pancreatic imaging for primary diagnosis: A key milestone is reached and new
cancer detection in whole slide images using noisy label annotations. questions are raised. Arch Pathol Lab Med 2018;142:1383-7.
In: Medical Image Computing and Computer Assisted Intervention 77. Eccher A, Neil D, Ciangherotti A, Cima L, Boschiero L,
(MICCAI), October 13-17, 2019, Shenzhen, China. New York: Martignoni G, et al. Digital reporting of whole-slide images is safe
Springer; 2019. p. 541-9. and suitable for assessing organ quality in preimplantation renal
59. Le H, Gupta R, Hou L, Abousamra S, Fassler D, Torre-Healy L, biopsies. Hum Pathol 2016;47:115-20.
et al. Utilizing automated breast cancer detection to identify spatial 78. Cima L, Brunelli M, Parwani A, Girolami I, Ciangherotti A,
distributions of tumor-infiltrating lymphocytes in invasive breast Riva G, et al. Validation of remote digital frozen sections for cancer
cancer. Am J Pathol 2020;190:1491-504. and transplant intraoperative services. J Pathol Inform 2018;9:34.
60. Hou L, Agarwal A, Samaras D, Kurc TM, Gupta RR, Saltz JH. 79. Tuzel O, Yang L, Meer P, Foran DJ. Classification of hematologic
Robust histopathology image analysis: To label or to synthesize? malignancies using texton signatures. Pattern Anal Appl
Proc IEEE Comput Soc Conf Comput Vis Pattern Recognit 2007;10:277-90.
2019;2019:8533-42. 80. Cukierski WJ, Nandy K, Gudla P, Meaburn KJ, Misteli T, Foran DJ,
61. Hou L, Gupta R, Van Arnam JS, Zhang Y, Sivalenka K, Samaras D, et al. Ranked retrieval of segmented nuclei for objective assessment
et al. Dataset of segmented nuclei in hematoxylin and eosin stained of cancer gene repositioning. BMC Bioinform 2012;13:232.
histopathology images of ten cancer types. Sci Data 2020;7:185. 81. Qi X, Wang D, Rodero I, Diaz-Montes J, Gensure RH, Xing F, et al.
62. Simonyan K, Zisserman A. Very deep convolutional networks Content-based histopathology image retrieval using CometCloud.
for large-scale image recognition. arXiv [cs.CV] 2014. [updated BMC Bioinform 2014;15:287.
2015 Apr 10; cited 2021 Oct 19]. Available from: http://arxiv.org/ 82. Yang L, Qi X, Xing F, Kurc T, Saltz J, Foran DJ. Parallel
abs/1409.1556. content-based sub-image retrieval using hierarchical searching.
63. Szegedy C, Ioffe S, Vanhoucke V, Alemi A. Inception-v4, Inception- Bioinformatics 2014;30:996-1002.
ResNet and the impact of residual connections on learning. AAAI 83. Chen W, Schmidt C, Parashar M, Reiss M, Foran DJ. Decentralized
2017;31. Available from: https://ojs.aaai.org/index.php/AAAI/ data sharing of tissue microarrays for investigative research in
article/view/11231. oncology. Cancer Inform 2007;2:373-88.
64. He K, Zhang X, Ren S, Sun J. Deep residual learning for image 84. Yang L, Chen W, Meer P, Salaru G, Feldman MD, Foran DJ. High
recognition. In: Proceedings of the IEEE Conference on Computer throughput analysis of breast cancer specimens on the grid. Med
Vision and Pattern Recognition, June 27-30, 2016, Las Vegas, NV. Image Comput Comput Assist Interv 2007;10:617-25.
Piscataway, NJ: IEEE; 2016. p. 770-8. 85. Qi X, Kim H, Xing F, Parashar M, Foran DJ, Yang L. The analysis
65. Falk T, Mai D, Bensch R, Çiçek Ö, Abdulkadir A, Marrakchi Y, et al. of image feature robustness using CometCloud. J Pathol Inform
U-net: Deep learning for cell counting, detection, and morphometry. 2012;3:33.
Nat Methods 2019;16:67-70. 86. Chen Y, McGee J, Chen X, Doman TN, Gong X, Zhang Y, et al.
66. Goodfellow IJ, Pouget-Abadie J, Mirza M, Xu B, Warde-Farley D, Identification of druggable cancer driver genes amplified across
Ozair S, et al. Generative adversarial networks. arXiv [stat.ML] TCGA datasets. PLoS One 2014;9:e98293.
Journal of Pathology Informatics 11 You can also read