An eel population structure in the Waikato hydro-reservoirs their tributaries with respect to elver stocking, up to 2013
←
→
Page content transcription
If your browser does not render page correctly, please read the page content below
An     assessment    of    the   eel
population structure in the Waikato
hydro-reservoirs      and      their
tributaries with respect to elver
stocking, up to 2013
New Zealand Fisheries Assessment Report 2022/02

      J.A.T. Boubée, M. Martin, J. Smith,
      B. Bartels, E.K. Williams, S.K. Crow

ISSN 1179-5352 (online)
ISBN 978-1-99-102624-8 (online)

January 2022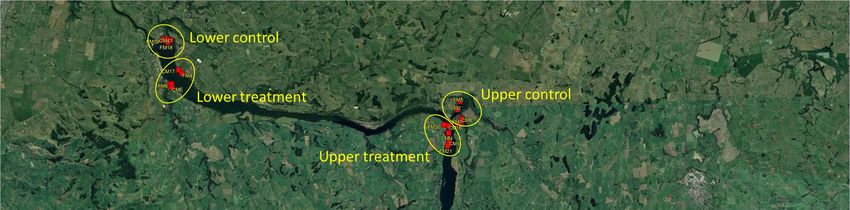
Requests for further copies should be directed to:

Fisheries Science Editor
Fisheries New Zealand
Ministry for Primary Industries
PO Box 2526
Wellington 6140
NEW ZEALAND

Email: Fisheries-Science.Editor@mpi.govt.nz
Telephone: 0800 00 83 33

This publication is also available on the Ministry for Primary Industries websites at:
http://www.mpi.govt.nz/news-and-resources/publications
http://fs.fish.govt.nz go to Document library/Research reports

© Crown Copyright – Fisheries New Zealand
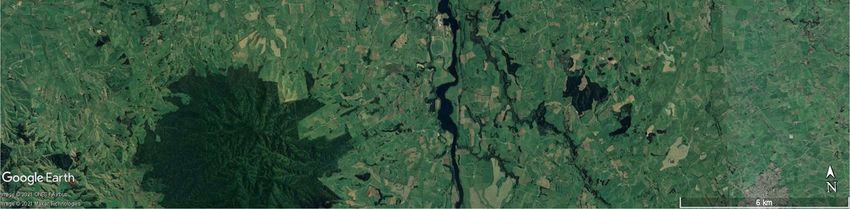
TABLE OF CONTENTS

EXECUTIVE SUMMARY                                                    1

1.         INTRODUCTION                                             2
     1.1     Project objectives                                     5
     1.2      Project limitations                                   6

2.         METHODS                                                   6
     2.1     Survey overview                                         6
     2.2      Survey areas and techniques                            7
     2.3      Data collection                                       14
     2.4      Data analysis                                         16

3.         RESULTS                                                  16
     3.1     Species distribution and total catch                   16
     3.2      Catch per unit effort                                 21
     3.3      Length-weight relationships                           25
     3.4      Population structure                                  26
     3.5      Growth                                                30
     3.6      Comparison between tributaries and hydro-reservoirs   32

4.         DISCUSSION                                               34
     4.1      Eel distribution and density changes through time     34
     4.2      Size distribution changes through time                36
     4.3      Age and growth changes through time                   37
     4.4      Comparison between tributaries and hydro-reservoirs   38

5.         MANAGEMENT IMPLICATIONS                                  39

6.         CONCLUSIONS AND RECOMMENDATIONS                          39

7.         ACKNOWLEDGMENTS                                          40

8.         REFERENCES                                               40

APPENDIX 1                                                          43

APPENDIX 2                                                          44

APPENDIX 3                                                          45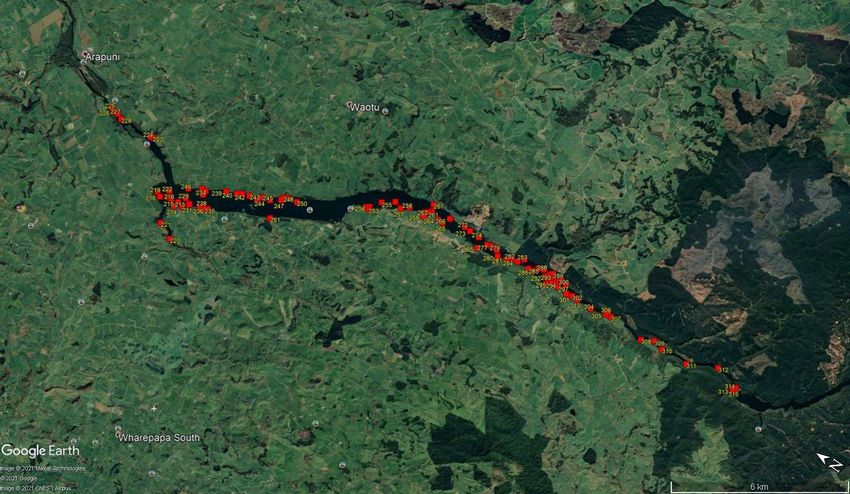
EXECUTIVE SUMMARY Boubée, J.A.T.1,[2]; Martin, M.1; Smith, J.1; Bartels, B. 1; Williams, E.K. 1; Crow, S.K. 1 (2022). An assessment of the eel population structure in the Waikato hydro-reservoirs and their tributaries with respect to elver stocking, up to 2013. New Zealand Fisheries Assessment Report 2022/02. 45 p. Pressures on the lower Waikato commercial eel fishery, and hapū/iwi concerns about the decline of customary catches due to lack of passage for recruits over hydro-electric dams led to the implementation in the early 1990s of an elver trap-and-transfer programme from the base of Karāpiro Dam to the chain of hydro-reservoirs upstream. Although the elver trap-and-transfer programme has been well monitored, there is little information on the resulting eel population in the upstream hydro-reservoirs that are now commercially fished. This study was initiated in partnership with hapū/iwi and other stakeholders to assess the status of eel populations in selected hydro-reservoirs, and their associated tributaries, which have cultural and historical significance. In total, five Karāpiro, seven Arapuni, and eleven Whakamaru tributaries were fished between December 2010 and November 2012 using electric fishing, as well as a variety of fyke nets. Lake Arapuni was also intensively fished with fyke nets in December 2012 and February 2013. Both Lake Ātiamuri and Lake Whakamaru were fished with fyke nets in February 2012. Information obtained included species distribution, catch per unit effort, species composition, size and age structure, as well as growth rates, and these were compared with historical records. The types of nets and method of deployment varied between locations, to account for differences in depth, flow, and macrophyte cover. Furthermore, it was known that some habitats, notably sections of the hydro-reservoirs, and some stream reaches with woody debris and/or rocky substrate may not only be more productive, but also favour longfin eels. This makes direct comparisons of eel populations between hydro-reservoirs, tributaries, and years problematic. However, records clearly indicate that eel populations had increased markedly in the hydro-reservoirs and most associated tributaries since elver trap-and-transfer operations began. Furthermore, survey results indicate that longfins were far more widely distributed than shortfins in tributaries, but that small shortfins dominated the catches from hydro-reservoirs. Eel growth rates in the hydro-reservoirs surveyed (i.e., Arapuni, Whakamaru, and Ātiamuri) were linear, though variable, and have declined over the last two decades. However, growth rates were still higher than growth rates observed in the lower Waikato River. Eels have gained access to the tributaries from the hydro-reservoirs, although where natural barriers are present the recruitment has been limited, and there could be value in stocking tributaries directly. In habitats where kōura are harvested for food, it would be best to delay any direct elver transfers until the effect of eel predation on kōura populations had been thoroughly examined. Mortality of downstream migrant eels passing through the hydro-turbines remains a major concern for hapū/iwi, stakeholders, and the power scheme owners. Maximising eel harvest in both the tributaries and the reservoirs, with the option of transferring large eels to the river below Karāpiro Dam, would minimise the number of migrant eels affected. The outcomes of this study were presented to the Eel Working Group in Christchurch on 11 October 2012, and in Hamilton on 1 November 2012. The project was undertaken in partnership with Ngāti Koroki Kahukura, Raukawa, the Te Arawa River Iwi Trust, Waikato-Tainui, and the Eel Enhancement Company, with co-funding provided by Mercury Energy (Waikato River Iwi Summer Internship Programme) and the Ministry of Business, Innovation and Employment (Contract No. C01X1002). 1 National Institute of Water and Atmospheric Research (NIWA), New Zealand. [2] Current address: Vaipuhi Freshwater Consulting Ltd, New Zealand. Fisheries New Zealand Assessment of the eel population structure in the Waikato hydro-reservoirs and their tributaries 1

1. INTRODUCTION
The Waikato River catchment has been modified by a series of hydro-electric developments which have
restricted freshwater fish passage. There are nine hydro structures between Port Waikato (Te Pūaha of
Waikato) and the control gates at the outlet of Lake Taupō (Figure 1). Karāpiro is the first in this series
of dams that prevent migratory freshwater fish from accessing upstream areas. Dams are known to
restrict the movement of diadromous fish, like the freshwater eel (Anguilla spp.), generally resulting in
their reduction or loss from above-dam habitats. Further, they create artificial lentic ecosystems that
exotic species can successively exploit (Jellyman & Harding 2012).
Figure 1: Location of major electricity generation sites within the Waikato River catchment (source:
NIWA 2010). Note: this map uses the double vowel convention preferred by Waikato-Tainui.
Historically, freshwater fishes had unimpeded access up the Waikato River as far as the Horahora rapids
(Figure 2), but these were submerged after the Karāpiro Dam was commissioned in 1947 and Lake
Karāpiro was formed. In its natural state, upstream passage of fishes beyond the Horahora rapids was
limited to species with good climbing abilities such as juvenile longfin (Anguilla dieffenbachii) and
shortfin (A. australis) eels. However, further upstream passage for even these species was yet again
restricted by a series of rapids and waterfalls (Figure 3), notably those that were submerged after the
Arapuni Dam was commissioned in 1929, as well as the Waipāpa Falls which were believed to have
2 Assessment of the eel population structure in the Waikato hydro-reservoirs and their tributaries Fisheries New Zealand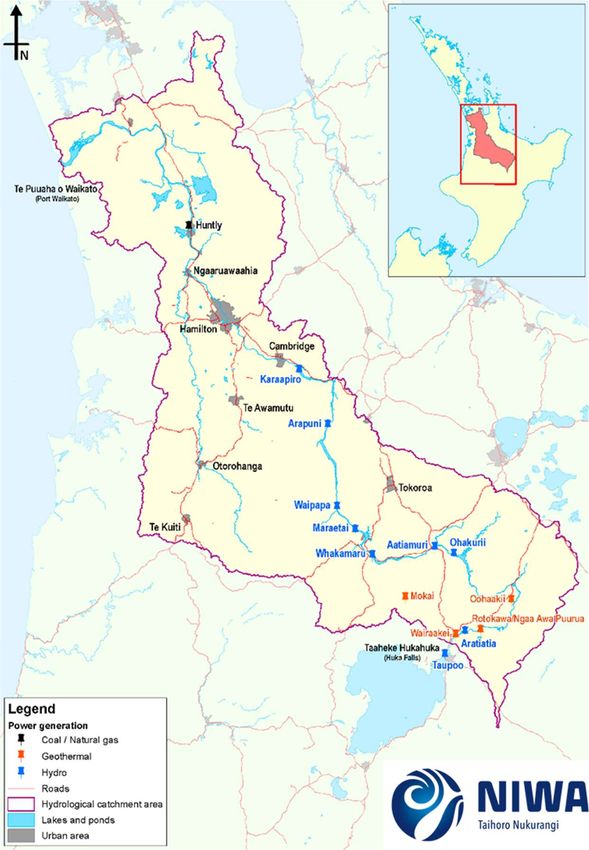
been as large as the Huka Falls at the head of Lake Aratiatia. However, it is likely that construction of
Arapuni Dam [with its original leaky board spillway] actually eased the upstream passage of eels
beyond these rapids and waterfalls (Hobbs 1940, Cairns 1941, McDowall 1991).
Figure 2: Photograph taken in March 1906 of the Horahora rapids on the Waikato River (held by Sir
George Grey Special Collections, Auckland Libraries, AWNS-19060308-2-2). These rapids
were submerged when Karāpiro Dam was completed around 1947.
Figure 3: Map of the “Southern Part of the Province of Auckland” produced by Ferdinand von
Hochstetter and published in 1867. This close-up of the Waikato River shows the sites where
von Hochstetter observed rapids and waterfalls that were submerged by the formation of lakes
Karāpiro and Arapuni (source: https://teara.govt.nz/en/zoomify/27081/hochstetters-map). The
black circle shows the site of the Karāpiro Dam, the red circle shows the location of the
Horahora rapids depicted in Figure 2, and the grey circle shows the location of the Arapuni
Dam.
Fisheries New Zealand Assessment of the eel population structure in the Waikato hydro-reservoirs and their tributaries 3
The Karāpiro Dam blocked most elver (juvenile eel) recruitment when it was constructed two decades after the Arapuni Dam. At the request of the Auckland Acclimatisation Society (AAS), an electric barrier was even incorporated into the spillway at the Karāpiro Dam to prevent elvers climbing the spillway (AAS 1947). At the same time, the AAS made strenuous efforts to eradicate eels above Karāpiro Dam (AAS 1948). Despite these efforts, a remnant population of eels (which are long-lived), remained, at least up to Mangakino, well into the 1990s (Bioresearches 1994). Some passage of eels over Karāpiro Dam must have still been possible because a limited commercial fishery existed through the mid-1980s to early 1990s in Karāpiro Reservoir, which could not have been maintained without new recruits. A commercial fishery also existed to a more limited extent in Arapuni Reservoir over the same time frame, but this may have been supplemented by artificial seeding (Chisnall 1993, Bioresearches 1994, Allen 2010). A fyke netting and electric fishing survey undertaken between November 1992 and April 1993 in the catchments of lakes Karāpiro, Arapuni, and Waipāpa indicated that, although a few eels remained in Karāpiro and Arapuni reservoirs, very few made it up the tributaries that were traditional eel fishing grounds for hapū/iwi (Bioresearches 1994). In response to increased pressures on the lower Waikato River commercial eel fishery and hapū/iwi concerns about the decline of customary catches, a series of initiatives were started in 1991–92 that aimed to increase the overall biomass of the eel fishery and improve the availability for all (see Allen 2010 for details). These initiatives included the stocking/enhancement of the Waikato hydro-reservoirs. Once negotiations and permits were issued by the Ministry of Agriculture and Fisheries [now Fisheries New Zealand], 110 kg of elvers were captured from the base of Karāpiro Dam and released into the Karāpiro reservoir in early January 1993. Further consultation led to the amendment of the permit to include transfers to Lake Arapuni in February 1994. The special permit issued in January 1995 included the seven lowermost reservoirs (i.e., excluding Lake Aratiatia), with the first transfer made to Waipāpa and Maraetai in summer 1994–95. The first official transfer to lakes Whakamaru, Ātiamuri, and Ohakurī did not occur until summer 1996–97. The maximum quantity of juvenile eels that could be released at these sites annually were as follows: Lake Karāpiro (no limit), Lake Arapuni (550 kg), Lake Waipāpa (100 kg), Lake Maraetai (250 kg), Lake Whakamaru (450 kg), Lake Ātiamuri (140 kg), and Lake Ohakurī (750 kg). The special permits to transfer elvers into the seven hydro-reservoirs continued in varying forms until summer of 2017–18 when, at the request of Ngāti Tahu-Ngāti Whaoa Runanga Trust, the two uppermost reservoirs were excluded as permitted elver stocking/enhancement sites. Between 1992–93 and 2011–12, when this study was initiated, it is estimated that around 26 831 000 juvenile eels (approximately 19% longfin) were captured and transferred upstream from Karāpiro Dam (Martin & Bowman 2016). Over the first 20 years of the Karāpiro trap-and-transfer programme, the majority (67%) of juvenile eels were transferred into three hydro-reservoirs: Karāpiro (29%), Arapuni (20%), and Ohakurī (19%) (Figure 4). 4 Assessment of the eel population structure in the Waikato hydro-reservoirs and their tributaries Fisheries New Zealand
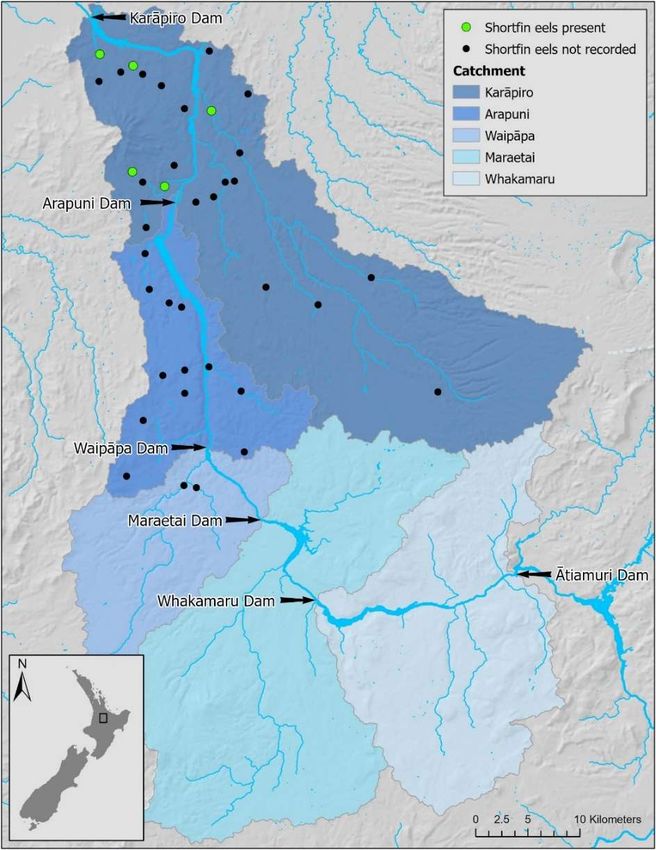
Figure 4: Estimated proportion of juvenile eels transferred into each of the Waikato River hydro-
reservoirs between 1992 and 2012. During this period, it is estimated that around 26 831 000
juvenile eels (approximately 19% longfin) were captured and transferred upstream from
Karāpiro Dam (source: Martin & Bowman 2016).
Early indications of the effect of juvenile eel stocking were very positive, with an increased abundance
of commercial-sized eels and accelerated growth rates observed in the enhanced reservoirs, which are
part of Fisheries Management Area SFE 21 (shortfin) and LFE 21 (longfin) (Beentjes et al. 1997,
Boubée et al. 2003, Boubée & Jellyman 2009). Accordingly, the commercial eel industry anticipated
that the hydro-reservoirs would be important additions to the areas available for commercial fishing;
and that this, in turn, could reduce commercial fishing pressure on downstream reaches of the Waikato
River. However, despite the implementation of the Karāpiro elver trap-and-transfer programme, the
commercial harvest from the enhanced hydro-reservoirs in more recent times is substantially less than
members of the commercial eel industry anticipated. Boubée et al. (2003) noted that slower growth
rates would be expected if stocking densities exceeded food availability. In addition, power station
operators have observed that many of the elvers that are released continue to migrate upstream and
accumulate at the base of the next power station, where further mortality occurs through desiccation on
the dam face as well as predation by fish, birds, and rodents.
One approach that has been proposed to reduce loss of elvers, and perhaps discourage their tendency to
migrate upstream towards the next dam, is to make some releases directly into hydro-reservoir
tributaries and associated ponds and wetlands. Such areas would provide the flowing water preferred
by longfins (Jellyman et al. 2003) and wetlands/ponds preferred by shortfins (McDowall & Taylor
2000), which could lead to improved abundance and sizes of both species. However, upstream of
Karāpiro Dam very little is known about the present status of the eel populations.
1.1 Project objectives
In December 2011, the predecessor of Fisheries New Zealand contracted NIWA (project EEL2011-01)
to establish the status of eel populations in two Waikato hydro-reservoirs (where elvers have been
stocked) and their associated tributaries. The specific objective of the study as defined in the project
description was:
To establish the distribution, population structure and growth rate of eels in tributaries of two
of the middle Waikato systems (preferably tributaries of lakes Karāpiro and Whakamaru that
have special cultural and traditional significance) and compare findings with records obtained
in the hydro reservoirs.
The project was undertaken in partnership with Ngāti Koroki Kahukura, Raukawa, the Te Arawa River
Iwi Trust, Waikato-Tainui, and the Eel Enhancement Company (EECo), with co-funding provided by
Fisheries New Zealand Assessment of the eel population structure in the Waikato hydro-reservoirs and their tributaries 5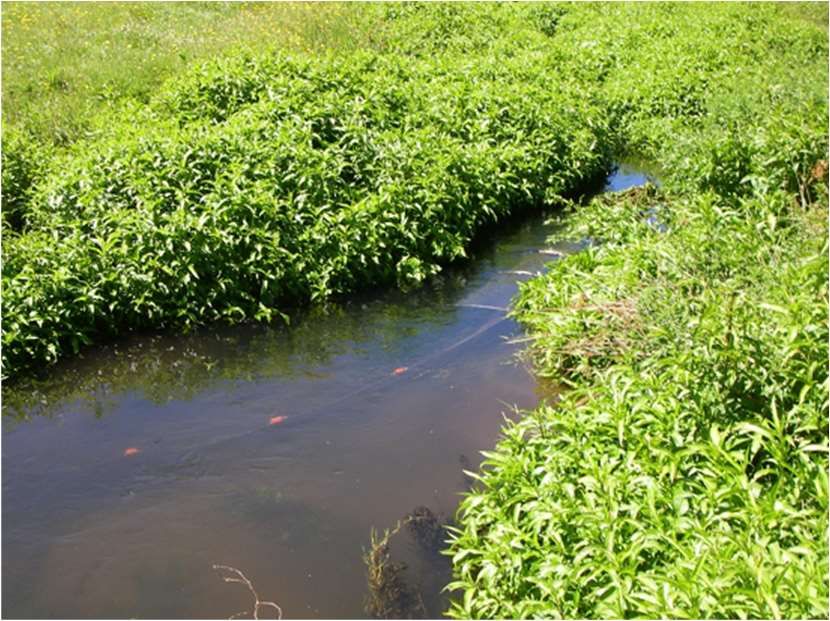
Mercury Energy (Waikato River Iwi Summer Internship Programme) and the Ministry of Business,
Innovation and Employment (MBIE) (Contract No. C01X1002).
1.2 Project limitations
The project’s Specific Objectives stated that eel survey efforts should preferably target the tributaries
of lakes Karāpiro and Whakamaru and to compare eel distribution, population structure, and growth
rates between the tributaries and the hydro-reservoirs. However, there were several sampling and
logistical limitations which prevented robust comparisons of eel populations between all tributaries and
all the lakes. In particular:
1. The project endeavoured to set fine- and coarse-mesh fyke nets in both the hydro-reservoirs
and tributaries of Lake Karāpiro and Whakamaru so that eel populations could be directly
compared between tributaries and hydro-reservoirs as per the project objectives. However, most
tributaries of Lake Karāpiro and Whakamaru proved too small to set fyke nets effectively.
Where a tributary could be fished with fyke nets, invariably the space available to set a net was
very restricted. Electric fishing was therefore the only method that could consistently be used
to survey the tributaries of Lake Karāpiro and Whakamaru. Unfortunately, electric fishing could
not be completed in the lakes because they are too deep, which means the results from electric
fishing surveys in tributaries and fyke netting data from the lakes could not be directly
compared. Similarly, tributaries of Lake Ātiamuri could not be surveyed using fyke netting
methods, which limited comparisons between hydro-reservoirs and tributaries for the Lake
Ātiamuri catchment.
2. The eel population in Lake Karāpiro was not surveyed in this project because a comprehensive
eel dataset already existed (Matheson et al. 2010), which was reused in this study. These eel
surveys were completed as part of monitoring undertaken for an aquatic macrophytes control
programme undertaken by Land Information New Zealand (LINZ) between 2007 and 2010 (see
Matheson et al. 2010). This existing dataset was therefore re-examined in the context of this
project. This was done so that efficiencies could be gained, and survey efforts redirected to
parts of the catchment (i.e., Arapuni and Ātiamuri) where fyke netting of the tributaries was
more likely to be successful, while also surveying sites with knowledge gaps in the eel
populations.
3. Because of the low eel numbers observed in many of the tributaries, the hapū/iwi partners
requested that all eels captured in the tributaries be returned live at the place of capture, so no
ageing was possible. This meant that age and growth rates could not be compared amongst
tributary sites, or between tributaries and the hydro-reservoirs.
Given all of the aforementioned limitations and the limited datasets available, our comparison of the
eel population between tributaries and hydro-reservoirs was focused on the Karāpiro catchment only.
Characteristics of the eel populations from the other hydro lakes (i.e., excluding Lake Karāpiro) are
described in this study (i.e., distribution, population structure, and growth rates), and where possible,
these results are compared with historical records.
2. METHODS
2.1 Survey overview
In the Whakamaru hydro-reservoir catchment, eel populations in both the lake and tributaries were
surveyed. Eel populations in the tributaries of Lake Karāpiro were surveyed but not the lake itself (see
Section 1.2). In the Arapuni hydro-reservoir catchment, both the lake and the tributaries were surveyed,
whereas only the lake populations in the Ātiamuri hydro-reservoir catchment were examined.
It was necessary to use a mixture of electric fishing and fyke netting to sample eel populations in the
tributaries and lakes of each hydro-reservoir. A summary of habitats sampled and the different fishing
6 Assessment of the eel population structure in the Waikato hydro-reservoirs and their tributaries Fisheries New Zealandmethods used is given in Table 1. At present, there is no single survey method that can sample all eel
size classes effectively across the range of freshwater habitats they occupy (e.g., lakes, river mainstems,
and streams of varying depth, water velocity, and macrophyte cover). Electric fishing is typically more
effective in shallow streams, especially where elvers are present, whereas fyke nets are typically more
effective for deeper waters with larger eels. In the lakes, different fyke net types and means of
deployment were used to account for variability in depth, flow, and substrate (see Section 2.2).
Consequently, a direct comparison of the distribution and population structure of eels between
tributaries and lakes in the hydro-reservoir catchments by quantifiable means is not possible (see
explanation in Section 1.2.)
Table 1: Summary of the hydro-reservoirs and survey methods used to examine eel populations in this
study.
Hydro-reservoir Fyke netting in lake Electric fishing of tributaries Fyke netting of tributaries
Karāpiro x
Arapuni
Whakamaru x
Ātiamuri x x
2.2 Survey areas and techniques
Electric fishing of tributaries
Electric fishing surveys of Karāpiro, Arapuni, and Whakamaru hydro-reservoir tributaries were
conducted over three time periods between December 2011 and November 2012.
Five Karāpiro tributaries were surveyed between 21 December 2011 and 8 February 2012.
These were: Mangakara (1 reach), Huihuitaha (5 reaches), Raparahi (a tributary of the Waipā
3 reaches), Waipā (2 reaches), and an unnamed tributary near Arapuni township (1 reach).
Seven Arapuni tributaries were surveyed between 17 and 20 January 2012. These were:
Makomako (1 reach), Mangare (4 reaches), Mangawhio (3 reaches), Ngautaramoa (3 reaches),
Te Rimu (1 reach), Tumai (1 reach), and unnamed tributary A1 (1 reach).
Eleven Whakamaru tributaries were surveyed between 26 and 30 November 2012. These were:
Mangatutu (1 reach), Maraemanuka (2 reaches), Mokautere (2 reaches), Okama (3 reaches),
Ongarahu (1 reach), Opareiti (3 reaches), Potungutungu (2 reaches), Te Rakau (1 reach),
Waiharuru (1 reach), Waipāpa (4 reaches), and unnamed tributary W1 (1 reach).
At each tributary, electric fishing was conducted in between one and five reaches depending on access
and availability of suitable habitat. A Kainga EFM300 battery powered backpack electric fishing
machine (EFM) fitted with a single pole-mounted anode was used to fish 15- to 60-m long reaches of
accessible stream during daylight hours (machine set on 200 to 300 volts, pulse rate 60 pps and pulse
width 2 ms). Details of the surveyed tributaries and fishing effort are given in Appendices 1 and 2.
Beginning at the downstream end of each reach, a small, roughly 4-m long section was electric-fished
into a one-metre-wide hand-held stop net. A dip net was also used to quickly remove any fish attracted
to the anode. This process was then repeated across the entire width of the stream before progressing
upstream. All available habitats within each reach were fished without bias, including shallow margins
that may have appeared to be devoid of fish. A combination of single- and multiple-pass fishing was
used, depending on the catches obtained, with passes repeated until all fish present were considered to
have been removed. Where eels appeared to be absent or present in very low densities, some spot fishing
outside the reach was also used to target typical eel habitats (e.g., undercut banks and logjams) to
confirm this. All of the catch was placed into a bucket filled with water from the stream before being
identified, measured, and generally returned unharmed to the stream.
Fisheries New Zealand Assessment of the eel population structure in the Waikato hydro-reservoirs and their tributaries 7Fyke netting of tributaries and hydro-reservoirs
A combination of fine (4-mm mesh) and coarse (12-mm mesh) fyke nets with 600-mm drop, D opening,
double funnelled and 5-m single leaders were used to sample eel populations in the tributaries and
hydro-reservoirs (Table 2). Net types and setting arrangements used were as follows:
CO = Single-cod commercial eel coarse-mesh fyke with an escapement tube;
DCO = Double-cods commercial eel coarse-mesh fyke nets set leader to leader (in a linear
arrangement), also with an escapement tube;
DC = Double-cods coarse-mesh fyke nets set leader to leader;
DF = Double-cods fine-mesh fyke nets set leader to leader;
SC = Single-cod coarse-mesh fyke nets; and
SF = Single-cod fine-mesh fyke nets.
The double-cods nets (DCO, DC, and DF) were all set in the deeper water of the hydro-reservoirs but
were treated as one set (one of the nets always captured more fish than the other). Coarse-mesh nets
(DC) were set where high flows were encountered. Single-cod nets tended to be used along the shoreline
and in tributaries, but always so they remained submerged, notably in the reservoirs during lake
drawdown. Each net was tagged with a clip-on numbered label that was transferred to the holding bag
when the nets were emptied. All nets were baited with rudd or pierced cat food sachets and left to fish
overnight.
Single-cod fyke nets were the only net type used in the tributaries where the water depth was more than
600 mm. In the Karāpiro catchment, five tributaries were sampled using fyke nets, but in the Arapuni
catchment only one tributary was large enough for fyke nets to be deployed (Table 2). The fyke nets
were all set with the cod end upstream. Fine-mesh fykes were preferred because they can catch a wider
range of fish species and sizes, but they could only be set where water velocities were low enough so
as not to displace the net. Consequently, coarse-mesh fykes were also set where needed.
Table 2: Summary of single-cod fyke net types and numbers used to survey eel populations in the
tributaries of Karāpiro and Arapuni hydro-reservoirs. Refer to text for description of net type
codes.
Hydro-reservoir Tributary No. & type of net Date sampled
Karāpiro Waipā 2 x coarse-mesh (SC) 17 November 2011
Mangakara Site 1 3 x coarse-mesh (SC) 21 December 2011
2 x fine-mesh (SF)
Mangakara Site 2 3 x coarse-mesh (SC) 22 December 2011
2 x fine-mesh (SF)
Waitete 2 x coarse-mesh (SC) 22 December 2011
1 x fine-mesh (SF)
Huihuitaha (upper) 7 x fine-mesh (SF) 26 January 2012
Huihuitaha (lower) 7 x fine-mesh (SF) 27 January 2012
Rapahi (trib. of Waipā) 7 x fine-mesh (SF) 1 February 2012
Arapuni Mangare 3 x coarse-mesh (SC) 22 December 2011
1 x fine-mesh (SF)
A combination of commercial fine- and coarse-mesh fyke nets were used in the three hydro-reservoirs
that were surveyed during the study (Table 3). The locations of the fyke nets set in each hydro-reservoir
are shown in Figures 5–8.
8 Assessment of the eel population structure in the Waikato hydro-reservoirs and their tributaries Fisheries New ZealandTable 3: Summary of fyke-net types, numbers, and survey methods used to examine eel populations in
three hydro-reservoirs. Refer to text for description of net type codes.
No. of
Hydro-reservoir No. & type of net Date sampled overnight sets Total no. of nets
Arapuni 8 x CO, 5 x DCO, 10–20 December 2012 8 111
37 x DC, 13 x DF,
15 x SC, 33 x SF
Arapuni 8 x DCO, 8 x DC, 3–7 February 2013 4 75
32 x SC, 27 x SF,
Ātiamuri 6 x CO, 5 x DC, 22–23 February 2012 1 15
2 x DF, 1 x SC, 1 x
SF
Whakamaru 15 x CO, 14 x DC, 19–22 February 2012 3 43
4 x DF, 10 x SF
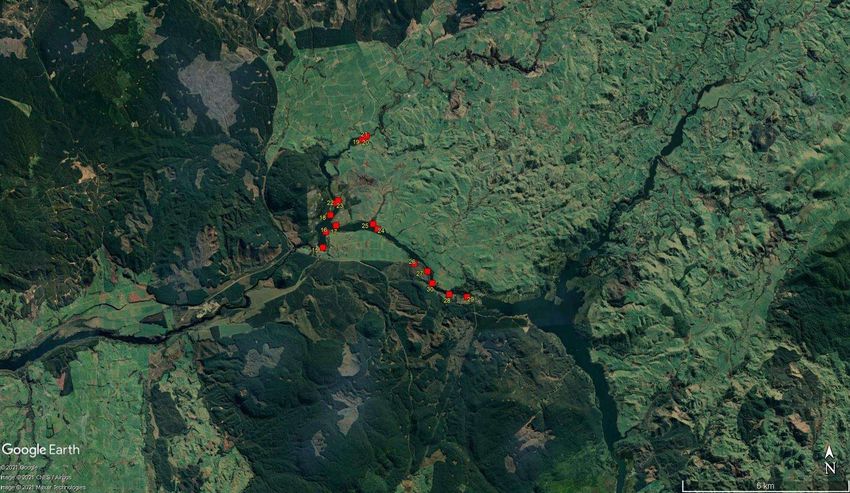
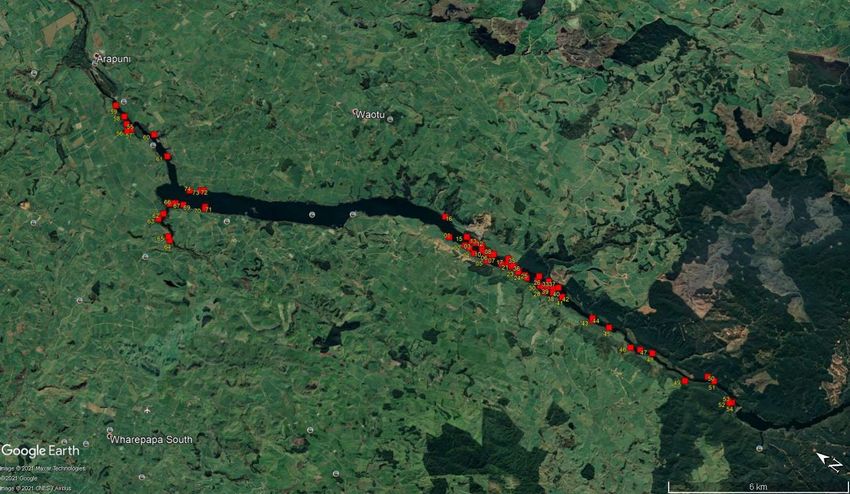
Fisheries New Zealand Assessment of the eel population structure in the Waikato hydro-reservoirs and their tributaries 9Figure 5: Location of the fyke nets set in Lake Arapuni, 10–20 December 2012. (Map Source: Google Earth) 10 Assessment of the eel population structure in the Waikato hydro-reservoirs and their tributaries Fisheries New Zealand
Figure 6: Location of the fyke nets set in Lake Arapuni, 3–7 February 2013. The middle section of the lake was not fished on this occasion because of high public
use of this reach and the associated risk of nets being disturbed and/or causing safety issues. (Map Source: Google Earth)
Fisheries New Zealand Assessment of the eel population structure in the Waikato hydro-reservoirs and their tributaries 11Figure 7: Location of the fyke nets set in Lake Ātiamuri, 22–23 February 2012. (Map Source: Google Earth) 12 Assessment of the eel population structure in the Waikato hydro-reservoirs and their tributaries Fisheries New Zealand
Figure 8: Location of the fyke nets set in Lake Whakamaru, 19–22 February 2012. (Map Source: Google Earth) Fisheries New Zealand Assessment of the eel population structure in the Waikato hydro-reservoirs and their tributaries 13
2.3 Data collection
Catches from individual reaches and fyke nets were processed separately. All the fish caught were
anaesthetised using a fish anaesthetic approved for use in foods (AQUIS®) and identified by species.
All eels were measured (to the nearest 1 mm) and most weighed (to the nearest 5 g). Following
processing, the eels were revived in fresh water and returned to the waterway, except for 133 longfins
and 203 shortfins from the hydro-reservoirs that were euthanised with an overdose of anaesthetic so
their otoliths could be removed for ageing to determine growth rates.
Eel age was determined by counting the number of annual hyaline rings of the otolith across the largest
axis, ignoring the first ring (freshwater check) that surrounds the core which represents the marine larval
growth stage. Otoliths were prepared using the crack and burn method described by Hu & Todd (1981)
and revised by Jellyman et al. (2007). Essentially, this method involves breaking the otolith in half with
a scalpel blade. The otolith halves are then burnt by placing them on a scalpel blade over a Bunsen
flame until they turn brown. Following burning, the otoliths are embedded in clear silastic 732 RTV
with the broken edge pressed against a glass slide. Mounted otoliths are viewed using a compound
microscope, and the annual rings counted. Ages were independently determined by two readers and
then compared for agreement in age estimates. Where differences between readers occurred, the otolith
was re-examined, discussed, and an agreed age was assigned.
The habitat characteristics of each electric-fished reach were recorded according to standard procedures
used in the New Zealand Freshwater Fish Database (NZFFD). Stream width and water depth
measurements were taken in mid-stream at the top and bottom of the reach. Single spot measurements
of conductivity and water temperature were taken at most sites with a hand-held YSI water monitoring
meter.
Lake Karāpiro eel survey (LINZ dataset)
Lake Karāpiro itself was not surveyed in this study. Instead, the datasets generated by the aquatic
macrophytes control programme undertaken by Land Information New Zealand (LINZ, see Matheson
et al. 2010) were used. Between 2007 and 2010 four zones in Lake Karāpiro were netted using three
single-cod coarse-mesh and three fine-mesh fyke nets set overnight, both before and after weed spraying
events. The four zones were: Lower control, Lower treatment, Upper control, and Upper treatment (e.g.,
Figure 9). The dates fished were as follows:
2007a: 9 May for pre-spraying and 27 June for post-spraying.
2007b: 29 August for pre-spraying and 25 October for post-spraying.
2008: May for pre-spraying and 13 June for post-spraying.
2009: 5 May for pre-spraying and 30 June for post-spraying.
2010: 7 April for pre-spraying and 27 May for post-spraying.
14 Assessment of the eel population structure in the Waikato hydro-reservoirs and their tributaries Fisheries New ZealandFigure 9: Location of the fyke nets set in Lake Karāpiro for LINZ weed control monitoring surveys between 2007–2010. (Map Source: Google Earth) Fisheries New Zealand Assessment of the eel population structure in the Waikato hydro-reservoirs and their tributaries 15
2.4 Data analysis To establish the distribution and the population structure of eels in the tributaries, and compare these with records obtained in the reservoirs, the following attributes were examined: Species distribution, size distribution, and relative abundance in term of number and biomass. For the purpose of the present eel catch analysis, catches from the sprayed zones were omitted. Length-weight relationships Length versus weight plots were used to identify outliers. These were point-checked against field records and excluded where the source of the error could not be resolved. Once groomed for errors, data were transformed (natural log, ln) and the length-weight relationship was derived for each eel species using the least squares linear regression method. Where actual weights were not measured in the field, the length-weight relationships were used to calculate individual eel weights to derive catch biomass estimates. Relative abundance Catch per unit effort (CPUE) is an index of abundance that is commonly used to examine and compare the status of eel fisheries (Jellyman & Graynoth 2005). Two CPUE indices were derived: one for electric fishing data (from the tributaries) and one for fyke net data. Electric fishing data were expressed as number and weight of eels per 100 m2 of stream, and fyke net data were expressed as the number and weight of eels captured per fyke net per night for each species caught. Where several reaches within one tributary were fished, CPUE was derived by combining all records for that stream. For fyke nets, CPUE was derived for each net type, and also for the combination of all the nets. All double-cod sets (DC, DF, and DCO) were treated as one net for CPUE calculations because one of the nets always captured more fish than the other. Size distribution Eel size distribution is influenced by the mesh size of the fyke nets used, while with electric fishing, habitat type and the ability to see and retrieve the fish will influence the size of fish caught. Habitat dictated what type of nets could be deployed, but as far as possible the aim was to standardise effort. For reporting size distribution of the fish captured, all the catch was amalgamated and the numbers of shortfins and longfins in 50-mm size classes were plotted. Length-at-age Eel growth was calculated from length-at-age data obtained from the otoliths that were extracted during the study. As described by Beentjes & Chisnall (1998), freshwater growth rates for eels were then calculated for each fish as mean annual length (millimetres) increase per year (i.e., total length at capture minus length at entry into fresh water divided by the estimated age of fish). For longfins, an arrival length of 63 mm was used and 60 mm for shortfins (Jellyman 1977). These calculations assumed that growth rate was not dependent on age given that growth rates have been shown to be linear in shortfin and longfin eels (Jellyman 1997). 3. RESULTS 3.1 Species distribution and total catch Tributaries Both fyke netting and electric fishing were used to determine the presence/absence of eels in the Karāpiro, Arapuni, and Whakamaru (electric fishing only) tributaries. Several of the tributaries accessed from the Karāpiro and Arapuni hydro-reservoirs by boat had waterfalls a short distance from the lake shore (Figure 10) and these were expected to restrict the upstream passage of fish, including eels. Generally, instream habitats below such waterfalls were mostly shaded, with gravelly substrates, and easily accessible to elvers from the reservoir (e.g., Makomako Stream, Figure 11). In contrast, upstream 16 Assessment of the eel population structure in the Waikato hydro-reservoirs and their tributaries Fisheries New Zealand
of the waterfalls the tributaries ran through mostly open pasture, had lower gradients, and the substrates
consisted of sand and silt (e.g., Huihuitaha Stream, Figure 12).
Across all methods used (electric fishing and fyke netting), a total of 21 eels (81% longfin) were caught
from five Lake Karāpiro tributaries. In comparison, 89 eels (88% longfin) were caught from eight
tributaries surveyed around Lake Arapuni, and 37 eels (97% longfin) were caught from eleven Lake
Whakamaru tributaries. The highest numbers of eels (mostly elvers) were observed from Makomako
Stream in the Lake Arapuni catchment. Across the 47 reaches fished (12 reaches in Karāpiro; 14 reaches
in Arapuni; 21 reaches in Whakamaru), a total of 55.9 kg of eels were caught, the majority (52%)
coming from Arapuni tributaries. Where both eel species were present in the tributaries, longfins
generally dominated the catch by number and by weight (Table 4). Longfins were also far more widely
distributed than shortfins (Figure 13). Full details of eel catches obtained by electric fishing in the
tributaries are provided in Appendices 1 and 2.
In addition to eels, common bullies (Gobiomorphus cotidianus), brown trout (Salmo trutta), rainbow
trout (Oncorhynchus mykiss) and kōura (Paranephrops planifrons) were observed in the hydro-
reservoir tributaries. Cran’s bullies (G. basalis) may have been present at some sites, but this could not
be confirmed.
Figure 10: The Te Rimu Stream waterfalls taken from Lake Arapuni. (Photo: J. Smith)
Figure 11: The Makomako Stream, where the highest density of longfin eels (mostly elvers) was caught.
This site is only a short distance from the edge of Lake Arapuni. (Photo: J. Smith)
Fisheries New Zealand Assessment of the eel population structure in the Waikato hydro-reservoirs and their tributaries 17Figure 12: Fine-mesh fyke net set in the Huihuitaha Stream. (Photo: B. Bartels) 18 Assessment of the eel population structure in the Waikato hydro-reservoirs and their tributaries Fisheries New Zealand
Table 4: Total catch and species composition of eels caught using electric fishing and fyke netting from tributaries surveyed in the Karāpiro, Arapuni, and Whakamaru
hydro-reservoir catchments between December 2011 and November 2012.
Electric fishing Fyke netting Total eel catch % longfin
Hydro-reservoir Tributary name No. of Total area No. of No. of No. No. of No. of Weight By By
reaches fished (m2) shortfin longfin nets shortfin longfin No. (kg) number weight
Karāpiro Huihuitaha Stream 5 407 3 1 14 1 2 7 9.90 43 65
Mangakara Stream 1 60 0 0 11 0 12 12 30.38 100 100
Raparahi Stream 3 60 0 0 7 0 0 0 0.00 – –
Unnamed tributary K1 1 30 0 0 – – – 0 0.00 – –
Waipā Stream 2 120 0 0 2 0 2 2 10.92 100 100
Waitete Stream – – – – 2 0 4 4 3.34 100 100
All Karāpiro tributaries 12 677 3 1 36 1 20 25 54.54 84 94
Arapuni Makomako Stream 1 90 2 47 – – – 49 1.83 96 99
Mangare Stream 4 258 7 6 2 0 11 24 21.29 71 91
Mangawhio Stream 3 165 0 1 – – – 1 0.01 100 100
Ngautaramoa Stream 3 159 4 2 – – – 6 0.36 67 97
Te Rimu Stream 1 90 0 2 – – – 2 0.12 100 100
Tumai Stream 1 30 0 1 – – – 1 1.11 100 100
Unnamed tributary A1 1 90 0 3 – – – 3 0.85 100 100
All Arapuni tributaries 14 882 13 62 2 0 11 86 25.58 85 93
Whakamaru Mangatutu Stream 1 75 0 1 – – – 1 0.95 100 100
Maraemanuka Stream 2 276 0 9 – – – 9 2.66 100 100
Mokautere Stream 2 285 0 2 – – – 2 2.15 100 100
Okama Stream 3 264 0 2 – – – 2 0.51 100 100
Ongarahu Stream 1 30 0 0 – – – 0 0.00 – –
Opareiti Stream 3 330 0 13 – – – 13 2.24 100 100
Potungutungu Stream 2 95 0 0 – – – 0 0.00 – –
Te Rakau Stream 1 45 0 8 – – – 8 0.04 100 100
Unnamed tributary W1 1 20 0 0 – – – 0 0.00 – –
Waiharuru Stream 1 20 0 0 – – – 0 0.00 – –
Waipāpa Stream 4 560 1 1 – – – 2 0.59 50 98
All Whakamaru tributaries 21 2 000 1 36 0 0 0 37 9.14 97 100
Fisheries New Zealand Assessment of the eel population structure in the Waikato hydro-reservoirs and their tributaries 19Figure 13: Locations of tributary reaches fished where longfins (left) and shortfins (right) were observed during electric fishing only between December 2011 and
November 2012.
20 Assessment of the eel population structure in the Waikato hydro-reservoirs and their tributaries Fisheries New ZealandHydro-reservoirs
In Lake Arapuni, a total of 4446 eels (1394 kg; 29% longfins by number) were caught over 12 nights
with fyke nets. In Lake Whakamaru, 1102 eels (404 kg; 18% longfins by number) were caught over
two nights. In Lake Ātiamuri, 277 eels (149 kg; 36% longfins by number) were caught after one night
fishing. In Lake Karāpiro, a total of 1004 eels (417 kg; 5.7% longfins by number) were caught over ten
sampling occasions between May 2007 and May 2010 (Matheson et al. 2010). In Arapuni, Whakamaru,
and Ātiamuri hydro-reservoirs, shortfins generally dominated the catch by weight and number (Tables
5 and 6). In addition to eels, common bullies, brown trout, catfish (Ameiurus nebulosus), goldfish
(Carassius auratus), and rudd (Scardinius erythrophthalmus) were captured in the reservoirs.
Table 5: Number of shortfins and longfins, total weight and species composition of eels captured in fyke
nets set in the Arapuni, Whakamaru, and Ātiamuri hydro-reservoirs between February 2012
and February 2013.
Hydro- Date No. Number Total eels % Longfins
reservoir of Shortfin Longfin Number Weight (kg) By By
nets number weight
Arapuni Dec 2012 111 2 417 1 053 3 470 1 124 30 27
Feb 2013 75 759 217 976 270 22 27
Whakamaru Feb 2012 43 907 195 1 102 404 18 15
Ātiamuri Feb 2012 15 177 100 277 149 36 50
Table 6: Number of shortfins and longfins, total weight and species composition of eels captured in fyke
nets set in the Karāpiro hydro-reservoir between May 2007 and May 2010. (Data courtesy of
LINZ, see Matheson et al. 2010.)
Hydro- Date No. Number Total eels % Longfins
reservoir of Shortfin Longfin Number Weight (kg) By By
nets number weight
Karāpiro May 2007 24 74 5 79 41.9 6.3 5.6
Jun 2007 12 1 1 2 1.0 50 14.4
Aug 2007 24 55 6 61 34.5 9.8 8.7
Oct 2007 12 51 5 56 31.7 8.9 8.1
May 2008 24 148 13 161 63.0 8.1 5.2
Jun 2008 12 36 2 38 19.3 5.3 13.2
May 2009 24 118 6 124 51.9 4.9 3.1
Jun 2009 12 41 3 44 17.5 6.8 3.3
Apr 2010 24 331 8 339 121.6 2.4 1.9
May 2010 6 100 8 100 34.4 8 7.2
3.2 Catch per unit effort
Tributaries
In tributaries, electric fishing CPUE in terms of numbers varied from 0.00–52.22 longfins per 100 m2
and 0.00–2.52 shortfins per 100 m2. For biomass, the CPUE varied from 0–2.72 kg longfins per 100 m2
and 0–0.73 kg shortfins per 100 m2 (Table 7). CPUE, both in terms of numbers and weight, was
markedly higher for longfins than for shortfins in tributaries of the Arapuni and Whakamaru
catchments, but shortfins dominated electric fishing catches from the Karāpiro catchment.
Fisheries New Zealand Assessment of the eel population structure in the Waikato hydro-reservoirs and their tributaries 21Fyke net catches were extremely variable, but where eels were present, longfins dominated catches
(Tables 8 and 9). Coarse-mesh fykes tended to catch more longfins than fine-mesh ones, but this
difference is most likely due to where each type of net could be set rather than mesh size.
Examining the records from both electric fishing and fyke netting, it appears that habitat type, access
for recruits, and size of eels present affects CPUE the most. The effect of access was particularly evident
in the Waipā Stream where no eels were caught in the upper reaches (the Waipā Stream flow
underground in its lower reaches).
Table 7: Catch per unit effort (CPUE, by number and by weight) for eels caught by electric fishing the
tributaries of Karāpiro, Arapuni, and Whakamaru reservoirs between December 2011 and
November 2012.
Reservoir Tributary name Number per 100 m2 Weight (kg) per 100 m2
Shortfin Longfin Shortfin Longfin
Karāpiro Huihuitaha Stream 0.74 0.25 0.692 0.313
Mangakara Stream 0.00 0.00 0 0
Raparahi Stream 0.00 0.00 0 0
Unnamed tributary K1 0.00 0.00 0 0
Waipā Stream 0.00 0.00 0 0
All Karāpiro tributaries 0.44 0.15 0.416 0.183
Arapuni Makomako Stream 2.22 52.22 0.007 2.030
Mangare Stream 2.71 2.33 0.729 2.722
Mangawhio Stream 0.00 0.61 0 0.008
Ngautaramoa Stream 2.52 1.26 0.007 0.218
Te Rimu Stream 0.00 2.22 0 0.136
Tumai Stream 0.00 3.33 0 3.690
Unnamed tributary A1 0.00 3.33 0 0.944
All Arapuni tributaries 1.47 7.03 0.215 1.280
Whakamaru Mangatutu Stream 0.00 1.33 0 1.267
Maraemanuka Stream 0.00 3.26 0 0.965
Mokautere Stream 0.00 0.70 0 0.754
Okama Stream 0.00 0.76 0 0.192
Ongarahu Stream 0.00 0.00 0 0
Opareiti Stream 0.00 3.94 0 0.679
Potungutungu Stream 0.00 0.00 0 0
Te Rakau Stream 0.00 17.78 0 0.097
Unnamed tributary W1 0.00 0.00 0 0
Waiharuru Stream 0.00 0.00 0 0
Waipāpa Stream 0.18 0.18 2 0.104
All Whakamaru tributaries 0.05 1.80 1 0.457
22 Assessment of the eel population structure in the Waikato hydro-reservoirs and their tributaries Fisheries New ZealandTable 8: Catch per unit effort (CPUE, by number) for eels caught in fyke nets set in Lake Karāpiro and
Arapuni tributaries between December 2011 and February 2012.
CPUE (number/net/night)
Reservoir Tributary No. of netsa Shortfin Longfin All nets
SC SF SC SF SC SF Shortfin Longfin
Karāpiro Huihuitaha – 14 – 0.07 – 0.14 0.07 0.14
Mangakara 6 5 0.00 0.00 1.67 0.40 0.00 1.09
Raparahi – 7 – 0.00 – 0.00 0.00 0.00
Waipā 2 – 0.00 – 1.00 – 0.00 1.00
Waitete 2 – 0.00 – 2.00 – 0.00 2.00
All Karāpiro
tributaries 10 26 0.00 0.04 1.60 0.15 0.03 0.56
Arapuni Mangare 1 1 0.0 0.0 5.0 6.0 0.0 5.5
a
SC = Single coarse-mesh fyke; SF = Single fine-mesh fyke; and –, type of net not deployed.
Table 9: Catch per unit effort (CPUE, by weight) for eels caught in fyke nets set in Lake Karāpiro and
Arapuni tributaries between December 2011 and February 2012.
CPUE (kg/net/night)
Reservoir Tributary No. of netsa Shortfin Longfin All nets
SC SF SC SF SC SF Shortfin Longfin
Karāpiro Huihuitaha – 14 – 0.05 – 0.37 0.05 0.37
Mangakara 6 5 0.00 0.00 4.73 0.40 0.00 2.76
Raparahi – 7 – 0.00 – 0.00 0.00 0.0
Waipā 2 – 0.00 – 5.46 – 0.00 5.46
Waitete 2 – 0.00 – 1.86 – 0.00 1.86
All tributaries 10 26 0.00 0.03 4.30 0.28 0.02 1.40
Arapuni Mangare 1 1 0.00 0.00 4.19 8.20 0.00 6.19
a
SC = Single coarse-mesh fyke; SF = Single fine-mesh fyke; and –, type of net not deployed.
Hydro-reservoirs
The highest CPUEs both in terms of numbers and weight were recorded in Lake Arapuni in December
2012 and Lake Whakamaru in February 2012, respectively (Tables 10 and 11). The lowest CPUE for
number and weight was in Lake Arapuni during February 2013 (for both species). In all reservoirs
fished in 2012 and 2013, generally the highest CPUEs were obtained in the deeper sets where two nets
were attached end to end (i.e., net types DC, DCO, DF). However, there was large variability in catches
across all net types. The higher catches of these double-net arrangements was possibly because they
were treated as a single net in CPUE calculations, but habitat differences are also likely (note for
example that in Ātiamuri the highest CPUE was in the single fine-mesh fyke nets). Longfins tended to
be more numerous in areas with a rocky bottom and near the dam; for example, one net set below
Waipāpa Dam (i.e., in the Arapuni reservoir) in December 2012 caught 115 longfins (32 kg), but only
6 shortfins.
A close examination of Arapuni 2012 catch records showed that the area that could not be fished in
2013 due to high public use of this area, was productive, especially for shortfins (i.e., in 2012 the
average CPUE in the middle reaches of Lake Arapuni was 31.8 shortfins per net and 8.5 longfins per
net, whereas for the rest of the lake it was 18.4 and 9.8 respectively). Therefore, the decline in average
CPUE observed between 2012 and 2013 could be explained by the inability to fish the most productive
Lake Arapuni habitats.
Fisheries New Zealand Assessment of the eel population structure in the Waikato hydro-reservoirs and their tributaries 23Catches in Karāpiro reservoir between 2007 and 2010 (via the LINZ study) tended to be lower than the
records collected in 2012 and 2013 from the next three reservoirs using the same type of nets (cf. Table
12 vs. Tables 10 and 11). Fewer habitats were included in the LINZ surveys compared to this study, but
more importantly the LINZ surveys were completed mostly in autumn and winter when lower
temperatures would have made the eels less active and less prone to capture. Therefore, it is unlikely
that the density of eels in the Karāpiro reservoir is lower than in the next three reservoirs.
The percentage of longfins captured in the Karāpiro reservoir between 2007 and 2010 was also much
lower than in the next three upstream reservoirs in 2012–2013. Again, it is anticipated that this
difference is largely a function of habitat since the LINZ study was limited to a lower and middle reach
of Lake Karāpiro, whereas this study covered the full extent of other reservoirs, including reaches with
rocky substrates favoured by longfins.
Table 10: Catch per unit effort (CPUE, by number) for eels caught using a combination of six fyke net
types set in lakes Arapuni, Whakamaru, and Ātiamuri between February 2012 and February
2013.
Hydro-reservoir Year Species CPUE (number/net/night)a All nets
CO DC DCO DF SC SF combined
Arapuni 2012 Shortfin 12.4 29.5 20.8 25.2 15.9 16.9 21.8
Longfin 4.3 12.4 5.4 10.9 11.3 6.8 9.5
Arapuni 2013 Shortfin – 21.8 7.9 – 9.4 8.2 10.1
Longfin – 1.4 7.1 – 2.6 2.4 2.9
Ātiamuri 2012 Shortfin 6.0 13.4 – 20.5 3.0 30.0 11.8
Longfin 8.2 4.2 – 6.5 14.0 3.0 6.7
Whakamaru 2012 Shortfin 21.6 26.4 – 13.5 – 16.0 21.1
Longfin 3.3 6.5 – 3.0 – 4.2 4.5
a
, Net types used: CO = Commercial eel coarse-mesh fyke; DC = Double coarse-mesh fyke nets set leader to
leader; DCO = Double commercial eel coarse-mesh fyke nets set leader to leader; DF = Double fine-mesh fyke
nets set leader to leader; SC = Single coarse-mesh fyke; and SF = Single fine-mesh fyke.
Table 11: Catch per unit effort (CPUE, by weight) for eels caught using a combination of six types of fyke
nets set in lakes Arapuni, Whakamaru, and Ātiamuri between February 2012 and February
2013.
Hydro-reservoir Year Species CPUE (kg/net/night)a All nets
CO DC DCO DF SC SF combined
Arapuni 2012 Shortfin 6.6 9.5 12.1 7.7 5.5 5.4 7.4
Longfin 1.7 3.3 2.9 2.7 3.4 1.9 2.7
Arapuni 2013 Shortfin – 4.3 4.7 – 2.4 1.8 2.6
Longfin – 0.4 3.2 – 0.7 0.8 1.0
Ātiamuri 2012 Shortfin 3.7 3.8 – 10.1 1.1 11.0 4.9
Longfin 8.3 1.2 – 3.6 10.2 2.1 5.0
Whakamaru 2012 Shortfin 11.9 7.4 – 3.8 – 4.6 8.0
Longfin 1.6 1.7 – 0.7 – 1.1 1.4
a
, Net types used: CO = Commercial eel coarse-mesh fyke; DC = Double coarse-mesh fyke nets set leader to
leader; DCO = Double commercial eel coarse-mesh fyke nets set leader to leader; DF = Double fine-mesh fyke
nets set leader to leader; SC = Single coarse-mesh fyke; and SF = Single fine-mesh fyke.
24 Assessment of the eel population structure in the Waikato hydro-reservoirs and their tributaries Fisheries New ZealandTable 12: Catch per unit effort (CPUE, by number and by weight) for eels caught using two types of fyke
nets set in the Karāpiro reservoir between 2007–2010. (Data courtesy of LINZ, see Matheson et
al. 2010.)
Date No. of Species CPUE (by number and kg/net/night)a
each type No. Wt.(kg) No. Wt. (kg)
of net SC SF SC SF All nets
May 2007 12 Shortfin 1.6 4.6 0.96 2.33 3.1 1.65
Longfin 0.3 0.2 0.1 0.1 0.2 0.10
Jun 2007 6 Shortfin 0.0 0.2 0.00 0.14 0.1 0.07
Longfin 0.2 0.0 0.02 0.00 0.1 0.01
Aug 2007 12 Shortfin 3.3 1.2 1.98 0.64 2.3 1.31
Longfin 0.5 0.0 0.25 0.00 0.3 0.12
Oct 2007 6 Shortfin 4.7 3.8 2.64 2.21 4.25 2.43
Longfin 0.5 0.3 0.21 0.22 0.4 0.21
May 2008 12 Shortfin 6.8 5.5 2.92 2.32 6.2 2.62
Longfin 0.4 0.7 0.11 0.18 0.5 0.15
Jun 2008 6 Shortfin 3.5 2.5 1.86 0.93 3.0 1.39
Longfin 0.2 0.2 0.30 0.12 0.2 0.2
May 2009 12 Shortfin 3.3 6.6 1.45 2.74 4.9 2.09
Longfin 0.0 0.5 0.00 0.13 0.3 0.07
Jun 2009 6 Shortfin 2.8 4.0 1.16 1.66 3.4 1.41
Longfin 0.5 0.0 0.10 0.00 0.3 0.05
Apr 2010 12 Shortfin 12.0 15.6 4.50 5.44 13.7 4.97
Longfin 0.2 0.4 0.1 0.13 0.3 0.10
May 2010 6 Shortfin 5.2 10.2 1.87 3.46 7.7 2.67
Longfin 1.0 0.3 0.27 0.14 0.7 0.20
a
SC = Single coarse-mesh fyke; SF = Single fine-mesh fyke.
3.3 Length-weight relationships
The derived length-weight relationships for eels captured in the reservoirs surveyed between 2011 and
2013 are presented in Appendix 3. The slope of these relationships provides a measure of condition of
the eels captured (i.e., how fat they are for a given length). As expected, the slope of the derived
regressions was greater for longfins than for shortfins, indicating a greater weight for that species at any
given length (i.e., better condition). Very little differences were observed between reservoirs, although
shortfins from Lake Ātiamuri tended to be in better condition than in the other two reservoirs surveyed.
Records obtained in 2007–2010 through the LINZ study gave the derived length-weight relationship
for shortfins in Lake Karāpiro as Ln (weight) = -14.121+3.1579*Ln (length). Shortfins in Karāpiro were
therefore in very similar condition to those captured in the next three reservoirs between 2011 and 2013
(see Appendix 3). In contrast, the derived relationship for longfins in the LINZ study was Ln (weight)
= -16.191+3.5226*Ln (length) indicating that they were in better condition than in the three reservoirs
surveyed between 2011 and 2013.
Fisheries New Zealand Assessment of the eel population structure in the Waikato hydro-reservoirs and their tributaries 253.4 Population structure The length and weight characteristics of all the eels measured (i.e., all net types combined) are presented in Tables 13 and 14. Length distributions are shown in Figures 14 and 15. Although elvers (i.e., less than 150 mm) were present at most of the sites in tributaries where eels were found, juvenile eels (i.e., less than 400 mm) represented less than 5% of the eels captured in the Karāpiro tributaries, but represented 70% and 62% of the catches from the Arapuni and Whakamaru tributaries, respectively. Large longfins are piscivorous. They will feed on elvers and will also displace juveniles (Chisnall & Kalish 1993). The relatively high abundance of eels over 800 mm in the Karāpiro tributaries compared with the Arapuni and Whakamaru streams surveyed may, therefore, at least partially explain the lack of juveniles observed in the Karāpiro tributaries. There was considerable variability in the size distribution of eels between reservoirs and between years. For example, in Lake Arapuni the proportion of juvenile eels (under 400 mm) in the catches was around 27% in 2013 but only 11% in 2012. In lakes Ātiamuri and Whakamaru that proportion was around 9% and 12%, respectively. With the exception of Lake Whakamaru, very few eels over 800 mm were observed across the reservoirs surveyed. These results cannot be attributed solely to differences in the proportion of fine-mesh nets used because, in Lake Arapuni for example, out of 111 nets set in 2012, 41% were fine mesh and in 2013 out of 75 nets, 36% were fine mesh. It was observed, however, that when large eels were present in a net, smaller eels tended to be less numerous. It appears, therefore, that small eels will avoid nets already holding large eels, but this observation needs to be fully tested. Commercial harvest, which currently targets larger eels, would of course also affect population densities and size structures. 26 Assessment of the eel population structure in the Waikato hydro-reservoirs and their tributaries Fisheries New Zealand
Table 13: Length characteristics of all eels (irrespective of capture method) measured from selected Waikato River hydro-reservoir habitats between December
2011 and February 2013. Records obtained from the Karāpiro reservoir between 2007 and 2010 are also shown.
Catchment Habitat Shortfin length (mm) Longfin length (mm)
Number Average ± SD Median Range Number Average ± SD Median Range
Karāpiro Tributaries 4 745 ± 71 715 700–850 17 873 ± 270 940 130–1 200
Reservoira 1111 574 ± 110 577 250–910 77 491 ± 79 475 316–780
Arapuni Tributaries 13 281 ± 208 155 90–650 77 296 ± 236 157 97–880
Reservoir 3176 515 ± 111 514 186–930 1269 471 ± 78 468 218–1 016
Whakamaru Tributaries 1 172 – – 36 348 ± 194 305 110–750
Reservoir 907 574 ± 122 554 212–957 195 482 ± 93 480 300–910
Ātiamuri Reservoir 177 559 ± 122 565 235–920 100 598 ± 161 552 300–1 145
a
, LINZ records 2007 to 2010 (Matheson et al. 2010).
Table 14: Weight characteristics of all eels (irrespective of capture method) measured from selected Waikato River hydro-reservoir habitats between December
2011 and February 2013. Records obtained from the Karāpiro reservoir between 2007 and 2010 are also shown.
Catchment Habitat Shortfin weight (g) Longfin weight (g)
Number Average ± SD Median Range Number Average ± SD Median Range
Karāpiro Tributaries 1 635 – – 15 3 098 ± 1 862 2 900 720–6 772
Reservoira 111 432 ± 260 400 30–1 520 77 320 ± 222 250 50–1 425
Arapuni Tributaries 5 372 ± 256 240 140–660 20 1 138 ± 701 880 140–2 400
Reservoir 3171 322 ± 228 275 10–1 785 1 259 291 ± 218 250 17–3 380
Whakamaru Tributaries 1 11 – – 27 209 ± 231 160 2–880
Reservoir 907 377 ± 252 340 15–1 740 195 317 ± 300 265 50–2 560
Ātiamuri Reservoir 176 415 ± 280 375 40–1 770 100 782 ± 917 453 30–4 830
a
, LINZ records 2007 to 2010 (Matheson et al. 2010).
Fisheries New Zealand Assessment of the eel population structure in the Waikato hydro-reservoirs and their tributaries 27Figure 14: Length distribution of longfins (LFE) and shortfins (SFE) captured in tributaries of lakes
Karāpiro, Arapuni, and Whakamaru between December 2011 and February 2013.
28 Assessment of the eel population structure in the Waikato hydro-reservoirs and their tributaries Fisheries New ZealandYou can also read