An economic and disease transmission model of human papillomavirus and oropharyngeal cancer in Texas
←
→
Page content transcription
If your browser does not render page correctly, please read the page content below
www.nature.com/scientificreports
OPEN An economic and disease
transmission model of human
papillomavirus and oropharyngeal
cancer in Texas
Chengxue Zhong1, Li Xu2, Ho‑Lan Peng3, Samantha Tam4, Li Xu5, Kristina R. Dahlstrom5,
Chi‑Fang Wu3, Shuangshuang Fu6, Wenyaw Chan1, Erich M. Sturgis5,7, Lois M. Ramondetta8,
Libin Rong9, David R. Lairson3 & Hongyu Miao1*
In 2017, 46,157 and 3,127 new oropharyngeal cancer (OPC) cases were reported in the U.S. and
Texas, respectively. About 70% of OPC were attributed to human papillomavirus (HPV). However,
only 51% of U.S. and 43.5% of Texas adolescents have completed the HPV vaccine series. Therefore,
modeling the demographic dynamics and transmission of HPV and OPC progression is needed for
accurate estimation of the economic and epidemiological impacts of HPV vaccine in a geographic
area. An age-structured population dynamic model was developed for the U.S. state of Texas. With
Texas-specific model parameters calibrated, this model described the dynamics of HPV-associated
OPC in Texas. Parameters for the Year 2010 were used as the initial values, and the prediction for Year
2012 was compared with the real age-specific incidence rates in 23 age groups for model validation.
The validated model was applied to predict 100-year age-adjusted incidence rates. The public health
benefits of HPV vaccine uptake were evaluated by computer simulation. Compared with current
vaccination program, increasing vaccine uptake rates by 50% would decrease the cumulative cases
by 4403, within 100 years. The incremental cost-effectiveness ratio of this strategy was $94,518 per
quality-adjusted life year (QALY) gained. Increasing the vaccine uptake rate by 50% can: (i) reduce
the incidence rates of OPC among both males and females; (ii) improve the quality-adjusted life years
for both males and females; (iii) be cost-effective and has the potential to provide tremendous public
health benefits in Texas.
Human papillomavirus (HPV) is etiologically linked with several cancers, including oropharyngeal cancer (OPC).
In 2017, 46,157 and 3,127 new OPC cases were reported in the United States and T exas1. In the United States,
more than 70% of OPC cases are attributable to H PV2. Over the past decades, the incidence of HPV-related OPC
has been increasing and is now higher than that of HPV-related cervical c ancer3. HPV-related OPC incidence
differs by sex in the United States, with overall incidence rates for men being two to four times higher than those
for women4. Since there is currently no validated screening tool for OPC, primary prevention is the most effective
available public health strategy for reducing the burden of HPV-related OPC in the United States.
1
Department of Biostatistics and Data Science, School of Public Health, The University of Texas Health Science
Center at Houston, 1200 Pressler Street, Houston, TX 77030, USA. 2Department of Statistics, School of
Mathematical and Statistics, Guangdong University of Foreign Studies, Xiaoguwei Street, Guangzhou, Guangdong,
China. 3Department of Management, Policy, and Community Health, School of Public Health, The University of
Texas Health Science Center at Houston, 1200 Pressler Street, Houston, TX, USA. 4Department of Otolaryngology,
Henry Ford Health System, 2799 W Grand Blvd, Detroit, MI, USA. 5Department of Head and Neck Surgery,
Division of Surgery, The University of Texas MD Anderson Cancer Center, 1515 Holcombe Blvd, Houston, TX,
USA. 6Department of Epidemiology, Human Genetics and Environmental Sciences, School of Public Health, The
University of Texas Health Science Center at Houston, 1200 Pressler Street, Houston, TX, USA. 7Division of Cancer
Prevention and Population Sciences, Department of Epidemiology, The University of Texas MD Anderson Cancer
Center, 1400 Pressler St, Houston, TX, USA. 8Department of Gynecologic Oncology and Reproductive Medicine,
The University of Texas MD Anderson Cancer Center, 1515 Holcombe Blvd., Houston, TX, USA. 9Department of
Mathematics, University of Florida, 1400 Stadium Rd, Gainesville, FL, USA. *email: Hongyu.Miao@uth.tmc.edu
Scientific Reports | (2021) 11:1802 | https://doi.org/10.1038/s41598-021-81375-5 1
Vol.:(0123456789)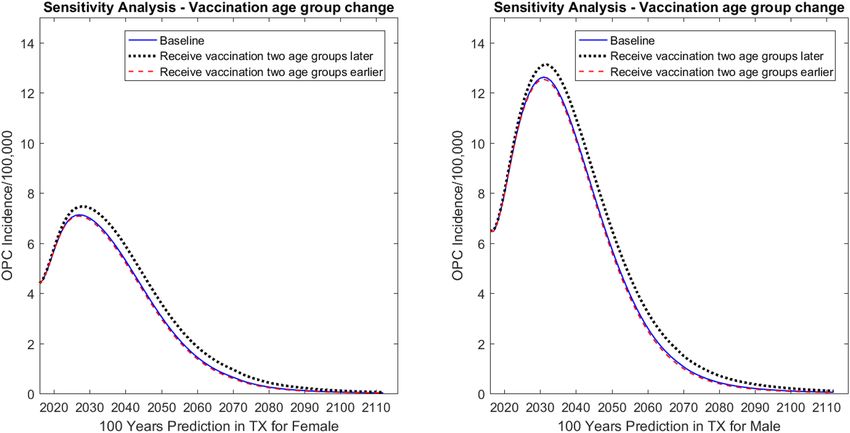
www.nature.com/scientificreports/
Prophylactic vaccination against HPV is associated with a significant decrease in the prevalence of oral
infection by HPV types that can cause OPC among young a dults5, and thus has the potential to protect against
most of the HPV-related OPCs. The HPV vaccine has been shown to be long-lasting; multiple studies have
shown sustained effectiveness and high immunogenicity for at least 10 years after vaccination6–8. Although
HPV-vaccine trials were not designed to evaluate oropharyngeal end-points, data from the Costa Rica vaccine
trial showed 93% (95% CI 63 to 100%) protection against prevalent oral HPV infection, similar to the efficacy
for cervical lesions9–11. The Advisory Committee on Immunization Practices of the U.S. Centers for Disease
Control and Prevention (CDC) currently recommends routine vaccination of boys and girls aged 11 to 12 years
against HPV; vaccination may be started as young as age 9 y ears12. Catch-up vaccination for all individuals up to
age 26 years is also recommended. Vaccination of adults aged 26 years and older is considered of limited public
health benefit; however, vaccination of adults aged 27–45 years who are not adequately vaccinated may benefit
and is recommended through shared clinical decision-making12. HPV vaccination rates remain low in the United
States, with approximately half (54%) of adolescents having completed the vaccine series in 2018 from the most
recent estimate a vailable13. Meanwhile, only 48% of Texas teenagers received a complete series of HPV vaccine,
which is much lower than the vaccine uptake rate in the National Immunization Survey-Teen (NIS-Teen) 2019,
Texas14. To determine the societal benefit of dedicating resources to public health policies, including those related
to immunization, policy makers and stakeholders rely on cost-effectiveness and disease burden studies. Such
studies rely on accurate and up-to-date mathematical models.
In general, modeling HPV-related cancers is a challenging task for a number of reasons, including, for exam-
ple, the need for a sophisticated model structure, with numerous model variables and unknown parameters, and
poor data availability. Particularly for HPV-related OPC, there is little to no previous modeling work on OPC
progression. To our knowledge, this is the first attempt to develop and apply a comprehensive mathematical
model to quantitatively understand HPV-related OPC incidence and its economic consequence in Texas. For this
purpose, an age-structured population model of the natural history of HPV-related OPC was developed for this
study, based on the literature and our current understanding of demographic dynamics, disease progression, and
incidence rate of OPC. Whenever possible, Texas data were utilized to model the disease, to model the behavior
of at-risk individuals, and to validate the model. The mathematical model incorporated HPV infection, progres-
sion, treatment, and other characteristics; strategies for vaccination; and the epidemiologic and economic effects
of HPV vaccination. Also, given the heterogeneities among different age groups, age structures were explicitly
incorporated into the ordinary differential equation models15, 16.
The primary aim of this paper was to develop and apply a model for comparing the OPC-related health
and economic consequences of proposed investments for increasing the HPV vaccination rates in Texas over
100 years. While there are well-developed HPV vaccination economic models for the nation that have been
utilized to inform the recommendations of the CDC17, large diverse states such as Texas require information
relevant to their populations in order to inform state-level decision-makers about the health and economic
consequences of public health disease-prevention investments. This paper provides valuable information for
Texas and an example for other states to consider.
Results
Model validation. The model consisted of a large system of ordinary differential equations (ODEs) similar
to the previous work of Elbasha and P eng18, 19, which provided a solid foundation for depicting the population
dynamics, HPV transmission, and vaccination simultaneously. In this study, the epidemiologic model of HPV-
associated OPC was incorporated and the predicted HPV-associated OPC incidence rates were used for model
validation.
The parameters and initial variables collected from Year 2010 in Texas used to validate the model. The
predicted age-specific incidence rates (per 100,000) compared with the actual data for Years 2011 and 2012 in
Texas, and both the real incidence rates and the predicted incidence rates were calculated (Fig. 1). The two curves
matched each other reasonably well and had similar trends for all age groups, although the match was better for
2012 than for 2011, especially for males older than 45 years (Fig. S4). For males, the predicted result was slightly
larger than the actual data for the Texas population older than 55 years; for females, the difference observed only
for the population older than 60 years.
Prediction. Age-adjusted incidence rates predicted for 100 years and all age groups were included. While
other modelers such as Chesson et al.20 set the starting age group at 12 years, Graham et al.21 listed the vaccine
target age for starting HPV vaccination for females in the U.S. at 11 years. Therefore, age-adjusted incidence rate
was predicted by covering age groups started from 11 years (Supplemental Fig. S5). Because disease transmis-
sion occurs mainly among adults, our age-adjusted incidence rate prediction figure starts at age 20 years (Fig. 2).
The initial parameter values were determined for 2015 and calibrated for prediction of age-adjusted incidence
rates. The parameter values fixed for the 100-year study time horizon. The predicted incidence rate (per 100,000)
increased until Year 2030 and then declined for the remainder of the time span. The predicted male incidence
rates were much higher than for females, which clearly reflects the known differences in OPC between genders.
The predicted incidence rates covered Years 2019 to Year 2115 (the results for years 2016 to 2018 found to be
very sensitive to the initial variable values and thus may be artifacts).
Cumulative cases prevented in Texas are presented in Table 1. Although increasing the vaccination coverage
rate by 50% for females only did not affect males directly, vaccinating females resulted in a notable decrease in
OPC among males. For example, increasing the vaccine uptake rate of females decreased the respective cumula-
tive number of OPC cases for males and females by 1271 and 1297, respectively, within 100 years. If vaccination
uptake rates increased for both females and males, providing both direct and indirect protection, even more cases
Scientific Reports | (2021) 11:1802 | https://doi.org/10.1038/s41598-021-81375-5 2
Vol:.(1234567890)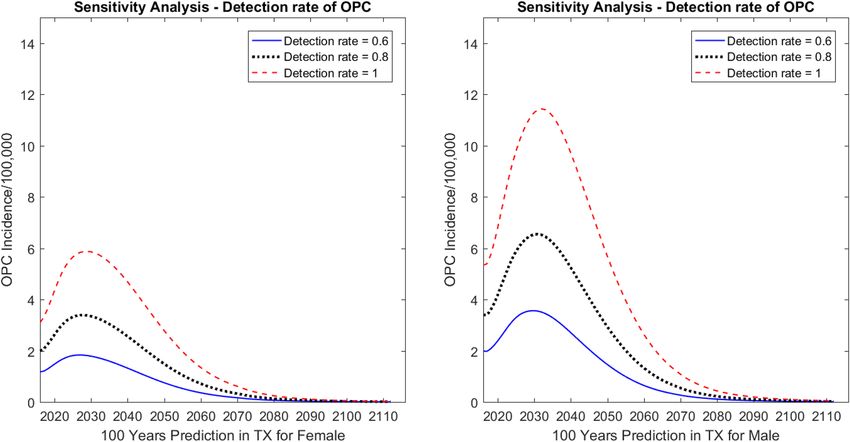
www.nature.com/scientificreports/

                                  Figure 1.  Model validation using real 2012 oropharyngeal cancer (OPC) incidence data for males and females
                                  in Texas (TX). Red points denoted real values and blue points denoted predicted values.

                                  Figure 2.  Prediction by the model of oropharyngeal cancer (OPC) incidence for Texas (TX) for 100 years,
                                  beginning at age 20 years.

Scientific Reports |   (2021) 11:1802 |               https://doi.org/10.1038/s41598-021-81375-5                                                3

                                                                                                                                         Vol.:(0123456789)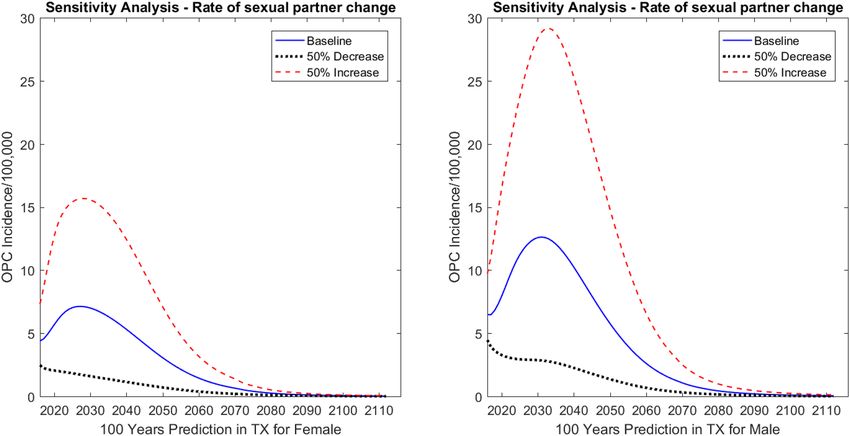
www.nature.com/scientificreports/
Males Females
10 years 20 years 50 years 100 years 10 years 20 years 50 years 100 years
Strategy 1: vaccine uptake rate 50% increase for females only
OPC 88 341 1108 1271 132 464 1129 1297
Strategy 2: vaccine uptake rate 50% increase for females and males
OPC 183 804 3126 3632 202 815 2379 2747
Table 1. Cumulative cases prevented by different strategies. Female and male vaccination includes age 13 to
26 years.
of disease among men were prevented; for example, 2362 cases among men and 1450 cases among women were
prevented after 100 years of vaccination. Additionally, more cases expected prevented with a longer follow-up
time. For instance, compared with 10 years, the number of OPC cases prevented among men and women was
around 25 times and 20 times higher, respectively, over 100 years when vaccination coverage rate was increased
for males and females.
Policy assessment and sensitivity analysis of model parameters. Policy focuses on the health
gains from investments to increase the vaccination uptake rate among the target groups in Texas. We assessed
the impact of different vaccination strategies or scenarios on health and economic consequences, such as HPV-
related OPC incidence rates, years of life, QALYs, and costs. Incremental cost-effectiveness ratios (ICERs) esti-
mated for different vaccination coverage rates, vaccination covered age groups, and whether male vaccination
rates increased in addition to those of females. The effects of rate of sexual partner change and detection rate of
the OPC parameters on health and economic outcomes are unknown or highly uncertain and therefore assessed
with sensitivity analysis.
Vaccination coverage rate. Vaccination adherence is one of the most important factors in determining the level
of disease prevention. In our model, age and gender specific vaccination uptake rates, including uptake rates of
first dose and second dose, were collected from CDC22 and the values were presented in Supplements Text S2
and S3. In addition to predicting the impact of vaccination with first dose of vaccine, we considered the adher-
ence to the second vaccine dose. Results derived for increasing the first and second vaccine uptake rates by mul-
tiplying 1.5 to each value of vaccine uptake rate respectively or simultaneously. As the model predicted results
since 2016, the intervention started in Year 2016.
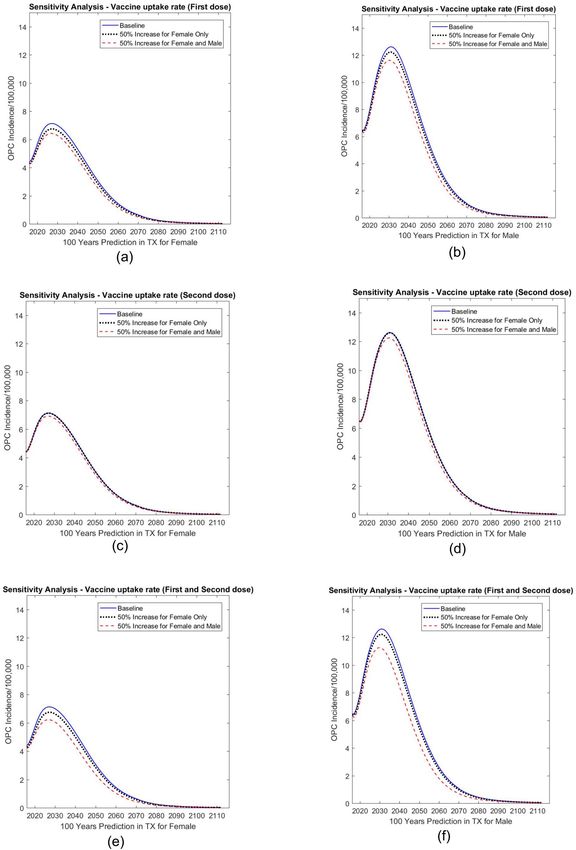
First dose. As shown in Fig. 3a and b, when the first dose vaccine uptake rate increased 50% for females only,
the incidence rate (per 100,000) decreased by 2.79% for males and 5.30% for females by Year 2031 compared
with the baseline predictions. When the first dose vaccine uptake increased by 50% for both males and females,
the incidence rate (per 100,000) decreased by 6.91% for males and 10.04% for females by Year 2031, again com-
pared with the baseline predictions.
Second dose. By changing the proportion of those with uptake receiving two doses, the incidence rate changed
less than the incidence rate changes when we varied the first dose uptake rate (Fig. 3c,d). Compared with the
baseline results, the incidence rate decreased by 0.10% for males and 0.12% for females by Year 2031 when we
increased the vaccination uptake rate of females only; the incidence rates decreased by 2.36% for males and
3.15% for females at Year 2031 if uptake rates of both females and males were increased.
First and second dose. We also performed sensitivity analysis by changing the vaccine uptake rate for the first
and second doses at the same time. As shown in Fig. 3e and f, the incidence rate (per 100,000) decreased by
2.89% for males and 5.44% for females by Year 2031 when we increased the vaccine coverage for females only.
The incidence rate (per 100,000) decreased by 9.31% for males and 13.05% for females by Year 2031 when we
increased the vaccine coverage rate 50% for both males and females.
Vaccination starting age. The starting age of vaccine uptake has a notable effect on incidence rate. We predicted
the incidence rates for three different scenarios: (1) the current vaccination coverage strategy, starting from age
13–14 years for both males and females, (2) assuming that people would receive vaccination two age groups
earlier, that is, age 9–10 years for males and females, and (3) assuming that people would receive vaccination
two age groups later, that is, age 18 years for males and females (Fig. 4). Compared with the baseline results, the
incidence rates (per 100,000) increased by 3.11% for males and 4.98% for females by Year 2031 when the vacci-
nation started two age groups later. When the vaccination started two age groups earlier, the predicted incidence
rates (per 100,000) were almost the same as the baseline results for both males and females over 100 years, with
a decrease of 0.54% and 0.85%, respectively.
Rate of sexual partner change. Sexual behavior is an important contributor to HPV-related OPC incidence
rate18. We increased and decreased the rate of sexual partner change by 50% from baseline; Fig. 5 shows that the
Scientific Reports | (2021) 11:1802 | https://doi.org/10.1038/s41598-021-81375-5 4
Vol:.(1234567890)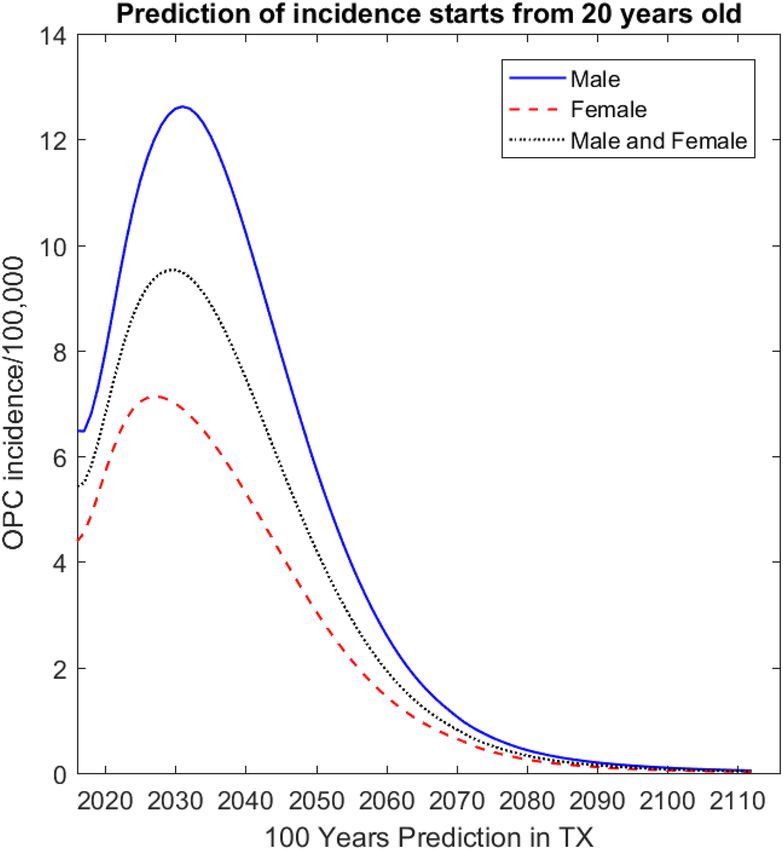
www.nature.com/scientificreports/

                                  Figure 3.  Sensitivity analysis: predicted effect of first dose (a, b), second dose (c, d), and first plus second dose
                                  (e, f) vaccine coverage rates on oropharyngeal cancer (OPC) incidence in Texas (TX). The graph on the left
                                  shows predictions for females; the graph on the right shows predictions for males.

Scientific Reports |   (2021) 11:1802 |                 https://doi.org/10.1038/s41598-021-81375-5                                                         5

                                                                                                                                                   Vol.:(0123456789)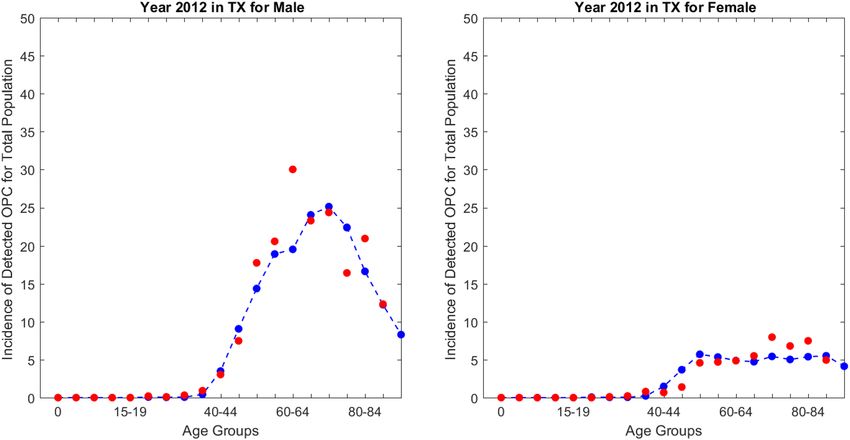
www.nature.com/scientificreports/

                                            Figure 4.  Sensitivity analysis: predicted effect of vaccination covered age groups on oropharyngeal cancer
                                            (OPC) incidence in Texas (TX). The graph on the left shows predictions for females; the graph on the right
                                            shows predictions for males.

                                            Figure 5.  Sensitivity analysis: predicted effect of rate of sexual partner change on oropharyngeal cancer (OPC)
                                            incidence in Texas (TX). The graph on the left shows predictions for females; the graph on the right shows
                                            predictions for males.

                                            rate of sexual partner change had the expected effects on the incidence rates. When the rate of sexual partner
                                            change decreased by 50%, in Year 2031 the incidence dropped by 4.53 cases (per 100,000) for males and 2.48
                                            cases (per 100,000) for females compared with the baseline results. When the rate of sexual partner change
                                            increased by 50%, the incidence increased by 7.12 cases (per 100,000) for males and 3.93 cases (per 100,000) for
                                            females in Texas at Year 2031 compared with the baseline results.

          Scientific Reports |   (2021) 11:1802 |               https://doi.org/10.1038/s41598-021-81375-5                                                     6

Vol:.(1234567890)
www.nature.com/scientificreports/
Figure 6. Sensitivity analysis: predicted effect of detection rate on oropharyngeal cancer (OPC) incidence in
Texas (TX). The graph on the left shows predictions for females; the graph on the right shows predictions for
males.
50% Increase males and Percentage change: strategy 1 Percentage change: strategy 2
Time span Cost Baseline 50% Increase females females vs. baseline (%) vs. baseline (%)
Vaccine cost $1,215,970,837 $1,228,036,081 $1,299,696,369 0.99 6.89
10 years Promotion cost $0 $1,610,203,300 $3,288,240,276
Treatment cost* $790,679,741 $772,723,638 $760,056,563 − 2.27 − 3.87
Vaccine cost $1,979,363,530 $1,996,366,114 $2,086,066,593 0.86 5.39
20 years Promotion cost $0 $3,012,153,182 $6,110,436,523
Treatment cost* $1,752,402,352 $1,697,131,568 $1,643,925,198 − 3.15 − 6.19
Vaccine cost $3,244,954,345 $3,270,506,029 $3,392,724,426 0.79 4.55
50 years Promotion cost $0 $5,445,831,584 $10,903,328,729
Treatment cost* $2,890,132,667 $2,779,265,735 $2,633,107,535 − 3.84 − 8.89
Vaccine cost $3,916,784,811 $3,946,784,282 $4,086,414,163 0.77 4.33
100 years Promotion cost $0 $6,751,642,838 $13,455,242,628
Treatment cost* $2,949,072,752 $2,832,929,791 $2,677,776,292 − 3.94 − 9.20
Table 2. Short-term to long-term costs under different scenarios. (1) Discount rate is 0.03; (2) Costs reported
in 2018 USD; (3) Female and male vaccination includes age 13 to 26 years.
Detection rate of OPC. Because of the unavailability of detection rates for OPC, we performed sensitivity analy-
ses to assess the impact of detection rates on the disease incidence predictions. Figure 6 shows that when the
detection rate was set at 0.8, the incidence rates increased by 2.32 cases (per 100,000) for males and 1.30 cases
(per 100,000) for females in Year 2031 compared with the detection rate of 0.6. When the detection rate was set
at 1, the incidence rates increased by 5.94 cases (per 100,000) for males and 3.36 cases (per 100,000) for females
in Year 2031 compared with the detection rate of 0.6.
Economics. Incremental cost‑effectiveness ratio. Table 1 shows the cumulative cases of OPC that prevented
by HPV vaccine in the Texas population over time. The effects of increasing vaccine uptake rate were remarkable
over time, with larger impact on males. Compared to the current vaccine policy, increasing the rate for female
only saved 88 and 132 OPC cases in a 10-year time span for male and female, respectively. Within a 100-year
time span, the prevented OPC cases were 1271 and 1297 for male and female, respectively. Increasing vaccine
uptake rate for both females and males saved 183 and 202 OPC cases in 10 years for male and female, respec-
tively, and 3632 and 2747 cases in 100 years.
Scientific Reports | (2021) 11:1802 | https://doi.org/10.1038/s41598-021-81375-5 7
Vol.:(0123456789)www.nature.com/scientificreports/
Coverage strategy Total cost* Lost-QALYs Incremental cost Lost-QALYs difference $/QALY
Base case vaccine cost: $178.14; intervention cost: $50.64 for the first dose; $20.26 for the second dose
Baseline $6,865,857,562 1,281,115
50% increase over current rate for females $13,531,356,911 1,228,503 $6,665,499,349 52,612 $126,689.20
50% increase over current rate for males
$20,219,433,083 1,157,743 $6,688,076,172 70,760 $94,517.75
and females
Best case vaccine cost: $142.512; intervention cost: $20.26 for the first dose; $20.26 for the second dose
Baseline $6,082,500,600 1,281,115
50% increase females $9,856,665,333 1,228,503 $3,774,164,732 52,612 $71,734.45
50% increase males and females $13,657,816,653 1,157,743 $3,801,151,321 70,760 $53,718.93
Worst case vaccine cost: $217.11; intervention cost: $87.92 for the first dose; $20.26 for the second dose
Baseline $7,722,695,466 1,281,115
50% increase females $17,933,089,043 1,228,503 $10,210,393,577 52,612 $194,065.98
50% increase males and females $28,157,746,183 1,157,743 $10,224,657,141 70,760 $144,497.70
Table 3. Incremental cost per quality-adjusted life year (QALY) gained by vaccination for vaccine uptake
rate 50% increase scenario. (1) Discount rate is 0.03; (2) Costs reported in 2018 USD; (3) Planning horizon is
100 years; (4) Female and male vaccination includes age 13 to 26 years. *Note that "Total cost" denotes the sum
of vaccination cost, promotion cost and treatment cost.
Parameter varied in sensitivity analysis in addition to varying vaccine
uptake rate 50% increase females 50% increase males and females
Base case (vaccine cost = $178.14) $126,689.20 $94,517.75
Lower vaccination cost per dose (vaccine cost = $142.51) $71,734.45 $53,718.93
Higher vaccination cost per dose (vaccine cost = $217.11) $194,065.98 $144,497.70
Assuming no discount (vaccine cost = $178.14) $182,489.66 $124,332.14
Assuming no discount (vaccine cost = $142.51) $103,726.46 $70,802.06
Assuming no discount (vaccine cost = $217.11) $279,060.27 $189,923.46
Assuming no promotion cost (vaccine cost = $178.14) − $1637.32 − $219.39
Assuming no promotion cost (vaccine cost = $142.51) − $1751.36 − $614.05
Assuming no promotion cost (vaccine cost = $217.11) − $1512.58 $212.29
Table 4. Sensitivity analysis: estimated cost per quality-adjusted life years ($ per QALY) gained when other
model parameters are varied. (1) Discount rate is 0.03; (2) Costs reported in 2018 USD; (3) Planning horizon is
100 years; (4) Female and male vaccination includes age 13 to 26 years.
Table 2 shows the short-term to long-term vaccine costs, promotion costs, and treatment costs. There was no
tremendous increase for vaccine costs (0.99% in 10 years and 0.77% in 100 years) if uptake rate was increased
50% for females only. However, the extra costs were notable if the uptake rate increased 50% for both males and
females, with a 6.89% increase in 10 years and a 4.33% increase in 100 years. The promotion costs were the major
part of vaccination cost when we increased vaccine uptake rate: $1.6 billion in 10 years for increasing female
only rate and $3.3 billion for increasing both gender rates. However, with the increase of vaccine uptake rate,
the treatment costs would decline by 2.27% for the female only increase strategy and 3.87% for the both gender
increase strategy in 10 years; the treatment cost would decrease by 3.94% and 9.20% in 100 years.
Table 3 provides results for the cost-effectiveness analysis, which compared three vaccination coverage levels
and three vaccination costs. The criteria for a strategy being cost-effective followed the convention of $100,000
per QALY g ained23. For each vaccination scenario, the strategies ordered from least resource intensive (i.e.,
current vaccine uptake rate) in the top row to the most resource intensive (i.e., increase vaccination uptake rate
50% for males and females) in the bottom row. We varied combinations of vaccine acquisition cost and vaccine
promotion uptake costs in a sensitivity analysis of the ICERs. Base-case vaccination cost values were derived
from CDC data ($178.14 for the vaccine; $50.64 and $20.26 for promoting uptake of the first and second dose,
respectively)24. The best-case cost assumptions ($142.51 for vaccine; $20.26 for extra first dose and second dose
costs) and the worst-case cost assumptions ($217.11 per dose for vaccine; $87.92 and $20.26 for promoting
first dose and second dose) were c alculated25. The base-case results showed that changing from a strategy of a
50% increase over current vaccination levels among females only to a strategy of a 50% increase among females
and males (Age-specific base vaccine uptake rates were presented in presented in Supplements Text S2 and S3)
reduced the ICER from $126,689.20/QALY to $94,517.75/QALY. The variation of vaccine costs also had an
important impact on the ICERs. For example, the ICERs increased to $194,065.98/QALY (baseline vs. strategy
1) and $144,497.70/QALY (strategy 1 vs. strategy 2) when the vaccination cost was $217.11 and dropped to
$71,734.45/QALY and $53,718.93/QALY when the vaccination cost was $142.51.
Scientific Reports | (2021) 11:1802 | https://doi.org/10.1038/s41598-021-81375-5 8
Vol:.(1234567890)www.nature.com/scientificreports/
To assess the impact of uncertainty of some model parameters on the ICERs, other scenarios were considered,
such as no discounting of costs and QALYs or no promotion costs for the expansion of vaccine uptake (Table 4).
In almost all scenarios, a strategy of increasing vaccine uptake by 50% for females only was dominated by the
strategy of increasing both female and male vaccine uptake by 50%, except in the setting with no promotion
cost and vaccination cost of $217.11. The strategy of adding male vaccination uptake rate was cost-effective in
most of scenarios, especially for the setting of no discounting and no promotion cost. Finally, we also computed
long-term ICER results for Years of Life Saved and the short-term to long-term costs, QALYs, and ICERs (See
Supplemental Tables S3, S4). Table S4 showed that the increase of vaccination uptake rate became cost-effective
after 50 years with the threshold of $100,000 per QALY and strategy of adding female and male dominated
strategy of increasing female only after 50 years.
Cost‑effectiveness acceptability curve. The uncertainty in the results of the cost-effectiveness analysis were sum-
marized in CEACs, which are provided in Supplemental Figs. S6 and S7. The curves indicated the percent of
simulations for which the strategy was cost-effective for a determined monetary value that the policy-maker
would be willing to pay for a QALY saved. For instance, the CEAC for changing the vaccination coverage rate
showed that increasing uptake rate for females only was cost-effective in all simulations if the willingness to pay
was higher than $135,000 per QALY. And all simulations were cost-effective when the uptake rate was extended
to include males at this monetary threshold. With willingness to pay reached $100,000 per QALY, the strategy of
increasing female and male vaccine uptake rates was cost-effective in all the simulations.
Relative to the commonly reported threshold of $100,000 to $150,000 per QALY s aved23, the results suggest
that substantially increasing vaccination against HPV was very cost-effective, especially when the vaccination
uptake rate was increased among males and females. The efficiency of increasing vaccination of males was driven
by their relatively high and increasing OPC incidence rates.
Discussion
In this study, we built an age-structured HPV infection model to estimate the impact of HPV vaccination on
OPC progression in Texas. We obtained model parameter values from the literature or calibrated them with data
from Year 2010 and Year 2015 in Texas. The age-specific incidence rates predicted by the model validated against
OPC incidence for Years 2011 and 2012 in Texas, and they matched the real data well. The model then applied to
predict the age-adjusted incidence rate for Texas until 2115. Multiple sensitivity analyses conducted on several
of the parameters, including vaccine uptake rate, coverage age and sexual activity parameters, to determine the
impact of HPV vaccination and sexual behavior on disease progression.
Our work quantified the trend of OPC incidence rates for Texas. The model showed an expected incremental
increase on predicted incidence rate for the first 20 years and then a decline for the rest of prediction period
(80 years). While estimated tends in OPC incidence rates and the cost-effectiveness of increasing vaccination
rates for boys and girls were similar to previous estimates of U.S. trends, there were some differences in the Texas
results. A Canadian study21 examined the cost-effectiveness of immunization of 12-year-old boys with a Markov
model that did not account for herd immunity. With vaccine efficacy at 99 percent and 70 percent uptake, 0.05
QALYs and $145 estimated saved per person in the target population, or $28 mil over the lifetime of the cohort
of 192,940 individuals. Vaccination of boys continued to be cost saving when efficacy and uptake were assumed
to be 50 percent, but total savings declined to $8 mil. in Canada.
This study has some limitations. First, the study focused on only one of several diseases related to HPV
infection. We focused on OPC because its incidence is increasing and it has overtaken cervical cancer as the
leading health problem likely to decrease due to HPV immunization. Researchers have demonstrated the value
of preventing other cancers, genital warts, and recurrent respiratory papillomatosis with HPV vaccination26, 27.
Addition of these diagnoses to the current work would make the increased investment in vaccination even
more cost-effective and possibly cost saving, as shown in the work by investigators at the CDC17. Second, we
did not attempt model fitting because of poor data availability and the lack of efficient regression techniques for
large-scale ordinary differential equation models. Therefore, the parameter values obtained from the literature
or were calibrated based on the actual data and assumptions. A better match would be possible if model fitting
becomes feasible in the future. Third, the vaccination uptake rate held constant during the 100-year prediction
period, which may not reflect the real evolution of vaccine policy and vaccination behavior. Fourth, because of
the lack of population data, the validation was limited to only data for 2011 and 2012 in Texas. With more data
in the future, we will improve model validation. For example, the predicted age-specific incidence rate is a little
higher than the actual incidence rate in people aged 60 to 79 years, and the difference becomes smaller in people
aged 80 years and older. Fifth, there is no dependable literature on the rates of detection of OPC. In one s tudy28,
the detection rate for oral cancer was 86%. We estimated that the detection rates for local and regional stages
of OPC were lower than 86% and assumed the detection rate for distant stage OPC as 1. Therefore, detection
rates were assumed 0.68, 0.85, and 1 for local, regional, and distant OPC. Finally, the predicted incidence rate
declined briefly in the beginning of the prediction period; this drop may have resulted from the initial conditions.
Conclusion
The paper adds to the literature on health/economic policy analysis of HPV immunization by adapting a com-
prehensive population disease model for a state-level assessment of the long-term health and economic conse-
quences of increasing adherence to HPV immunization guidelines. We incorporated up-to-date treatment and
vaccine cost estimates for OPC based on Texas health insurance claims, published reports, up-to-date disease
and sexual behavior data and cost estimates for promoting vaccine uptake among males and females to achieve
a 50% increase in the HPV vaccination rates. Thus, this work provides information that may be actionable at
Scientific Reports | (2021) 11:1802 | https://doi.org/10.1038/s41598-021-81375-5 9
Vol.:(0123456789)www.nature.com/scientificreports/
Variable Unit Reference Description
X Persons Susceptible
44, 45
V1 Persons Vaccinated with 1 dose
44, 45
V2 Persons Vaccinated with 2 doses
VS Persons Vaccinated with waned immunity
Y Persons Infected persons
U Persons Persistently infected
ZS Persons Recovered without seroconversion
42, 43
Z Persons Recovered with seroconversion
WS Persons Infected, vaccinated with waned immunity
41
W1 Persons Infected, vaccinated with 1 dose
41
W2 Persons Infected, vaccinated with 2 doses
41
PS Persons Persistently infected, vaccinated
41
P1 Persons Persistently infected, vaccinated with 1 dose
41
P2 Persons Persistently infected, vaccinated with 2 doses
QS Persons Recovered, vaccinated without seroconversion
42, 43
Q Persons Recovered, vaccinated with seroconversion
Hx Persons Population with tonsillectomy
Hy Persons Population with tonsillectomy that are infected
42, 43 Population with tonsillectomy that were infected, recovered,
Hz Persons
seroconverted
Population with tonsillectomy that were infected, recovered, not
Hzs Persons
seroconverted
44, 45
Hv1 Persons Vaccinated with 1 dose, with tonsillectomy
44, 45
Hv2 Persons Vaccinated with 2 doses, with tonsillectomy
Hvs Persons Waned immunity, with tonsillectomy
41
Hw Persons Infected, vaccinated, with tonsillectomy
Hqs Persons Recovered, vaccinated without seroconversion, with tonsillectomy
42, 43
Hq Persons Recovered, vaccinated with seroconversion, with tonsillectomy
N Persons Total number of persons
DOPCl Cases/100,000 Detected local oropharyngeal cancer
DOPCr Cases/100,000 Detected regional oropharyngeal cancer
DOPCd Cases/100,000 Detected distant oropharyngeal cancer
SOPC Proportion Oropharyngeal cancer survivors
Table 5. Summary of variables.
the state level of government to decide resource allocation regarding the prevention of HPV-related conditions
compared to other state investment opportunities in health. Finally, this work may provide a template for similar
studies in other states that contemplate HPV-related public health investments.
Method
Age‑structured model. Previous modeling work by Elbasha et al.18, 29 provided a solid foundation for
a comprehensive mathematical model to depict population growth, HPV transmission, and vaccination. This
modeling framework included a demographic model, epidemiological model, and the natural history of OPC
for different sex and age groups. Model parameter notations, definitions, and the source of parameters presented
in Table 5; and Table 6 contains initial variables’ notations, definitions, and the sources of initial values. Our
complete model equations provided in Supplementary Text S1; additionally, model structure diagrams given in
Supplementary Figs. S1–S3. While the basic structure of our model follows the published model18, 29, the natural
history of OPC was modeled and incorporated, and the entire framework was updated and adapted to the Texas
population for making specific predictions for Texas. In the demographic model, people transfer from their
current age group to the next age group, except for the oldest age group (≥ 85 years), at age- and gender-specific
rates. For instance, the calibrated transfer rate for Texas suggested that about 12.4% of females from the second
age group (age 1–8 years) move to the third age group (age 9–10 years) each year, compared to 13.4% of males.
The population size for every age group depended on the probability of transferring to the next age group and
the probability of transferring from the younger group, and on the OPC-related and non-OPC-related death
rates. The population growth for the first age group (0–1 years) calculated based on the birth rate because there
is no younger age group, and there was no transfer out for the oldest age group.
In the epidemiological model, HPV transmission specified by gender, age, and sexual activity. The important
subpopulations related to HPV transmission included the susceptible population, infected population, persis-
tently infected population, vaccinated population, infectious vaccinated population, persistently infected vac-
cinated population, and recovered vaccinated population. Additionally, since the three-dose HPV vaccination
Scientific Reports | (2021) 11:1802 | https://doi.org/10.1038/s41598-021-81375-5 10
Vol:.(1234567890)www.nature.com/scientificreports/
Parameters Unit Reference Description
B Persons New borne
46
Δ Per 100 population Rate of tonsillectomy
λ Case per year Force of infection
sc Partners per year Rate of sexual partner change
ǫ1 ǫ2 ǫ3 % Degree of assortative mixing between age and sexual activity groups
pcl, pai Partners per year Relative partner acquisition rate
Partners per year Mean partner acquisition rate
−
cj
47
χ Proportion Rate of local oropharyngeal cancer-associated death (L:1, R:2, D:3)
48
d Change in group per year Transfer rate
q Annual population change Annual growth rate
49
µ Cases per person Death rate
pL % detection Detection rate of local oropharyngeal cancer
pR % detection Detection rate of regional oropharyngeal cancer
pD % detection Detection rate of distant oropharyngeal cancer
σz % Rate of waning immunity following recovery with seroconversion
σzs % Rate of waning immunity following recovery without seroconversion
ϒ % 50
Rate of recovery from HPV infection
50
prf % Proportion of infections that are destined to be persistent
39, 41
θsz % Reactivation rate following sero-conversion
30–32
θszs % Reactivation rate, who did not sero-convert
42, 43
ι % Probability of sero-conversion following HPV clearance
ψz % Degree of protection following sero-conversion
ψzs % Degree of protection following no sero-conversion
ψp1 % protection Degree of protection following sero-conversion, vaccinated with 1 dose
ψp2 % protection Degree of protection following sero-conversion, vaccinated with 2 dose
φ % Proportion of new born vaccinated
44, 45
φc persons Vaccine uptake rate with first dose
Φ1 % Proportion receiving only 1 dose
Φ2 % Proportion receiving only 2 dose
51
ψv1 % Degree of protection with 1 dose
ψv2 % Degree of protection with 2 doses
σv1 % Rate of waning immunity following 1 dose vaccination
σv2 % Rate of waning immunity following 2 dose vaccination
σq % Rate of waning immunity following recovery with seroconversion
σqs % Rate of waning immunity following recovery without seroconversion
52
α % Relative rate of recovery from breakthrough infection
θtL Per year Rate of progression from HPV infection to local OPC
θtR Per year Rate of progression from local OPC to regional OPC
θtD Per year Rate of progression from regional OPC to distance OPC
θp1 Per year Rate of progression from breakthrough infection to DOPC (with 1 dose)
θp2 Per year Rate of progression from breakthrough infection to DOPC (with 2 doses)
θps Per year Rate of progression to DOPC in patients that are persistently infected and vaccinated
Rate of progression from HPV infection (persistent) to DOPC in patients with tonsillectomy that are
θhy Per year
infected
Rate of progression from HPV infection (persistent) to DOPC in patients with tonsillectomy that are
θhw Per year
infected vaccinated
Ω Cases per year Cure rate of local oropharyngeal cancer(L:1, R:2, D:3)
θtw1 Per year Rate of progression to DOPC in patients that are vaccinated with 1 dose, then are infected
θtw2 Per year Rate of progression to DOPC in patients that are vaccinated with 2 doses, then are infected
θtws Per year Rate of progression to DOPC in patients that are infected, vaccinated and have waning immunity
Degree of protection following recovery of an infection in previously vaccinated individuals with serocon-
ψq % protection
version
Degree of protection following recovery of an infection in previously vaccinated individuals without
ψqs % protection
seroconversion
θsq % Reactivation rate in patients who are recovered, vaccinated and seroconverted
θsqs % Reactivation rate in patients who are recovered, vaccinated and no seroconversion
19, 24, 31
ξ % Discount rate
T Year Planning horizon quality %
Continued
Scientific Reports | (2021) 11:1802 | https://doi.org/10.1038/s41598-021-81375-5 11
Vol.:(0123456789)www.nature.com/scientificreports/
Parameters Unit Reference Description
quality % Quality of life weights for a normal individual
qopc % Quality of life weights for an individual in OPC
θprev Per patient over lifetime (USD) Cost of treating for all detected opc patients(prevalence)
θinc Per patient in first year of diagnosis (USD) Cost of treating for new detected opc patients(incidence)
vaccine Cost of each dose of vaccine (USD) Cost of the vaccine
Table 6. Initial variables: definitions and sources of initial values (HPV, human papillomavirus; OPC,
oropharyngeal cancer; DOPC, detected OPC; L, local; R, regional; D, distant; USD, U.S. dollars).
strategy has been changed into a two-dose strategy recently, the force of HPV infection (λ) was redefined by19,
which was determined by the number of sexual partners, relative infectivity of vaccine breakthrough cases, and
probability of people being in different groups.
In the OPC natural history model, the OPC stage contained detected local, regional, and distant cases and
survived cases. We updated parameters of published models to reflect current information on HPV transmission
and OPC progression. For OPC progression, equations now reflect the epidemiologic variations among different
stages of detected OPC. The population of individuals with detected local OPC determined by progression rate,
detection rate, and various subpopulations, as given below:
DOPCll,1,c
′
[t] = pL ∗ θtL ∗ Yl,1,c (t) + pL ∗ θp1 ∗ P1l,1,c (t) + θp2 ∗ P2l,1,c (t) + θps ∗ PSl,1,c (t)
+ pL ∗ θtw1 ∗ W1l,1,c (t) + θtw2 ∗ W2l,1,c (t) + θtws ∗ WSl,1,c (t)
+ pL ∗ θ ∗ Ul,1,c + pL ∗ θhw ∗ Hwl,1,c + pL ∗ θhy ∗ Hyl,1,c
− µ1,c + d1,c + χ1,1 + �L + θtR ∗ DOPCll,1,c [t]
DOPCll,i,c
′
[t] = di−1,c ∗ DOPCll,i−1,c [t] + pL ∗ θtL ∗ Yl,i,c (t)
+ pL ∗ θp1 ∗ P1l,i,c (t) + θp2 ∗ P2l,i,c (t) + θps ∗ PSl,i,c (t)
+ pL ∗ θtw1 ∗ W1l,i,c (t) + θtw2 ∗ W2l,i,c (t) + θtws ∗ WSl,i,c (t)
+ pL ∗ θ ∗ Ul,i,c + pL ∗ θhw ∗ Hwl,i,c + pL ∗ θhy ∗ Hyl,i,c
− µi,c + di,c + χ1,i + �L + θtR ∗ DOPCll,i,c [t]
where l denotes sexual activity group, c denotes gender, and i denotes age group. Parameter pL denotes the detec-
tion rate of local OPC and pR and pD denote the detection the rates of regional and distant cancers, respectively.
We multiplied all subpopulations by their detection rates to predict the prevalence of detected OPC. Here, d was
the population transfer rate and i = 1, 2, 3, . . . , 23. As no younger group exists when i = 1 (age group 0–1 years),
there is a small difference between the two equations. When i was greater than 1, the individuals with detected
local OPC were from the detected local OPC cases in the first age group, HPV-infected individuals, persistently
infected vaccinated individuals, infected vaccinated individuals with waned immunity, persistently infected
individuals, infected vaccinated individuals who had undergone tonsillectomy, and infected vaccinated indi-
viduals who had not undergone tonsillectomy. We subtracted the population that died of any cause except OPC,
the population that transferred to the next age group, the population that died of OPC, the population cured of
OPC, and the population with detected local OPC that developed regional OPC; θtR represented the progression
rate from local to regional status.
Equations given below model how the disease develops from local to regional:
DOPCrl,1,c
′
[t] = pR × θtL × Yl,1,c (t) + pR × θtR × DOPCll,1,c
+ pR × θp1 × P1l,1,c (t) + θp2 × P2l,1,c (t) + θps × PSl,1,c (t)
+ pR × θtw1 × W1l,1,c (t) + θtw2 × W2l,1,c (t) + θtws × WSl,1,c (t)
+ pR × θ × Ul,1,c + pR × θhw × Hwl,1,c + pR × θhy × Hyl,1,c
− µ1,c + d1,c + χ2,1 + �R + θtD × DOPCrl,1,c [t]
DOPCrl,i,c
′
[t] = di−1,c × DOPCrl,i−1,c [t] + pR × θtR × DOPCll,i,c + pL × θtL × Yl,i,c (t)
+ pR × θp1 × P1l,i,c (t) + θp2 × P2l,i,c (t) + θps × PSl,i,c (t)
+ pR × θtw1 × W1l,i,c (t) + θtw2 × W2l,i,c (t) + θtws × WSl,i,c (t)
+ pR × θ × Ul,i,c + pR × θhw × Hwl,i,c + pR × θhy × Hyl,i,c
− µi,c + di,c + χ2,i + �R + θtD × DOPCrl,i,c [t]
For the detected regional disease, when the disease progressed from regional to distant, we used the follow-
ing equations:
Scientific Reports | (2021) 11:1802 | https://doi.org/10.1038/s41598-021-81375-5 12
Vol:.(1234567890)www.nature.com/scientificreports/
DOPCdl,1,c
′
[t] = pD × θtL × Yl,1,c (t) + pD × θtD × DOPCrl,1,c
+ pD × θp1 × P1l,1,c (t) + θp2 × P2l,1,c (t) + θps × PSl,1,c (t)
+ pD × θtw1 × W1l,1,c (t) + θtw2 × W2l,1,c (t) + θtws × WSl,1,c (t)
+ pD × θ × Ul,1,c + pD × θhw × Hwl,1,c + pD × θhy × Hyl,1,c
− µ1,c + d1,c + χ3,1 + �D × DOPCdl,1,c [t]
DOPCdl,i,c
′
[t] = di−1,c × DOPCdl,i−1,c [t] + pD × θtD × DOPCrl,i,c + pD × θtL × Yl,i,c (t)
+ pD × θp1 × P1l,i,c (t) + θp2 × P2l,i,c (t) + θps × PSl,i,c (t)
+ pD × θtw1 × W1l,i,c (t) + θtw2 × W2l,i,c (t) + θtws × WSl,i,c (t)
+ pD × θ × Ul,i,c + pD × θhw × Hwl,i,c + pD × θhy × Hyl,i,c
− µi,c + di,c + χ3,i + �D ∗ DOPCdl,i,c [t]
In the equations, θtL, θtR, and θtD represent the progression rates for three stages for an individual with OPC.
Specifically, θtL denotes the progression rate from HPV infection to local OPC, θtR denotes the progression rate
from local to regional OPC, and θtD denotes the progression rate from regional to distant OPC. The median
time of disease progression in all age groups was around 8 m onths30. The progression rates were age-specific,
as the disease usually progresses more quickly in the older groups, and the θtR and θtD were larger than the θtL
since the disease progression accelerates when the disease progresses to regional or distant status compared
with local status.
Economics. Applying the 2010 and 2015 Texas base vaccination rates31–33, the incremental cost-effectiveness
ratios (ICERs) were calculated for 50% increases in the female vaccination rate only and in the female and male
rates (Age-specific base vaccine uptake rates presented in Supplements Text S2 and S3). The 50% increase was an
important and feasible target and was also examined in a Canadian analysis of HPV immunization e xpansion21.
Fifty percent increase in immunization would move Texas close to the 2020 Health People goal for the U.S.34.
ICERs were computed by dividing the net economic costs (vaccine plus vaccination promotion costs minus
cancer treatment cost averted) by life years and quality-adjusted life years (QALY) gained. Sensitivity analyses
altering the vaccination strategies and HPV transmission rates examined the impact of behavior and vaccination
on the incidence of OPC. To estimate the ICERs for the vaccination strategies, we calculated the vaccination cost,
treatment cost, and QALYs based on the following formulas. All costs valued in 2018 U.S. dollars.
Vaccination cost.
Vaccinatea (t) = vaccine × Bl,c × φl,c + �1 × φl,i,c × Yl,i,c + Xl,i,c + Ul,i,c
l i c
+ vaccine × �2 × φl,i,c × Yl,i,c + Xl,i,c + Ul,i,c
l i c
+ costpro_1 × pop1 + costpro_2 × pop_2
Total vaccination costs included the unit cost per vaccination and the number of people vaccinated. Let Bl,c
denote the newborn population; φl,c denote the proportion of newborns vaccinated; φl,i,c represent the vaccine
uptake rate for the first dose; Φ1 and Φ2 represent the proportion of receiving only one dose or two dose vaccine
respectively; and Yl,i,c, Xl,i,c, Ul,i,c, denote the population v accinated18. The cost of the HPV vaccine was $178.14
per dose25. costpro_1 and costpro_2 represent the extra costs for motivating people to obtain the immunization
and complete the second dose, and they were included in the vaccination cost calculation; the estimated costs
for promoting the first and second doses were $50.64 and $20.26, respectively35–37. pop1 and pop2 denote the
corresponding target population for promotion. Sensitivity analysis assessed the ICER estimates over a range of
vaccination costs and efficacies.
Treatment cost.
Treata (t) = costopc × incidence
The per-case cost of OPC treatment was $151,62238. Cost estimated from experience of a retrospective cohort
of 467 Texas patients with OPC. The Truven MarketScan database used to identify commercially insured patients
with OPC newly diagnosed during the period 2011 to 2014. All dollars adjusted to year 2015 values using the
Consumer Price Index from the U.S. Bureau of Labor Statistics. A generalized linear model estimated the total
healthcare cost for OPC patients.
Effectiveness: quality‑adjusted life years. The lost quality-adjusted life years due to OPC calculated using the
following equation:
Scientific Reports | (2021) 11:1802 | https://doi.org/10.1038/s41598-021-81375-5 13
Vol.:(0123456789)www.nature.com/scientificreports/
T
QALYa = [ qc,i × ( 1 − qopcl × SOPCl,i,c + 1 − qopcl × DOPCll,i,c
0 l i c
−ξ t
+ 1 − qopcr × DOPCrl,i,c + 1 − qopcd × DOPCdl,i,c )] × e
where qopcl , qopcr andqopcd denote the quality of life weights for subjects in the health status being categorized
as OPC local, regional, and distant, respectively. The value of quality of life weights listed in Supplements Text S2
and S3 for Year 2010 and 2015 respectively. ξ represents the discount rate; all costs and QALYs were discounted
to current value at an annual discount rate of 3%29. T denotes the time span, a 100-year analytic horizon.
Cost‑effectiveness ratio. To compare vaccination strategies a and a′ , the ICER was calculated as follows:
Costa − Costa′
QALYlost,a − QALYlost,a′
T
Here Costa = 0 (Vaccinatea (t) + Treata (t)), and the corresponding value for vaccination strategy a’
T
was Costa′ = 0 (Vaccinatea′ (t) + Treata′ (t)). Commonly, the lost quality-adjusted life years of the base-
line strategy was larger than the strategy of increasing female vaccination or increasing vaccination for both
genders, and the cost of the baseline strategy was smaller than the other improvement strategies. In practice,
QALYlost,,a′ − QALYlost,a applied instead of QALYlost,a − QALYlost,a′.
Probabilistic sensitivity analysis. We computed the cost-effectiveness acceptability curve (CEAC) by perform-
ing probabilistic sensitivity analysis. Parameters for vaccine uptake rate and quality of life for patients with OPC
were included in probabilistic sensitivity analyses. For quality of life, beta distribution was applied to generate
1000 random samples as inputs (α = 68.3, β = 27.24). For vaccine uptake rate, the Latin Hypercube sampling
technique based on multivariate normal distribution conducted to generate random samples as input values.
Because of the computational complexity, only 100 random samples for each parameter were generated as inputs
in the simulation.
Model initial variables, parameters, and calibration. All of the values of variables, parameters were
listed in Supplementary Text S2 (Year 2010) and S3 (Year 2015). For parameters that were not available in the
literature, we calibrated from reasonable data or knowledge of HPV infection and the epidemiology of OPC.
Seroconversion following oral HPV infection appears to be rare among both males and females39–43. The HPV
vaccines function primarily by inducing durable systemic virus-neutralizing antibody responses, thereby pre-
venting infection and possibly guarding against reinfection and disease13, 21. Therefore, we assumed the corre-
sponding parameters (ls, θtw1, θtw2, θtws, θtp1, θtp2, θtps) to be 0.
Implementation and computation. The model structure was implemented in MATLAB (MathWorks,
Natick, MA) and the ode15s solver was applied to obtain numeric solutions. Both the relative and the absolute
error tolerances were set as 1.0 × 10⁻⁷ in the ordinary differential equation solver; we also set maximum step size
as 1.0 × 10⁻² and restricted the total number of persons (variable N) as non-negative.
Simulations were performed for the Texas population. The entire population was stratified into 23 age groups,
two gender groups, and three sexual activity groups. The variable values of initial conditions were from Year
2010 in Texas and we calculated the age-specific incidence rates (per 100,000) and age-adjusted incidence rates
(per 100,000) for validation, prediction and sensitivity analyses.
To check the validity of the model, we compared the predicted age-specific incidence rates (per 100,000)
with the real OPC incidence rates (per 100,000) from the Surveillance, Epidemiology, and End Results Program
(SEER) database for Texas and the Texas Cancer Registry database. Because of limitations on data availability,
comparisons conducted for Texas in 2011 and 2012 only. One-way sensitivity analyses implemented by changing
the value of some parameters according to pre-specified ranges.
Data availability
All the data used in this study are from public sources.
Received: 6 July 2020; Accepted: 6 January 2021
References
1. U.S. Cancer Statistics Working Group. U.S. Cancer Statistics Data Visualizations Tool, based on 2019 submission data (1999–2017):
U.S. Department of Health and Human Services, Centers for Disease Control and Prevention and National Cancer Institute.
2. Senkomago, V. et al. Human papillomavirus-attributable cancers: United States, 2012–2016. MMWR Morb. Mortal. Wkly Rep. 68,
724–728 (2019).
3. Van Dyne, E. A. et al. Trends in human papillomavirus-associated cancers: United States, 1999–2015. MMWR Morb. Mortal. Wkly
Rep. https://doi.org/10.15585/mmwr.mm6733a2 (2018).
4. Brown, L. M., Check, D. P. & Devesa, S. S. Oral cavity and pharynx cancer incidence trends by subsite in the United States: Chang-
ing gender patterns. J. Oncol. 1, 23 (2012).
5. Chaturvedi, A. K. et al. Effect of prophylactic human papillomavirus (HPV) vaccination on oral HPV infections among young
adults in the United States. J. Clin. Oncol. https://doi.org/10.1200/JCO.2017.75.0141 (2018).
6. Schwarz, T. F. et al. A ten-year study of immunogenicity and safety of the AS04-HPV-16/18 vaccine in adolescent girls aged 10–14
years. Hum. Vaccines Immunother. 15, 1970–1979 (2019).
Scientific Reports | (2021) 11:1802 | https://doi.org/10.1038/s41598-021-81375-5 14
Vol:.(1234567890)You can also read