All The Stars We Cannot See: A deep look into real-time satellite traffic - ScienceOpen
←
→
Page content transcription
If your browser does not render page correctly, please read the page content below
http://dx.doi.org/10.14236/ewic/EVA2021.36

            All The Stars We Cannot See:
        A deep look into real-time satellite traffic

                                  Megan L. Smith                                    Yujie Gao
                          University of British Columbia                 University of British Columbia
                       Faculty of Creative & Critical Studies         Faculty of Creative & Critical Studies
                                     Canada                                          Canada
                              Megan.Smith@ubc.ca                               Yujie.Gao@ubc.ca

        All the Stars We Cannot See (2020–2022) by Megan Smith & Yujie Gao, is an interactive
        immersive installation which geographically places the user in locations around the
        world so that they can look up into a virtual sky and see in real-time which satellites are
        flying overhead. With the satellite identification application, N2YO, tracking more than
        23,000 satellite objects combined with the rapid increase of SpaceX launches, the artists
        are working to render visible an experience which will allow people to see the impact of
        the satellites in the sky, and to understand the presence of technology surveillance
        globally. This project is in development with UBC Visualisation Emergent Media Studio,
        with a proposed public launch on their state-of-the-art multi-screen immersive system in
        Spring 2021. The project will be adapted for a sensory enhanced VR exhibition and for an
        Augmented Reality application.

        Satellite data. Installation art. Virtual reality. Creative visualisations. Computational arts. Physical computing.

1. INTRODUCTION                                                        visualisation, present other art works working on
                                                                       analogous topics, and touch on the work within the
This paper presents ‘All the Stars We Cannot See’,                     parameters of global space politics.
a new interactive art installation developed by
Megan Smith and Yujie Gao. The practice-based                          Technically, this paper will introduce satellite
research project began in 2020 with an                                 systems of orbit with the purpose to relay satellite
investigation of satellite traffic orbiting Earth and it               flight patterns, density and presence in the space
has developed into an immersive visualisation built                    surrounding Earth. Considering that these satellites
in TouchDesigner, which pulls live data from the                       are constantly orbiting on a designated path, flying
N2YO.com satellite tracking server. The project                        invisibly in the sky, serving many purposes,
tackles several big topics, first to deliver an                        collecting and transferring data across networks,
immersed experience for the audience – where the                       there is a colossal amount of data to be mined into
physical presence of space traffic is rendered                         a visualisation that demonstrates the power of this
visual beyond the scope of a research paper,                           veiled space. Blending this data with an augmented
second to expose the extent of space traffic                           and immersive experience will build a story with an
circumventing the globe, and third to enable people                    ethical responsibility to reveal invisible critical
to have an informed opinion about the increased                        issues and make what is invisible more tangible.
presence of space objects through sharing the
accessible art work in exhibitions, web apps,
journals and across social media.                                      2. TECHNOLOGICAL CONTEXT FOR MAKING

A further goal, which ties with Dr. Smith’s ongoing                    Over the last decade digital media, virtual and
research is to continue to articulate the value of                     augmented reality tools such as the VIVE and the
accessible tools as art-making devices, to question                    Oculus (VR) headsets, gaming computers, tablets,
technologies and industry processes, and to tell                       iPads, Chromebooks etc., and DIY – MAKER
stories about popular culture (Smith & Desnoyers-                      toolkits, open-source software, combined with
Stewart 2019), in this case – making the somewhat                      physical computing hardware have become more
invisible presence of satellite traffic visible. This                  affordable and accessible (Smith, Desnoyers-
paper will detail the process of building the                          Stewart & Kratzig 2019). This has affected the path

© Smith et al. Published by                                     214
BCS Learning and Development Ltd.
Proceedings of EVA London 2021, UK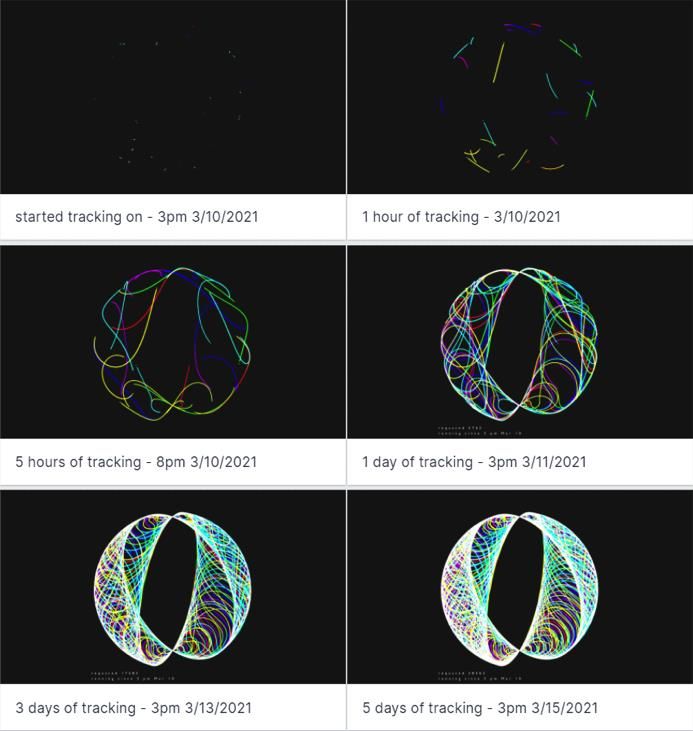
All The Stars We Cannot See: A deep look into real-time satellite traffic
                                             Megan L. Smith & Yujie Gao

of creative practice. With an ever-expanding                      within. They can identify the satellites by their
presence of video uploaded to YouTube daily,                      NORAD ID or other factors such as year of launch,
Instagram and Snapchat extension into society and                 country of launch or size of the object. These
an activated culture of dancing TikTok influencers                identifiers enable the artists to set constraints
affecting the flow of consumerism and often seen                  within their visualisation tool to ultimately tell
as a source for education, it is not surprising to see            stories. For instance, all satellites launched within
more art projects built on these platforms,                       the 1980s could be assigned the colour red, the
permeating devices, and using the IoT structures to               1990’s blue, etc.
build new art, new tools, and new stories. Amidst
this frenzy of produce and consume, Smith and                     Locating the satellites as they orbit the Earth
Gao pose the question – is this information fever                 occurs through applying the mathematical
distracting us from larger global stories, and what is            calculation of three-dimensional space called the
one story that ties the fervour to a global                       Polar Coordinate System where the position of a
experience? They settled on: “How many satellites                 point is specified by three numbers: the radial
are out there, anyway?”                                           distance of that point from a fixed origin, its polar
                                                                  angle, and the azimuth angle (N2YO). By
Working with their research question they                         combining the polar coordinate system with the
discovered a number of accessible databases                       desired constraints, the artists are able to plot
tracking Real-Time satellites that are regularly                  various     satellites  into  a    two-dimensional
updated to keep up with new launches. NY2O and                    visualisation.
Heavens Above databases became useful tools for
understanding the presence of satellite traffic. Of
note: the authors/artists are not space scientists.
The work they have developed is made through
pulling readily available data into visualisations that
can be understood in both qualitative and
quantitative ways.

Their visual discovery, academically presented
here for the first time, demonstrates a powerful
message about the area surrounding the planet. As
society is engrossed by media, the artists believe
that through the visualisation of quantitative data in
more accessible, dynamic, and interactive formats
opportunities for learning present themselves. In a
sense, their goal is to make this data accessible
and to share it across multiple visual platforms as a
method to articulate quantitative research to new
audiences, and in doing so to build work that is as
visually seductive as the popular content crossing
social media networks in order to capture
imaginations with science and art.
                                                                             Figure 1: Polar coordinate system.
2.1 Orbital mechanics in the project
                                                                  To track the satellites over time, the artists pull the
Satellites are space-based objects that move in an                satellite footprint – latitude, and longitude that are
orbit. This research specifically visualises human-               formatted in decimal degrees every 15-30
made satellites that are orbiting Earth. These                    seconds, depending on the output they are trying
satellites follow engineered paths that are locked                to achieve, in real-time from N2YO into their
into orbit through Earth’s gravitational pull. The                program. This process builds up a series of data
North American Aerospace Defense Command                          points that they plot on a digital globe which over
(NORAD) generates an identification number for                    time trace the routes of their objects. By refreshing
each known human-made space object launched                       the visualisation, the routes of the satellites are
into orbit. There are currently over 43,235 objects               visible. The pinpoints move slowly and dedicated
assigned identification, of which 22,453 are actively             observation is required to see the change over
being tracked (N2YO 03/2021). Many items that                     time. The artists have also written into the program
are no longer tracked are considered lost in space                a trail that connects the data points. While this
or defunct.                                                       process may appear to be tracking the objects as
                                                                  they circumvent the globe it is in fact drawing a
Of the 43,235 orbiting objects the artists were able              very fine and time controlled connect-the-dots path
to drill down into the data to distinguish categories             between the object locations.

                                                           215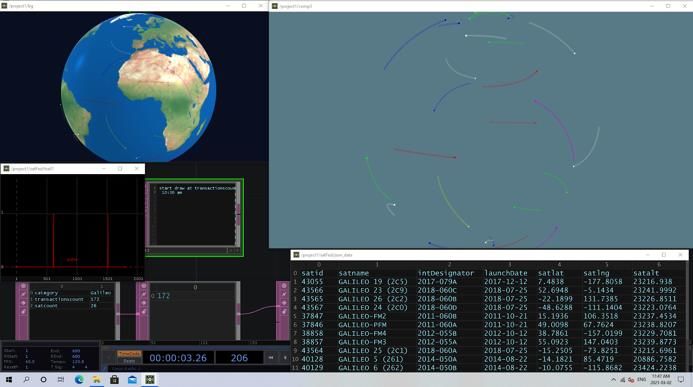
All The Stars We Cannot See: A deep look into real-time satellite traffic
Megan L. Smith & Yujie Gao
2.2 TouchDesigner in the ‘All the Stars’ tool Working specifically with the Galileo set of satellites
the artists have pulled real-time data with the
Working with TouchDesigner, an accessible ‘node- Satellite ID, name, International Designator, launch
based visual programming language for real-time date, latitude, longitude, and altitude. This gives the
interactive multimedia content, developed by artists significant data to begin the process of
Derivative’ (TouchDesigner 2021) the artists built a visualising in TouchDesigner.
toolkit which enables them to look specifically at
satellite traffic through various parameters. They Table 1: Example of Galileo satellites’ raw data parsing
can transform real-time numerical data to imagery to table.
and pictorial composition, by constraining datasets
to parse position, colour, time of appearance, or
duration of tracking arrays.
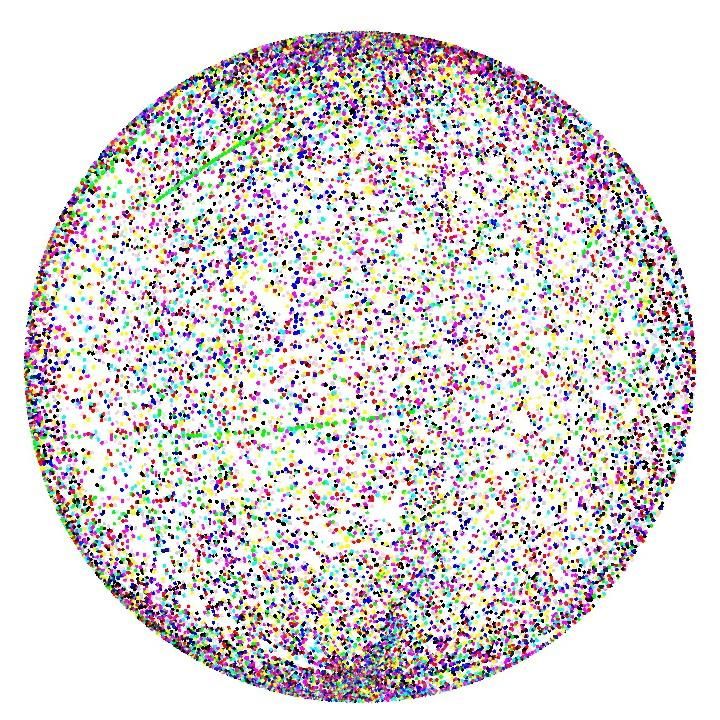
The working process of designing this artwork
within the TouchDesigner framework looks in part
like the screen captures in Figure 2. In this
situation, the Galileo satellites are being accessed
in real-time to trace their orbital path every 30
seconds for a duration of 7 days. A trail was
enabled to connect the points to build a
Figure 2: Data flow in TouchDesigner, numeric data
timestamped drawing of the orbital paths. Figure 4.
transformation to image data.
Details the path of these satellites orbiting Earth
Using the N2YO live database the artists pull over multiple days.
satellites via a REST API into various categories.
The diagram below details how the raw JSON data
is parsed through their visualisation process.
Categorisation based on position, and launch dates
are used to visualise the Galileo satellites in the
example. The colours identify the years of launch.
Figure 3: Data parsing and visualisation graph for
TouchDesigner system. Figure 4: Visualisation of 26 Galileo satellites’ footprint in
1min (top left), 1hr (top right), 5 hrs (middle left), 1day
(middle right), 3days(bottom left), 5 days (bottom right.)
color represents a different year of launch.
216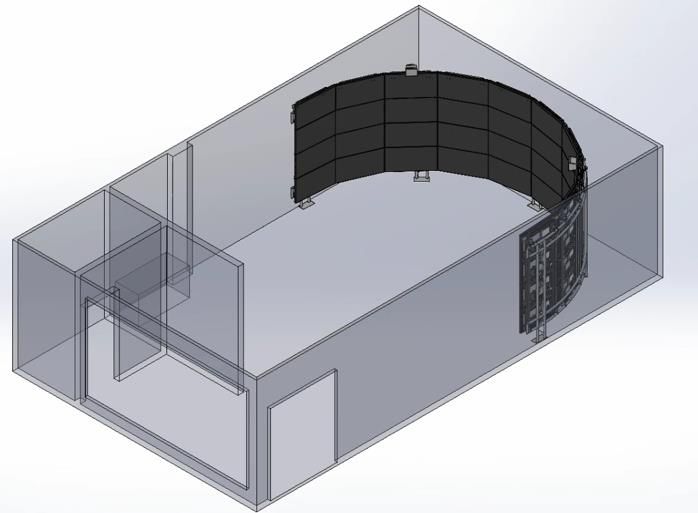
All The Stars We Cannot See: A deep look into real-time satellite traffic
                                            Megan L. Smith & Yujie Gao

                                  Figure 5: Visualisation of 21569 running satellites.

In the above digital image, a visualisation of 21,569            which significantly affects the visualisation of
satellites is made in the TouchDesigner system.                  satellites that year compared to adjacent years.
These were all the active satellites at the time of
pulling the data (March 2021). The image is                      By visualising the satellites, the artists have
rendered without adding trails to the objects as the             become aware of the significant number of defunct
resulting image would not be able to be understood               or lost objects which Alice Gorman, Space
due to layered trails. Of note, are the green dots in            Archeologist, Senior Member of the American
this diagram which identify the SpaceX Starlink                  Institute of Aeronautics & Astronautics, and Senior
networks which appear as significantly different                 Lecturer at Flinders University, Adelaide would
patterns to other satellite categories. As Starlink              most likely identify as ‘space junk’. The NORAD
(2021) has launched 550 satellites since January                 data suggests that 43,235 known objects have
24, 2021 the artists foresee a rapid shift in this               been launched into space, if Figure 5 illustrates the
visualisation when compared to annual global rates               active objects in March 2021, a similar figure could
of deployment between 1957 and 2020. For                         be drawn to illustrate the objects that have been
instance, in 1957, three satellites were launched; in            lost, though they cannot be actively tracked. This
1980, 641 satellites were launched, in 1990, 696                 second illustration would be comparable in density
launched; in 2000, 730 launched; in 2010, 404                    with today’s NORAD numbers, at approximately
launched; in 2020, 1,399 launched. Also of interest              half the total objects launched into space are now
is May 1999, as China launched 3,563 satellites,                 lost or defunct. As a method to illustrate the defunct

                                                          217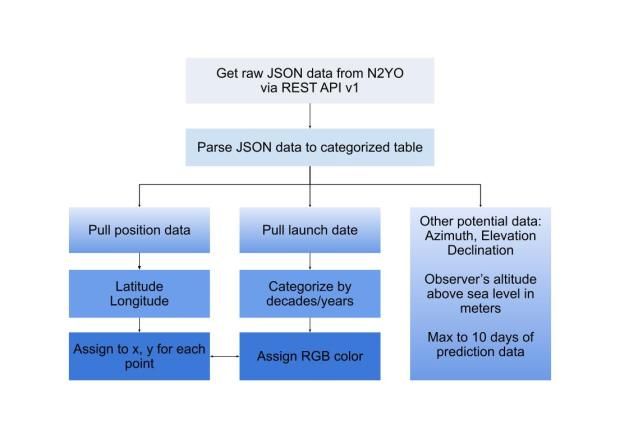
All The Stars We Cannot See: A deep look into real-time satellite traffic
                                            Megan L. Smith & Yujie Gao

and lost objects the artists could use the year that             between land and water, it’s cloud and ice cover, in
the satellites ceased to function and their last                 a similar way ‘All the Stars We Cannot See’ opens
known position. While some companies are                         the eyes and psyche to the density of satellites
working to design their orbiting objects to                      orbiting Earth. The work also opens up the
deteriorate over time, or to plummet to earth where              mysteries of satellite density, and orbital paths of
they can be disposed of or recycled (Huang et al.                various satellites by rendering visualisations of
2020), the artists can only speculate at the amount              these paths. Coming back to the discussion of
of space debris that has resulted from the                       accessible tools, the work draws on established
thousands of professional and amateur launches of                software and spreadsheets of information to
objects into space.                                              compile the quantitative data into a project that can
                                                                 be understood through qualitative means, by
                                                                 setting the eye or the gaze on the visualised data.
3. SPACE AND ART
                                                                 3.2 Experiencing satellite transmission
3.1 Ways of seeing space
                                                                 Artists working with satellite transmission have
‘The Blue Marble’ image produced in 1972 by                      been doing so since the 1960’s with perhaps ‘Our
astronauts of Apollo 17, and the subsequent                      World’, produced in 1967 by the BBC, and
satellite images created by NASA over the last five              managed in Canada by Marshall McLuhan
decades have been functional visualisation tools                 broadcasting at Expo 67, being one of the leading
used to captivate the attention and imaginations of              moments in curated content across this medium.
several generations of people. John Berger’s ‘Ways               The rules of the initiative, which synched
of Seeing’ essays, also produced in 1972, were                   communication across 14 countries, and 5
important tools in articulating the value of                     continents, included a real-time broadcast. The
perspective and how art of its time helps to reveal              Beatles wrote and performed ‘All You Need is Love’
and document cultural nuances and political                      for this event. Over 10,000 technicians were
change at the time of creation. Taking possibly                  employed to work on the project that utilised 3
Berger’s most discussed topic of the gaze into                   different satellites to transmit the program. (CBC
context when reflecting on the impact of looking                 Archives, 2021) While the complexity of the
into space, or looking back from space – these                   undertaking may have overstated the combination
actions are generally associated with heightened                 of projects presented, this did open up exposure of
experiences of sense of space and self-awareness;                the medium to artists. Kit Galloway and Sherrie
where the gaze imbues a topical focus, and                       Rabinowitz developed ‘Hole in Space’ in 1980, a
generates a concept of knowing, which can be                     live-feed happening between New York City and
interpreted as understanding. However, when                      Los Angeles. Nam June Paik developed ‘Good
looking into the sky only renders clouds and blue                Morning, Mr. Orwell’ satellite-based artwork in
sky, or a starry night with some occasional satellite            1984, and fast forward to 2016 and Dan Goods has
movement, it can be difficult for humans to grasp                developed ‘Orbit’ a sculptural installation which
the full spectrum of space traffic as the naked eye              acoustically transmits real-time satellite sound. ‘All
only detects a small fraction of the dynamic                     the Stars’ We Cannot See’ draws on these works to
situation. In this sense, the gaze falls short without           situate its importance in relaying space traffic to the
human intervention to increase scope. This shortfall             world. Like most satellite artwork, it also relies on
of the human eye leads to reliance on information                military research as inspiration for making.
from other sources which can ultimately mean that                Somewhat like Rebecca Allen applied the military’s
information about space is produced by those                     Movie Map technique of photographing space in all
organisations and people who have access to                      directions approximately every ten feet, usually
satellite data, can read it, or manage satellite                 done from the rooftop of a car. She worked this
images stores and curate their content. In essence,              technique into the ‘Aspen Movie Map’ (1978) which
institutions like NASA, who broadcast their visual               garnered the attention of the public and sparked
data and satellite imagery curate the space content              their imaginations. These acts ultimately led to the
that is shared. ‘All the Stars We Cannot See’                    technique being applied by Google in the making of
arrives on the art scene with these established                  their Google Street View and their Maps archive.
tools     as     its  guiding    posts,    and      an
established human understanding of the basics of
                                                                 Among the various outputs planned for ‘All the
perspective of Earth from Space. Nevertheless, this
                                                                 Stars We Cannot See’ the artists are working to
work does not break any communication ground in
                                                                 make the installation feel immersive and larger than
terms of identifying the mysteries of space, but it
                                                                 life through a partnership with the Visualisation
does tap into the otherworldliness that is generated
                                                                 Emergent Media Studio (VEMS) at the University of
with space-based visuals, like ‘The Blue Marble’.
                                                                 British Columbia. The work will be installed on the
Where ‘The Blue Marble’ enables humans to
                                                                 VEMS room scale rounded screen wall at the UBC
identify with the size of Earth, its difference
                                                                 Okanagan campus. As this work will be the first

                                                          218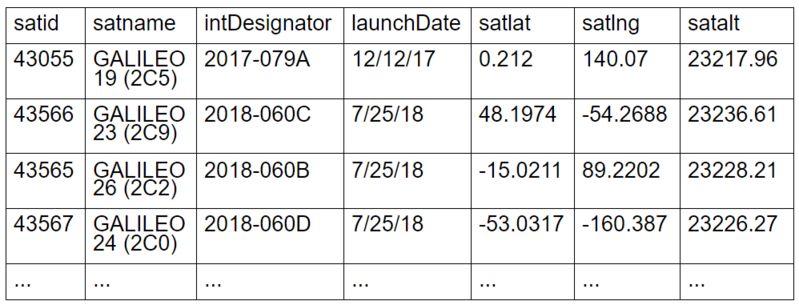
All The Stars We Cannot See: A deep look into real-time satellite traffic
                                             Megan L. Smith & Yujie Gao

major project produced at VEMS and the content is                 time form lines in the sky like no other satellite
being controlled for press release in Spring 2021,                networks. This makes them highly visible as a
no images were ready for print at the time of                     different form within the visualisation. Satellites
writing. A visual articulation of the project involves            classified as Military will be logged, as well as
the relaying of the real-time feed across the                     Amateur Radio. Countries as categories and years
screens. The floor of the studio will be covered in               will also be developed as images. At this early
grass and picnic blankets will be scattered to build              stage of creation, the artists are not limiting
a sense of ‘starry night sky watching’. The                       themselves to too many classification constraints
installation room will be dark and the experience                 as through the process of visualising this data they
when watching the real-time feed will be of                       are working to expose the extent of space traffic
satellites slowly inching across the screen with                  and its complexity circumventing the globe.
locational feed updates coming every 30 seconds
and a stardust trail leaving digital residue to mark
the passage of time. The longer a person spends in                4. CONCLUSION
the artwork the more satellite traffic they will
witness. They will also perhaps begin to decode the               This project through its active steps to visualise
colour details of what they are seeing. The artists               space traffic should help to broaden knowledge of
have not yet settled on their colour coding by year               satellite density in space, and make visible what is
or by country.                                                    essentially a veiled space. In particular, by
                                                                  releasing images like figure 5. publicly the artists
                                                                  anticipate that for some the reaction to this image
                                                                  will be similar to that of seeing ‘The Blue Marble’ for
                                                                  the first time; a mix of shock and wonder. Their aim
                                                                  to circulate the research through multiple
                                                                  interaction spaces ranging from fully immersive
                                                                  room-size visualisation to small animated gifs
                                                                  across TikTok will push the research out into many
                                                                  demographics. The artists further anticipate that the
                                                                  project will stimulate conversation on the pollution
                                                                  of space and on surveillance, and that this project
                                                                  could serve as a visual aid to trigger a reaction on
                                                                  those topics. The artists hope that through their
                                                                  publishing of this research through popular and
                                                                  engaging means they can relay the expanding
                                                                  situation of the occupation of space, made visible
                                                                  now to the naked eye.
          Figure 6: VEMS Installation space.

Design for virtual reality and augmented reality is               5. REFERENCES
also underway and will follow closely behind the
VEMS launch. In the first instance the project will               Berger, J. (1972) Ways of Seeing. Penguin Press,
be ported into Unity and launched for VR by                       United Kingdom.
summer 2021. The artists are currently seeking
funding to develop the project as an AR app in Fall               Franck, M. (2020) Geographic Data Visualization.
2021.                                                             https://youtu.be/0cv37IFJRxg (retrieved 16 March,
                                                                  2021).
A series of two-dimensional digital images, and                   Gorman, A. (2019) Dr. Space Junk Vs. The
small time-lapse animated gifs will be produced for               Universe. MIT Press,USA.
social media (Instagram SnapChat, TikTok) as
educational tokens, fulfilling a major goal of the                Heavens Above https://www.heavens-above.com/
project – to produce this data in dynamic and                     (retrieved 16 March, 2021).
seductive ways which capture the attention of                     Huang, M, Bob Hunt, and Dave Mosher (2021)
social media users. A high-quality archival ink print             What Elon Musk's 42,000 Starlink satellites could
series will also be produced for exhibition ready                 do     for   —    and      to   —      planet   Earth
presentation of the project in combination with the               https://www.businessinsider.com/how-elon-musk-
immersive VEMS installation. All of these digital                 42000-starlink-satellites-earth-effects-stars-2020-
tokens will reference particular sets of satellites as            10 (retrieved 16 March, 2021).
they orbit the Earth on specific days. The Galileo
network will become a set, as will a Starlink satellite           N2YO.com https://www.n2yo.com/api/ (retrieved 15
series. These latter satellites currently form the                March 2021).
most populated active satellite category. Their
unique linear formation which links 60 objects at a

                                                           219
All The Stars We Cannot See: A deep look into real-time satellite traffic
Megan L. Smith & Yujie Gao
North American Aerospace Defense Command Smith, M., Desnoyers-Stewart, J., Kratzig, G.
(NORAD) https://www.norad.mil/ (retrieved 16 (2019) Designing Virtual Reality Tools: making
March, 2021). simulated interventions feel and act like their real
counterparts. I/ITSEC, Orlando, December.
Our World: 1967 TV experiment links five
continents by satellite. SpaceX Starlink.
https://www.cbc.ca/archives/entry/our-world-five- https://www.spacex.com/launches/ (retrieved 15
continents-linked-via-satellite (retrieved 15 March March 2021).
2021).
Starlink Launches.
Smith, M., Desnoyers-Stewart, J. (2019) Riding https://en.wikipedia.org/wiki/Starlink (retrieved. 15
Through Walls: A journey of physical computing March 2021).
through Google Street View. In: Weinel, J., Bowen,
TouchDesigner. https://derivative.ca/ (retrieved. 15
J.P., Diprose, G., and Lambert, N. (eds), EVA
March 2021).
London 2019 (Electronic Visualisation and the Arts)
2019. doi: 10.14236/ewic/EVA2019.71
220You can also read