Alaska Department of Environmental Conservation - Amendments to: State Air Quality Control Plan Vol. II: Analysis of Problems, Control Actions ...
←
→
Page content transcription
If your browser does not render page correctly, please read the page content below
Alaska Department of Environmental Conservation

                   Amendments to:

           State Air Quality Control Plan

      Vol. II: Analysis of Problems, Control Actions

 Section III.B: Anchorage Transportation Control Program

                        Adopted

                    August 5th, 2009
Anchorage CO Maintenance Plan
Proposed Revision to the
State of Alaska Air Quality Control Plan
Vol. II: Analysis of Problems, Control Actions
Section III.B: Anchorage Transportation Control Program
Prepared by the
Municipality of Anchorage
Department of Health and Human Services
for submission to the
Alaska Department of Environmental Conservation
for inclusion in the
State Implementation Plan for Air Quality
Approved by the AMATS Policy Committee June 2, 2009
Adopted by the Anchorage Assembly May 26, 2009
Adopted August 5th, 2009(This page serves as a placeholder for two-sided copying)
Adopted August 5th, 2009A note on the format and organization of this document.
This document is organized and formatted to be consistent with the State of Alaska Air
Quality Control Plan. This document is intended to replace Section IIIB, Volume II of
the plan and is organized accordingly.
Adopted August 5th, 2009(This page serves as a placeholder for two-sided copying)
Adopted August 5th, 2009Introductory Note: In this document each reference to “CAAA” means
the Clean Air Act Amendments of 1990, P.L. 101-549.
SECTION III.B ANCHORAGE CARBON MONOXIDE CONTROL PROGRAM
III.B.1. Planning Process
Background
Anchorage was first declared a nonattainment area for carbon monoxide (CO) on January
27, 1978. The Alaska Department of Environmental Conservation (ADEC) had
recommended that the Environmental Protection Agency (EPA) designate a major portion of
the Anchorage urban area as a nonattainment area for CO. The EPA accepted this
recommendation, and in 1982 the Municipality of Anchorage (MOA) prepared a CO
attainment plan which was incorporated as a revision to the State of Alaska Air Quality
Control Plan. The State of Alaska Air Quality Control Plan serves as the State
Implementation Plan (SIP) for air quality. A primary goal of the Anchorage CO plan was to
attain the National Ambient Air Quality Standard (NAAQS) by December 31, 1987.
Anchorage, however, failed to achieve attainment by the December 31, 1987 deadline
mandated in the 1977 Clean Air Act Amendments (CAAA). The Clean Air Act was
amended again in November 1990. When these amendments were published, the EPA
designated Anchorage as a “moderate” nonattainment area for CO and required the
submission of a revised air quality plan to bring Anchorage into attainment with the
NAAQS by December 31, 1995. The MOA prepared a revised air quality attainment plan
that was approved by the Anchorage Metropolitan Area Transportation Solutions (AMATS)
Policy Committee and Anchorage Assembly in December 1992. It was later approved by
the EPA as a revision to the Alaska SIP in 1995. However, two violations* of the NAAQS
were measured in 1996. As a consequence, on July 13, 1998, the EPA reclassified
Anchorage from a “moderate” to a “serious” nonattainment area for CO.
Anchorage has not violated the NAAQS since 1996. Upon review of Anchorage CO
monitoring data, EPA determined that Anchorage had attained the NAAQS. This finding
was published in a July 12, 2001 Federal Register Notice (Federal Register Vol. 66, No.134,
pages 36476-36477, effective August 13, 2001). However an “attainment finding” in and of
itself is not sufficient to redesignate an area to attainment. The CAAA establishes additional
planning requirements that must be satisfied before the EPA administrator can reclassify an
area to attainment. An attainment plan and subsequently, a maintenance plan must be
submitted to EPA for approval. The attainment plan, which shows that Anchorage achieved
the emission reductions necessary to attain the CO NAAQS by the December 31, 2000
deadline stipulated in the CAAA for serious CO nonattainment areas, was completed and
approved by the Anchorage Assembly on September 25, 2001. ADEC incorporated the plan
as a revision to the Alaska SIP which was later approved by the EPA effective October 18,
2002.
* Three exceedances of the NAAQS were measured at both the Seward Highway site and Benson site.
Because the NAAQS allows one exceedance of the NAAQS per year at each site, three exceedances at a site
constitute two violations.
III.B.1-1 Adopted August 5th, 2009After the approval of the attainment plan, a maintenance plan was prepared. It showed that
CO emissions in Anchorage would remain at a level that assures continued attainment of the
NAAQS through calendar year 2023. The maintenance plan was approved by the
Anchorage Assembly on October 7, 2003 and submitted to ADEC as a proposed revision to
the Alaska SIP. ADEC obtained approval of this SIP revision by the EPA, effective July 23,
2004. With this approval, the EPA Regional Administrator reclassified Anchorage from
serious CO nonattainment to an area that is in attainment with the NAAQS. The primary
CO control measures committed for implementation in the 2004 maintenance plan were the
Vehicle Inspection and Maintenance (I/M) Program, the Share-A-Ride / Vanpool Program,
and the block heater promotion program.
On November 6, 2007 the Anchorage Assembly voted to discontinue the I/M Program by
December 31, 2009 or earlier if EPA approval of the SIP revision necessary to delete this
committed SIP measure could be obtained.* However, on July 15, 2008 they revoked this
action and voted to continue I/M with some modifications. The most significant change to
the I/M Program was extending the testing exemption for new cars from four to six years.
Beginning January 2010, the first I/M test will be required six years after the purchase of a
new car instead of four years.†
The document contained herein is a revision to the 2004 maintenance plan. This document
outlines on-going and future commitments to ensure continued maintenance of the CO
NAAQS in Anchorage.
To ensure that there is adequate participation by local elected officials and citizens in this
planning process, the CAAA contain specific mandatory attainment planning provisions.
These requirements, and MOA's response to them, are discussed below.
Local Planning Process
The Anchorage air quality maintenance plan was prepared in accordance with the provisions
of sections 110(a)(2)(M) and 174 of the CAAA (42 U.S.C. 7410(a)(2)(m) and 42 U.S.C.
7504), which require the consultation and participation of local political subdivisions and
local elected officials. Under section 174 (42 U.S.C. 7504), the revised plan submitted to
EPA as a formal SIP amendment must be prepared by "an organization certified by the
State, in consultation with elected officials of local governments." Such an organization is
required to include local elected officials and representatives of the following organizations:
• the state air quality planning agency (i.e., ADEC);
• the state transportation planning agency (i.e., Alaska Department of Transportation
& Public Facilities (ADOT/PF)); and
• the metropolitan planning organization (MPO) responsible for the Continuing,
Cooperative, and Comprehensive (3C) transportation planning process for the
affected area.
* Assembly Ordinance 2007-122(S)
† These actions were taken in Assembly Ordinance 2008-84(S). The ordinance also exempts vehicles with
historical and classic license plates from testing.
III.B.1-2 Adopted August 5th, 2009In 1976, the governor designated the MOA as the MPO for the Anchorage urbanized area.
Consequently, the MOA conducts the 3C transportation planning process required under
federal regulation, in cooperation with ADEC and ADOT/PF, through the AMATS planning
group. In 1978, the governor designated MOA as the lead air quality planning agency in
Anchorage. Based on this designation, MOA has continued its role as the lead air quality
planning agency in the Anchorage area for the preparation of this plan. The air quality
planning process is outlined in the AMATS Intergovernmental Operating Agreement for
Transportation and Air Quality Planning. This agreement was last revised in August 2002
and became effective January 1, 2003. This operating agreement establishes the roles and
relationships between governmental entities involved in the Anchorage air quality planning
process.
Development of this plan required close coordination between air quality and transportation
planning agencies in the community. This coordination was ensured through the oversight
of the AMATS Policy Committee during plan development. AMATS is an on-going
comprehensive transportation planning process for Anchorage. Cooperative efforts include
1) projecting future land use trends and transportation demands; 2) recommending long-
range solutions for transportation needs; and 3) working together to implement the
recommendations. The AMATS structure consists of a two-tiered committee system that
reviews all transportation planning efforts within the area.
The AMATS Policy Committee provides guidance and control over studies and
recommendations developed by support staff. Voting members of the Policy Committee are
listed below.
• MOA Mayor;
• ADOT/PF Central Regional Director;
• MOA Assembly representative;
• MOA Assembly representative; and
• ADEC Commissioner or designee.
The AMATS Technical Advisory Committee (TAC) and member support staff analyze
transportation and land use issues and develop draft recommendations for the Policy
Committee. Voting members include the following:
• MOA Traffic Director;
• MOA Project Management and Engineering Director;
• MOA Planning Director;
• MOA Public Transportation Director;
• MOA Department of Health & Human Services representative;
• MOA Port of Anchorage Director;
• ADOT/PF Chief of Planning & Administration;
• ADOT/PF Regional Pre-Construction Engineer;
• ADEC representative;
• Alaska Railroad representative; and
• AMATS Air Quality Advisory Committee representative.
In addition, to help provide public input into the current air quality planning process by
interested local groups and individual citizens, a third AMATS committee, the Air Quality
III.B.1-3 Adopted August 5th, 2009Advisory Committee was appointed by the Policy Committee. The Air Quality Advisory
Committee is comprised of nine members. Committee membership has generally included
at least one physician or health professional, a representative of the I/M industry, a
representative of the environmental community, and a representative from the Municipal
Planning and Zoning Commission.
Air Quality Goals and Objectives
The goals and objectives of the Anchorage air quality maintenance plan provide the basis
upon which the plan is developed and provide direction for future policy decisions that may
affect air quality. The goals and objectives of the plan must reflect the intent of the CAAA
as well the values, views, and desires of the citizens of Anchorage and their elected officials.
The goals and objectives need to integrate land use, air quality and transportation planning
concerns. For this reason, the goals and objectives of this plan are designed to complement
goals and objectives identified in the Anchorage Bowl Comprehensive Plan and Anchorage
Long Range Transportation Plan.
Primary Goals and Objectives:
1. Continued maintenance of the NAAQS for CO throughout the Municipality of
Anchorage through 2023 and beyond. †
2. Prevention of significant deterioration of air quality within the Municipality of
Anchorage.
3. Development and implementation of control measures necessary to maintain compliance
with the NAAQS through 2023.
4. Identification of contingency measures to be implemented if violations of the NAAQS
occur.
5. Establishment of a mobile source emission budget to be used in future conformity
determinations of transportation plans and programs.
In addition to the primary goals and objectives, there are community goals and objectives
that must be considered and striven for during the development and implementation of the
plan.
Community Goals and Objectives:
1. Clear healthful air that is free of noxious odors and pollutants.
2. Protection of the health of the citizens of the Municipality of Anchorage from the
harmful effects of air pollution.
3. Establishment of an effective public information and participation program to ensure that
the citizens of the Municipality of Anchorage have an active role in air quality planning.
4. Minimization of the negative regulatory and economic impact of air pollution control
measures on Anchorage citizens and businesses.
† Section 175A of the Clean Air Act requires maintenance plans to provide for the maintenance of the national
primary ambient air quality standard for at least ten years after redesignation. The Anchorage plan exceeds
this minimum requirement and demonstrates maintenance for a 15-year period, 2009-2023. The original
maintenance plan covered the 20-year period 2003-2023.
III.B.1-4 Adopted August 5th, 20095. Implementation and support of an efficient transportation system that offers affordable,
viable choices among various modes of travel that serve all parts of the community and
aids in the achievement of the goals and objectives of the State Implementation Plan for
Air Quality.
Plan Development
This maintenance plan is a natural extension of a research planning effort begun in early
1997. The MOA collaborated with EPA Region 10, ADEC and the Fairbanks North Star
Borough on a number of research projects aimed at quantifying the contribution of vehicle
cold starts and warm up idling on ambient CO concentrations in Anchorage and Fairbanks.
These studies provided insights that were important in developing this plan and in preparing
the attainment and maintenance plans that preceded it.
The most significant revisions proposed in this maintenance plan are the extension of the
new car I/M test exemption from four to six years and modifications to the contingency
plan. The contingency plan outlines the actions that will be taken if Anchorage violates the
CO NAAQS in the future. The revised contingency plan can be found in Section III.B.7.
Public Participation Process
Section 110(a) of the CAAA (42 U.S.C. 7410(a)) requires that a state provide reasonable
notice and public hearings of SIP revisions prior to their adoption and submission to EPA.
To ensure that the public had adequate opportunity to comment on revisions to the
Anchorage air quality attainment and maintenance plans, a multi-phase public involvement
process, utilizing AMATS and the Anchorage Assembly was used.
AMATS Air Quality Advisory Committee – The AMATS Air Quality Advisory Committee
held a public meeting on the maintenance plan revisions on April 27, 2009. During this
meeting they recommended that the AMATS Technical and Policy Committees adopt the
plan as revised.
AMATS Technical and Policy Committees – After reviewing the recommendation of the
AMATS Citizen Air Quality Advisory Committee, on May 21, 2009, the AMATS Technical
Committee recommended that the AMATS Policy Committee adopt the plan. Subsequent to
this recommendation, the AMATS Policy Committee met on June 2, 2009 to review and
adopt the the plan.
Anchorage Assembly – The Anchorage Assembly adopted the plan during its regular public
meeting held on May 26, 2009. A copy of Assembly Resolution AR 2009-144 is included
in the Appendix to Section III.B.10.
ADEC hearings – The final opportunity for public involvement occurs at the state
administrative level. Prior to regulatory adoption of SIP revisions, ADEC holds public
hearings on the revisions in the affected communities. ADEC held a public hearing on the
Anchorage CO maintenance plan on July 13th, 2009. This provided another forum for the
public to comment on the air quality plan prior to state adoption and submission to EPA.
III.B.1-5 Adopted August 5th, 2009III.B. 2. Maintenance Area Boundary
Portions of the MOA were first identified as experiencing high levels of ambient CO
concentrations in the early 1970s. The nonattainment area within the MOA was first
declared on January 27, 1978 after the completion of a monitoring study that measured CO
concentrations at numerous locations. The results of that study were included in the 1979
State Air Quality Plan. EPA reaffirmed the boundaries of the nonattainment area on
November 6, 1991 (56 Fed.Reg. 56694, 56711)(40 C.F.R. 81.302. These same boundaries
serve as the Anchorage CO Maintenance Area contained within the boundary described as
follows:
Beginning at a point on the centerline of the New Seward Highway five hundred (500) feet
south of the centerline of O’Malley Road; thence,
Westerly along a line five hundred (500) feet south of and parallel to the centerline of O’Malley
Road and its westerly extension thereof to a point on the mean high tide line of the Turnagain Arm;
thence,
Northwesterly along the mean high tide line to a point five hundred (500) feet west of the
southerly extension of the centerline of Sand Lake Road; thence,
Northerly along a line five hundred (500) feet west of and parallel to the southerly extension of
the centerline of Sand Lake Road to a point on the southerly boundary of the Ted Stevens Anchorage
International Airport property; thence,
Westerly along said property line of the Ted Stevens Anchorage International Airport to an
angle point in said property line; thence,
Northerly along said property of the Ted Stevens Anchorage International Airport to an angle
point in said property line; thence,
Easterly, along said property line and its easterly extension thereof to a point five hundred (500)
feet west of the southerly extension of the centerline of Wisconsin Street; thence,
Northerly along said line to a point on the mean high tide line of the Knik Arm; thence,
Northeasterly along the mean high tide line to a point on a line parallel and five hundred (500)
feet north of the centerline of Thompson Street and the westerly extension thereof; thence,
Easterly along said line to a point five hundred (500) feet east of Boniface Parkway; thence,
Southerly along a line five hundred (500) feet east of and parallel to the centerline of Boniface
Parkway to a point five hundred (500) feet north of the Glenn Highway; thence,
Easterly and northeasterly along a line five hundred (500) feet north of and parallel to the
centerline of the Glenn Highway to a point five hundred (500) feet east of the northerly extension of
the centerline of Muldoon Road; thence,
Southerly along a line five hundred (500) feet east of and parallel to the centerline of Muldoon
Road and continuing southwesterly on a line of curvature five hundred (500) feet southeasterly of the
centerline of curvature where Muldoon Road becomes Tudor Road to a point five hundred (500) feet
south of the centerline of Tudor Road; thence,
Westerly along a line five hundred (500) feet south of the centerline of Tudor Road to a point
five hundred (500) feet east of the centerline of Lake Otis Parkway; thence,
Southerly, southeasterly, then southerly along a line five hundred (500) feet parallel to the
centerline of Lake Otis Parkway to a point five hundred (500) feet south of the centerline of
O’Malley Road; thence,
Westerly along a line five hundred (500) feet south of the centerline of O’Malley Road, ending
at the centerline of the New Seward Highway, which is the point of the beginning.
III.B.2-1 Adopted August 5th, 2009The maintenance area boundary is shown in Figure III.B.2-1. This boundary is identical to
the nonattainment boundary identified in previous attainment plans and it became the
maintenance area boundary for the Municipality of Anchorage on July 23, 2004 when the
the EPA approved the original Anchorage maintenance plan. Figure III.B.2-1 also shows
the locations of CO monitoring stations in Anchorage. Monitoring at a number of these
stations has been discontinued because measured values at these stations were low relative
to other comparable sites in the network.
Figure III.B.2-1
MOA CO Monitoring Network and Maintenance Area Boundary
III.B.2-2 Adopted August 5th, 2009(This page serves as a placeholder for two-sided copying)
Adopted August 5th, 2009III.B.3. Nature of the CO Problem – Causes and Trends
Sources of CO – 2007 Area-wide Base Year Emission Inventory
Section 187 of the CAAA (42 U.S.C. 7512a) requires serious CO nonattainment areas to
submit an inventory of actual emissions from all sources in accordance with guidance
developed by EPA. This emission inventory, Anchorage Carbon Monoxide Emission
Inventory and Projections 2007 – 2023, is contained in the Appendix to Section III.B.3.
The area inventoried includes the entire Anchorage maintenance area including areas to the
west and east of the inventory boundary. These areas are included because of the growth
and development that have occurred there over the past three decades. Elmendorf Air Force
Base and Fort Richardson are not included in the inventory area.
According to the latest inventory compiled for the Anchorage area for base year 2007, 67%
of winter season CO emissions in the maintenance area were from motor vehicles. 1 Because
a large portion of these motor vehicle emissions are produced from cold engines and warm-
up idling, a significant amount of resources and effort were devoted to accurately
quantifying these impacts. The EPA MOBILE model is poorly suited for estimating this
component of motor vehicle emissions. The MOA collaborated with the Fairbanks North
Star Borough and ADEC on a local research effort aimed at quantifying the contribution of
cold weather warm-up idling on the emission inventory. This research suggests that cold
starts and warm-up idling are a very important component of vehicle emissions. In the
winter, many Anchorage drivers engage in extended warm-ups, particularly prior to their
morning commute. A study conducted in Anchorage during the winter of 1998-99 indicated
that the average warm-up period for morning commuters was 12 minutes. 2
Over the course of a 24-hour winter day, warm-up idling is estimated to account for nearly a
quarter of all vehicle emissions generated in the Anchorage bowl. In some residential areas,
idling accounts for almost half of all the CO emissions generated. Cold winter temperatures
increase "cold start" emissions. When the EPA MOBILE6 model is run with Anchorage
fleet characteristics, CO emissions at start up are almost three times greater at 20 °F than at
65 °F.
Other significant sources of CO in Anchorage include aircraft and residential wood burning.
Estimated 2007 CO emissions sources in Anchorage are summarized in Table III.B.3-1. In
addition to the base year 2007 inventory, emission forecasts were prepared for 2009, 2011,
2013, 2015, 2017, 2019, 2021 and 2023. These forecasts were used to develop the long term
maintenance projections presented later in Section III.B.5.
Grid-based inventories were developed for each year. These grid-based inventories provide
separate estimates of emissions for the 200 one square kilometer grid cells that make up the
Anchorage inventory area. These grid-based estimates of emissions were further resolved
by time-of-day. An estimate of the quantity of CO emitted during the AM peak traffic
period (7 AM – 9 AM), the PM peak (3 PM - 6 PM) and off peak periods (6 PM- 7 AM and
9 AM – 3 PM) was provided for each grid cell. The results and methodology used to
prepare these inventories is discussed in detail in the Appendix to Section III.B.3.
III.B.3-1 Adopted August 5th, 2009Table III.B.3-1
Sources of Anchorage CO Emissions in 2007 Base Year (Area-wide)
CO Emitted
Source Category (tons per day) % of total
Motor vehicle – on-road travel 51.0 50.5%
Motor vehicle – warm-up idle 16.3 16.2%
Ted Stevens Anchorage International Airport
Operations 12.4 12.2%
Merrill Field Airport Operations 0.7 0.7%
Wood burning – fireplaces and wood stoves 6.2 6.2%
Space heating – natural gas 3.8 3.7%
Miscellaneous (railroad, marine,
snowmobiles, snow removal, portable
electrical generators, welding, etc.) 9.3 9.2%
Point sources (power generation, sewage
sludge incineration) 1.3 1.3%
TOTAL 101.0 100%
Analysis of CO Emissions Sources in Turnagain Area
In addition to the area-wide inventory discussed above, a micro-inventory was also prepared
for the nine square kilometer area surrounding the Turnagain monitoring station in west
Anchorage. The Turnagain station exhibits the highest CO concentrations of the current
monitoring network; it has been shown to be approximately 20% higher than the next
highest site. Analysis of historical CO data from over twenty monitoring locations in
Anchorage suggests that the CO concentrations measured at this site are representative of
the highest concentrations in Anchorage. 3 This micro-inventory provides added insight into
the sources of CO in this particular area and is useful in developing appropriate localized
control strategies. The boundaries of this nine square kilometer micro-inventory area are
shown in Figure III.B.3-1 (a). This is one of the most densely populated and heavily
trafficked areas of Anchorage. It also includes residential neighborhoods where vehicles are
parked outside at night resulting in a prevalence of cold starts and warm-up idling. As can
be seen in the figure, gridded inventory results suggest that CO emissions in this area are
among the highest in the Anchorage bowl.
III.B.3-2 Adopted August 5th, 2009Figure III.B.3-1 (a)
CO Emissions Distribution in Anchorage
(Turnagain Micro-inventory Boundary noted with Red Border)
A breakdown of CO emissions in the Turnagain area is shown in Figure III.B.3-1 (b). Total
estimated CO emissions during a 24-hour winter weekday were estimated to be 5.99 tons per
day in 2007. These emissions can also be broken down by time-of-day to gain further
insight into the nature of the CO sources in the Turnagain area. Figure IIII.B.3-1(c) shows
CO emission rates (in lbs/hour) by source during the AM peak, PM peak and off-peak
periods. Note that warm-up idle emissions are particularly significant during the AM peak.
Not surprisingly, the Turnagain station typically exhibits its highest hourly CO
concentrations shortly after this AM peak.
III.B.3-3 Adopted August 5th, 2009Figure III.B.3-1(b)
24–Hour CO Emissions in the 9 km2 Area Surrounding the Turnagain Station
Base Year 2007 Inventory
space heating other warm-up idle
5% 12% 19%
fireplaces &
woodstoves
10%
on-road Travel
54%
Total CO emissions = 6.01 tons per day
Figure III.B.3-1(c)
CO Emission Rate by Time-of-Day in Area Surrounding the Turnagain Station
Base Year 2007 Inventory
1,200
other
space heating
1,000 fireplaces & woodstoves
on-road travel
CO emissions (lbs per hour)
warm-up idle
800
600
400
200
0
AM Peak PM Peak Off Peak
III.B.3-4 Adopted August 5th, 2009Evidence suggests that CO emissions from the Ted Stevens Anchorage International
Airport, located approximately two kilometers west of the Turnagain monitoring site, have
little effect on ambient CO concentrations in the Turnagain area. CO monitoring at the
airport itself suggests that concentrations there are relatively low. Although total CO
emissions from the airport are significant (12.4 tons per day in 2007), they are spread out
over a large area so that the CO emissions density (in pounds emitted per square
kilometer/day) is relatively low. The emission density in some one-kilometer grids
immediately surrounding the Turnagain monitor is four or five times greater than the airport
(see Figure III.B.3-1 (a).
Future Periodic Inventories
Periodic inventories are not required for maintenance areas. CAAA Section 175A(b)
requires the submission of a SIP revision eight years after redesignation as a maintenance
area. An emission inventory will be prepared to support this SIP revision. The MOA and/or
ADEC may choose to prepare an additional inventory(s) in the interim.
Summary of Local Research
Beginning in 1997, the MOA, in cooperation with the EPA, ADEC, and the Fairbanks North
Star Borough, conducted a number of studies to advance the understanding of the causes of
the winter season CO problem in Anchorage and Fairbanks. In particular, these studies
focused on quantifying the contribution of cold-starts and warm-up idling on the problem.
These studies are summarized below.
CO Saturation Monitoring Study (1997-98)
The MOA performed additional CO monitoring during the period December 4, 1997 -
February 4, 1998. Sixteen temporary monitoring sites were established to assess how well
the four station permanent network was characterizing the air quality near congested
roadway intersections, in neighborhoods, and in parking lots. Monitoring was conducted at
a total of 20 locations during the study period. Six sites were located near major roadway
intersections, five in neighborhoods, and five in large retail or employee parking lots. The
maximum 8-hour concentrations measured at each of the 20 sites in the study are compared
in Figure III.B.3-2.
III.B.3-5 Adopted August 5th, 2009Figure III.B.3-2
Maximum 8-hour CO Concentrations Measured During CO Saturation Monitoring Study
(1997-98)
The highest 8-hour CO concentrations were found at neighborhood locations with relatively
low traffic volumes. The Turnagain neighborhood site (at Turnagain Street and 31st
Avenue) recorded the highest and second highest 8-hour concentrations in the study. The
next highest site was the Garden permanent station, also located in a neighborhood. Vehicle
cold starts and warm-up idling by morning commuters were implicated as the cause of the
elevated CO observed in these neighborhoods.
The permanent station at Seward Highway recorded the highest concentration of any of the
six roadway intersection sites. The study concluded that the permanent station at Seward
Highway adequately characterizes the upper range of CO concentrations experienced near
Anchorage’s major roadways. Lower than expected concentrations were found near a
number of congested intersections. For example, the highest concentration measured near
the busy intersection of Lake Otis Boulevard and Tudor Road was about 50% lower than the
Turnagain neighborhood site.
CO concentrations at the five parking lot sites were generally lower than those found in
neighborhoods or near the major roadway intersections monitored during the study. This
was somewhat surprising given the number of vehicle start ups that originated in these
parking lots. Many of these start ups, especially in retail shopping parking lots, were likely
to be “hot starts,” however, meaning that engines were still warm from an earlier trip.
Warmer engines emit considerably lower amounts of CO and this may account for the
relatively low ambient concentrations observed.
III.B.3-6 Adopted August 5th, 2009Anchorage Winter Season Driver Idling Behavior Study (1997-98)
The MOA conducted a study between November 28, 1997 and January 31, 1998 aimed at
quantifying the amount of warm-up idling performed by Anchorage drivers. Field staff
observed 1,321 vehicle starts at diverse locations in Anchorage. Warm-up idling duration
was documented for trips that began at homes, work places, and other locations including
shopping centers, restaurants, and schools.
Transportation planning models typically categorize trips into three categories as follows:
• Home-based work (HBW) trips – Commute trips that involve travel directly from
home to work or from work to home.
• Home-based other (HBO) trips – Trips that originate from home to some location
other than work (e.g., shopping center, school, health club, doctor office, etc.) or the
return trip from the “other” location if it returns directly home.
• Non home-based (NHB) trips – Trips that originate from some location other than
home (e.g., work, shopping, etc.) and are not a HBW or HBO trip.
Field observations were used to estimate idle duration for each of the trip purpose categories
described above. The longest warm-up idle times were associated with morning HBW trips.
The average idle duration for these trips was over 7 minutes. About 35% of morning HBW
trips involved vehicles parked overnight in heated garages. Idle duration for these vehicles
averaged less than one minute. The average idle duration for vehicles parked outside was
over 12 minutes. The average idle duration for evening HBW trips beginning at the
workplace was 3.4 minutes. The shortest idle durations were associated with morning and
midday NHB trips that began at sites other than work or home. Median idle time for these
trips was less than one minute.
Engine soak times, the length of time that an engine sits in the cold between trips, were also
estimated as part of the driver idling behavior study. Longer soak times result in colder
engines and increased CO emissions. Data from a travel survey conducted by Hellenthal
and Associates for the MOA in 1992 were used to estimate soak times by trip purpose and
time of day. Results of the driver idling behavior study are shown in Table III.B.3-2.
TABLE III.B.3-2
Anchorage Winter Season Driver Behavior Study
Soak Time and Idle Duration by Time of Day and Trip Purpose
Soak Time Idle Duration
(hours) (minutes)
Trip Average Median Average Median
Time of Day Purpose
Morning HBW 11.9 12.8 7.3 5.7
6:00 a.m. – 9:00 a.m. HBO 10.7 12.0 5.9 4.8
NHB 1.1 0.1 0.8 0.6
Midday HBW 6.3 3.7 3.5 2.0
9:00 a.m. – 3:00 p.m. HBO 6.6 1.7 2.0 1.2
NHB 1.6 0.6 1.6 0.6
Evening HBW 6.8 8.2 3.4 1.2
3:00 p.m. – 6:00 p.m. HBO 2.6 0.8 2.1 0.9
NHB 3.0 0.8 3.1 0.8
Night HBW 5.8 4.5 3.0 1.2
6:00 p.m. – 6:00 a.m. HBO 2.0 1.2 2.6 2.7
NHB 2.0 1.0 1.5 1.3
III.B.3-7 Adopted August 5th, 2009Table III.B.3-2 shows that the longest soak times and idle durations are associated with
morning HBW trips and HBO trips. Because most of these trips begin with a cold engine
and involve long idles, it suggests that start up and idle CO emissions are likely to be greater
than other trip types. Conversely, NHB trips, because they typically involve short soak
times and idle durations, likely have relatively low start-up and idle CO emissions.
Alaska Drive Cycle Study (2000)
In 1996, EPA issued a final rule that revised the certification test procedure to account for
the effects of aggressive driving conditions, high acceleration rates and air conditioning on
motor vehicle emissions. The rule required manufacturers to control excess emissions
produced under these previously unrepresented driving conditions and was phased-in
between 2000 and 2002 model year vehicles. The rulemaking significantly impacted
emission inventory estimates for all pollutants by increasing estimates for pre-2000 model
year vehicles and dramatically reducing emissions from post 2000 model year vehicles. A
review of the high-speed, high acceleration rates represented in the new driving cycles led to
concern about how well they represented winter time driving conditions when snow, ice and
darkness are the prevalent conditions in Anchorage and Fairbanks.
Under contract with ADEC, Sierra Research worked with transportation agencies in
Anchorage and Fairbanks to select representative routes in those communities. Data were
collected using a “chase car” equipped with a GPS system to collect second-by-second
position measurements over each of the routes driven. The “chase car” followed and
mimicked the behavior of randomly selected vehicles while driving over the route so that the
collected data represented the operation of in-use vehicles. A total of 80 separate routes
were driven in Anchorage and 79 routes in Fairbanks.
The position measurements in the collected data set were differentiated to produce speed
estimates. Summary statistics were computed for each community and blended in
proportion to each community’s share of their combined travel to produce an overall
estimate of activity. The results showed that winter driving in Alaska had almost none of
the high speed, high acceleration rate driving represented in EPA’s revised certification test
procedure. As a result, a decision was made to not include the effects of these driving
conditions on the emission inventories developed for both Anchorage and Fairbanks.
The collected driving data was used to develop a driving cycle representative of Alaska
driving conditions. The approach used to develop the Alaska Driving Cycle was to select a
mixture of driving patterns that best represented the overall speed acceleration frequency
distribution of the collected dataset. Over 5,000 candidate cycles were created.
Adjustments were made to minimize brake wear during decelerations and improve
representation of constant speed activity. The resulting cycle was designed to mimic the
federal test procedure (FTP) by establishing a cold start, hot start and stabilized mode of
operation. Bag 1, the cold start, includes 2 minutes of idle activity and is 500 seconds long.
Bag 3 is a repeat of Bag 1 with a hot start instead of a cold start. Bag 2 is 316 seconds long
and represents operation between seconds 501 and 816.
Alaska Cold Temperature Vehicle Emission Studies (1998 – 2001)
In the time since the attainment and maintenance planning process began in 1997, two
significant studies have been undertaken to better understand the nature of vehicle emissions
in Alaska’s cold winter climate. The MOA collaborated with ADEC and the Fairbanks
III.B.3-8 Adopted August 5th, 2009North Star Borough on the design of these studies, both of which were conducted by Sierra
Research working under contract with ADEC.
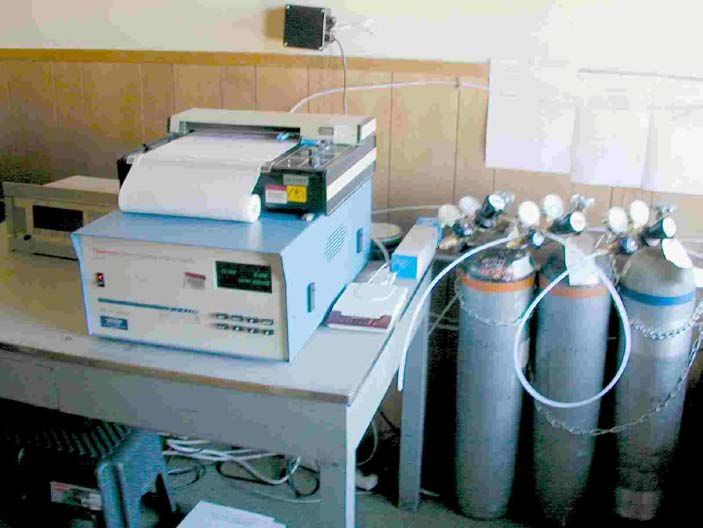
During the winter of 1998-99, Sierra Research conducted a study to quantify emissions from
Alaskan vehicles during cold start and idling. They equipped a large van with a modified
Horiba IMVETS emissions test system that provided measurements of CO and hydrocarbon
(HC) mass emissions on a second-by-second basis. The van could be driven from location
to location to test a variety of vehicles representative of the fleet mix in both Anchorage and
Fairbanks.
After an initial cold soak of four hours or more at ambient temperature, test vehicles were
cold-started and mass emissions were measured for a period of twenty minutes subsequent
to start-up. Testing was conducted at ambient temperatures that ranged from -6 °F to +23 °F
in Anchorage and -36 °F to +14 °F in Fairbanks.
A second, follow-up vehicle emission study was conducted in Fairbanks during the winter of
2000-2001. For this study, Sierra Research procured a vehicle dynamometer that allowed
vehicle emissions to be measured in simulated transient or travel mode. Sierra Research
performed a gamut of tests on a sample of 35 vehicles selected to represent the Anchorage
and Fairbanks fleet mix. These tests included a variety of soak and warm-up times designed
to examine the influence of soak and idle times on CO emissions generated during the
course of a vehicle trip. Transient mode emissions were evaluated with the dynamometer
using the Alaska Drive Cycle to best reflect actual winter-season driving behavior in
Anchorage. The emission reduction benefits of engine block heater use were also evaluated.
Key findings from these two studies are summarized below:
• A large portion of CO emissions occur during warm-up idle.
In order to simulate a typical morning commute in Anchorage, CO emissions from cold-
started vehicles were measured during the course of a 10-minute warm-up and a
subsequent 7.3 mile drive. The warm-up idle accounted for 68% of the total CO
emitted.
• Emissions decrease dramatically during the course of a warm-up idle.
Testing showed that idle emissions drop significantly during the first five minutes,
especially for newer model vehicles. Figure III.B.3-3 shows the decrease in emissions
over time.
III.B.3-9 Adopted August 5th, 2009Figure III.B.3-3
Cold Start Idle Emission Rate vs. Time
(emissions in grams per minute)
50
40
a
30
20
10
0
0 1 2 3 4 5 6 7 8 9 10 11 12 13 14 15 16 17 18 19 20
Cold Start Idle Time (minutes)
• Engine block heaters provide very significant reductions in cold start and warm-up idle
emissions.
Test data showed that, during the first ten minutes of a warm-up idle, the use of an
engine block heater reduced CO emissions by an average of 57%. Fuel consumption
was reduced by 22% during this same ten-minute period.
• Anti-idling programs appear to offer little promise of significant CO emission
reductions.
Test data showed that on an overall trip basis, CO emissions actually increase when
warm-up idle times are cut shorter than 10 minutes. When the idle time is cut to 5
minutes, Sierra Research found that overall trip emissions increased by an average of
8%, and by about 20% when the warm-up time was cut to 2 minutes. They also found
that there was little or no air quality benefit from turning off a warmed-up vehicle if it
was going to be started soon thereafter. For example, they found that turning-off a
warmed vehicle during a short (60 minute or less) shopping errand provides no CO air
quality benefit. The emissions from a vehicle left running were roughly comparable to a
vehicle that was turned off and re-started at the end of the errand.
Anchorage I/M Evaluation Study (2006)
During the winter of 2005-2006, under contract with the MOA, Sierra Research conducted
dynamometer emissions testing on over 200 vehicles in order to quantify the CO emission
reductions provided by I/M under “real world” conditions in Anchorage. 4 This testing
simulated the driving behaviors and temperatures experienced in the winter when CO
concentrations are the highest. Vehicles were recruited from owners whose vehicles had
recently failed an I/M test in one of Anchorage’s 80 privately-operated I/M testing facilities.
Vehicles were tested both before and after repair to determine the CO reduction provided by
the repair.
III.B.3-10 Adopted August 5th, 2009Some key findings:
• The I/M Program is projected to reduce CO emissions from the Anchorage vehicle fleet
by approximately 12% in 2010.‡
This reduction is reasonably consistent with emissions reductions predicted by the EPA
model MOBILE6.
• The I/M Program is less effective in reducing cold start / warm-up idle emissions than
reducing emissions from warm vehicles.
CO reductions resulting from I/M repairs were more than three times greater during the
warm or “running” phase of the Alaska Drive Cycle (ADC) than during the 10 minute
idle period following a cold start.
• The I/M Program is less effective at reducing emissions from newer vehicles.
Because newer vehicles emit less CO, I/M repairs on these vehicles yield less benefit.
On average, repairing a model year 1996 or newer vehicle that has failed I/M reduces
CO by about 5 grams per mile. The repair of model year vehicles between 1990 and
1995 produces an average emission reduction nearly five times greater, about 24 grams
per mile.
‡ This is the estimated aggregate benefit of I/M. Based on emission testing of over 200 vehicles, Sierra
Research estimated that I/M reduction from a single cycle of I/M testing and repair to be 5.1% among the fleet
subject to I/M. When the effects of multiple I/M testing and repair cycles, seasonal waivers, and pre-
inspection repairs were considered, the overall CO reduction benefit for the Anchorage fleet as a whole was
estimated to be 12.1%.
III.B.3-11 Adopted August 5th, 2009Influence of Meteorology on Ambient CO Concentrations
In Anchorage, CO concentrations are highest during the months of November through
February. As a high-latitude community, with long winter nights and weak daytime solar
insolation, Anchorage frequently experiences strong and persistent temperature inversions
that trap CO close to the ground. In mid-winter, due to the short daytime period available
for warming and the low sun angle, inversions often persist throughout the day. Inversion
strengths as high as +5°F per 100 foot rise in elevation have been measured. When winds
are light, there is little vertical or horizontal dispersion of pollutants. Poor dispersion
conditions, combined with high emission rates from motor vehicles started in cold
temperatures create an environment particularly conducive to developing elevated CO
concentrations.
The highest CO concentrations tend to occur on days with low wind speeds, clear or partly
cloudy skies, and cold temperatures. Weather conditions during periods when the 8-hour
average CO concentrations at the Turnagain site were at or above the 98th percentile are
summarized in Table III.B.3-3.§ .The average temperature during these periods was 4°F,
with a range from -16°F to +18°F. The average wind speed was 2 miles per hour.
It should be noted that Local Climatological Data from the National Weather Service
observatory at Point Campbell on the Ted Stevens Anchorage International Airport were
used to prepare Table III.B.3-3. Point Campbell is in the extreme western part of
Anchorage, adjacent to Cook Inlet. Temperatures there are often moderated by the
surrounding water body. Temperatures in east Anchorage, away from the inlet, can
sometimes be 10 to 20°F lower than temperatures in west Anchorage. Wind speeds at Point
Campbell can also be higher than areas to the east, particularly under a northerly wind
regime. Thus, the wind speed and temperatures recorded at Point Campbell may not always
accurately reflect conditions elsewhere in Anchorage.
§ CO data from Turnagain for the period October 1998 – December 2008 were analyzed to determine the 98th
percentile 8-hour average concentration. This was computed to be 5.8 ppm. Table III.B.3-3 provides a
summary of weather conditions during 8-hour periods when CO concentrations were equal to or higher than
5.8 ppm.
III.B.3-12 Adopted August 5th, 2009Table III.B.3-3
Meteorological Conditions during Periods of High CO Concentrations at
Turnagain Monitoring Station (8-hour Average >= 98th Percentile)
October 1998 – December 2008
8-hour Wind
Average Day Temp Speed Sky
Date (ppm) of Week Time of Day (°F) (mph) Cover*
12/16/1998 7.69 Wed 4 PM - 12 AM 2 2 CLR
12/24/1998 8.06 Thu 4 PM - 12 AM 6 0 FEW
1/4/1999 5.90 Mon 4 PM - 12 AM -1 4 CLR
1/6/1999 10.14 Wed 11 AM - 7 PM 2 2 FEW
2/7/1999 5.80 Sun 10 PM - 6 AM -9 2 FEW
2/8/1999 7.31 Mon 3 AM - 11 AM -9 7 SCT
2/11/1999 6.09 Thu 1 AM -9 AM -16 4 CLR
2/22/1999 6.50 Mon 7 PM - 3 AM 9 3 BKN
2/23/1999 7.61 Tues 4 AM - 12 PM 11 0 OVC
11/10/1999 5.93 Wed 4 AM - 12 PM 10 4 CLR
11/27/1999 7.16 Sat 5 PM - 1 AM 10 1 CLR
12/6/1999 7.24 Mon 6 AM - 2 PM 9 5 CLR
1/15/2000 7.21 Sat 7 PM - 3 AM 2 3 CLR
2/17/2001 6.13 Sat 10 PM - 6 AM 15 2 CLR
11/13/2001 6.13 Tues 7 PM - 3 AM 14 0 SCT
11/14/2001 7.74 Wed 4 AM - 12 PM 12 0 SCT
11/30/2001 5.90 Fri 9 PM - 5 AM 1 2 FEW
12/3/2001 6.30 Mon 8 AM - 4 PM -3 1 CLR
12/4/2001 5.95 Tues 8 AM - 4 PM 2 3 FEW
12/5/2001 7.23 Wed 7 AM - 3 PM 3 3 BKN
12/7/2001 6.28 Fri 5 PM - 1 AM -7 3 BKN
12/16/2001 9.78 Sun 12 PM -8 PM -8 5 SCT
12/18/2001 7.40 Tues 9 AM - 5 PM -6 3 SCT
1/25/2002 5.86 Fri 4 AM - 12 PM 2 5 CLR
2/6/2002 6.49 Wed 4 AM - 12 PM 18 0 SCT
12/5/2003 8.27 Fri 5 PM - 1 AM 8 2 CLR
1/1/2004 7.48 Thu 2 PM - 10 PM 4 0 SCT
1/3/2004 7.61 Sat 1 PM - 9 PM 11 2 CLR
1/4/2004 7.88 Sun 12 PM -8 PM 6 3 BKN
1/5/2004 8.11 Mon 10 AM - 6 PM 5 0 FOG
1/12/2004 5.87 Mon 5 PM - 1 AM 6 1 FEW
1/17/2006 6.09 Tues 6 AM - 2 PM 8 2 BKN
1/24/2006 6.11 Tues 4 AM - 12 PM -5 1 SCT
11/29/2006 6.53 Wed 8 AM - 4 PM 14 0 SCT
12/29/08 6.35 Mon 7 AM – 3 PM -2 0 FEW
* Sky Cover is the fraction amount of sky obscured. CLR = 0, FEW = 1/8 - 2/8, SCT = 3/8 – 4/8,
BKN = 5/8 – 7/8, OVC = 8/8
III.B.3-13 Adopted August 5th, 2009Diurnal Pattern in CO Concentrations
There is a distinct diurnal pattern in ambient CO concentration that corresponds to driving
patterns in the vicinity of a monitoring site. Residential neighborhood sites like Turnagain
and Garden typically experience their highest concentrations in the mid-morning following
the morning commute and accompanying vehicle warm-up idle. Figure III.B.3-4(a) shows
the 99th percentile hourly concentration measured at the Turnagain and Garden sites during
the winter CO seasons (October-March) in the period 2000-2008. The diurnal patterns
observed at these two sites are very similar and implicate cold start and warm-up idling as a
significant source of emissions at both sites. CO concentrations rise quickly in the early
morning hours as commuters start their cars and leave for work from these two residential
neighborhoods. They peak between 9 and 10 a.m. and drop off substantially during the late
morning and early afternoon. Concentrations build again somewhat in the evening hours but
the evening peak is substantially lower than the morning peak.
Figure III.B.3-4(a)
Diurnal Variation in 99th Percentile Hourly CO Concentrations at
Turnagain and Garden Monitoring Stations (2000-2008)
10.0
9.0 mid-morning peak corresponds
with departure of commuters from
8.0 neighborhoods
CO Concentration (ppm)
7.0
6.0
5.0
4.0
3.0
2.0
Turnagain Garden
1.0
0.0
1 3 5 7 9 11 13 15 17 19 21 23
Hour of Day
The diurnal pattern in CO concentrations near major traffic arterials is different than
residential areas. Figure III.B.3-4(b) shows the diurnal pattern at the Seward Highway
station, located at the busy intersection of the Seward Highway and Benson Boulevard**
Although a morning peak is present, the highest concentrations in the day correspond with
the evening commute. Concentrations peak between 5 and 6 p.m. and decline slowly
** The Seward Highway Station was decommissioned on December 30, 2004. This discussion and Figure
III.B.3-4(b) therefore are limited to data collected from 2000-2004.
III.B.3-14 Adopted August 5th, 2009thereafter. Cold start emissions from evening commuters leaving from downtown and mid-
town employment centers likely contribute to this evening peak.
Figure III.B.3-4(b)
Diurnal Variation in 99th Percentile Hourly CO Concentrations at
Seward Highway Monitoring Stations (2000-2004)
10.0
9.0
8.0
Seward Highway
CO Concentration (ppm)
7.0
6.0
5.0
4.0
3.0
2.0
1.0
0.0
1 3 5 7 9 11 13 15 17 19 21 23
Hour of Day
Role of Mechanical Turbulence from Vehicle Traffic in Reducing Ambient CO
Concentrations during Stagnation Conditions
As noted to earlier, the highest CO concentrations in Anchorage tend to occur in residential
neighborhoods rather than near major roadways where vehicle traffic volumes may be an
order of magnitude greater. Although vehicle cold starts result in higher per vehicle
emission rates in residential areas, total CO emissions in commercial areas in midtown
Anchorage are greater due to the shear volume of vehicles traveling along its major
roadways. If the ambient CO concentration in a particular area were solely a function of the
quantity of emission produced there, CO concentrations near major roadways in midtown
Anchorage should be higher than residential areas. Ambient monitoring data indicate that
this is not the case.
In testimony given before a National Research Council committee assembled in 2001 to
review the CO problem in Fairbanks, Anchorage and other cold climate areas, the MOA
posed the hypothesis that mechanical mixing from high-speed vehicle traffic may reduce
ambient CO concentrations near major traffic thoroughfares on severe stagnation days. 5
Monitoring data support this hypothesis.
III.B.3-15 Adopted August 5th, 2009Figure III.B.3-5 compares CO concentrations by percentile at the Seward Highway and
Turnagain stations. Traffic volumes are an order of magnitude greater near the Seward
Highway station than the Turnagain station. On days when natural atmospheric mixing
from wind and thermal convection is good, the additional mixing provided by mechanical
turbulence of vehicle traffic at Seward Highway is relatively unimportant. Under these
conditions one would expect CO concentrations at Seward Highway to be higher than those
at Turnagain because traffic and CO emissions are so much greater. Indeed, the lower
quartile (P25) and median (P50) concentration are considerably higher at Seward than
Turnagain. However, when a strong ground-based temperature inversion and lack of wind
create very poor natural atmospheric mixing, mechanical mixing from vehicle traffic
appears to be a very important factor in mitigating the build up of high CO concentrations.
Under these extreme meteorological conditions concentrations at Turnagain are much higher
than those at Seward Highway. The 99th percentile (P99) CO concentration at the
Turnagain station is more than 40% higher than the Seward Highway station.
Figure III.B.3-5
Effect of Mechanical Mixing on CO Concentrations at
Seward Highway and Turnagain Stations
10.0
mechanical mixing from traffic becomes an important factor in
9.0 mitigating the build up of CO at Seward Highay when natural
atmospheric mixing is limited .
8-hr Avg CO Concentration (ppm)
8.0
7.1
7.0
6.0 as natural mixing decreases, CO builds up
4.9
5.0 4.7
4.0
4.0
2.8
3.0 2.4
2.1
2.0 1.6 1.4
0.9
1.0
0.0
P25 P50 P75 P95 P99
Percentile
Turnagain (low mechanical mixing) Seward Highway (high mechanical mixing)
.
III.B.3-16 Adopted August 5th, 2009Carbon Monoxide Trends
In 1983, CO levels in Anchorage exceeded the NAAQS at one or more monitoring sites on
53 days. During midwinter months in the early 1980’s, a violation of the NAAQS was
measured roughly one-in-four days. However CO concentrations have fallen dramatically
over the past twenty years. No violations have been measured since 1996. Single
exceedances of the NAAQS were measured in 1998, 1999 and 2001 but these are not
considered violations because the NAAQS allows up to one exceedance per calendar year.
No exceedances were measured in 1995, 1997, 2000, or between 2002 and 2008.
The highest and second highest 8-hour averages for five Anchorage monitoring stations are
tabulated by year, 1980 – 2008, in Table III.B.3-5. The number of days exceeding the
NAAQS at each station is also tabulated. Dramatic declines in CO have occurred in
Anchorage over the past three decades.
Data from the 7th & C Street, Jewel Lake and Bowman, and 8th and L stations are not
tabulated. Monitoring at 7th & C was discontinued in 1995 because concentrations there
were the lowest in the network. The Jewel Lake station went into operation in October 2002
and was discontinued in March 2004 because concentrations measured there were lower
than the other monitors operating in the network. The Bowman station in South Anchorage
was operated from January 2006 through March 2007. It was discontinued because it too
had low CO concentrations. The 8th and L station has only been in operations since October
2007.
The trend in the second highest 8-hour average concentration or second maximum measured
in each calendar year is often used to measure improvements in CO air quality and progress
toward attainment of the NAAQS. The second maximum is statistically more robust (i.e.,
less prone to year-to-year fluctuation) than the first maximum, making it easier to discern
long-term air quality trends. The second maximum is also a direct measure of compliance
with the NAAQS. A community is considered to be in compliance if the second maximum
at all monitoring stations is below 9.5 ppm.
III.B.3-17 Adopted August 5th, 2009Table III.B.3-5
Summary of CO Data from Anchorage Monitoring Stations (1980 –2008)
Sand Lake Seward Turnagain
Benson Garden (neighborhood) (microscale) (neighborhood)
(microscale) (neighborhood) 3426 Raspberry 3002 New Seward 3201 Turnagain
2902 Spenard Road 3000 E 16th Street Road Highway Street
2nd # days 2nd # days 2nd # days 2nd # days 2nd # days
Year max max ≥9.5 max max ≥9.5 max max ≥9.5 Max max ≥9.5 max max ≥9.5
1980 27.4 26.3 39 17.1 16.8 21 14.0 14.0 6 -- -- -- -- -- --
1981 17.4 16.2 33 12.6 11.2 7 12.6 11.3 5 -- -- -- -- -- --
1982 21.6 18.1 30 15.6 13.9 14 16.6 11.9 3 -- -- -- -- -- --
1983 20.2 16.0 48 19.6 18.0 24 11.5 11.4 7 -- -- -- -- -- --
1984 17.3 17.1 27 13.0 12.9 6 12.6 11.6 5 -- -- -- -- -- --
1985 12.6 12.4 9 12.7 12.2 4 9.2 8.9 0 -- -- -- -- -- --
1986 12.4 11.7 5 10.5 8.8 1 8.1 7.6 0 -- -- -- -- -- --
1987 9.8 8.6 1 10.7 9.5 1 8.1 6.3 0 -- -- -- -- -- --
1988 11.4 10.4 3 11.8 10.5 2 8.5 8.4 0 12.3 11.8 9 -- -- --
1989 9.8 9.6 2 14.0 13.1 2 10.0 8.4 1 14.0 12.2 5 -- -- --
1990 9.5 9.4 1 9.8 9.0 1 8.8 8.0 0 13.0 11.6 11 -- -- --
1991 9.5 8.1 0 8.9 8.4 0 6.7 6.4 0 11.5 9.8 3 -- -- --
1992 9.0 8.8 0 10.9 10.8 2 7.1 7.0 0 10.4 9.5 2 -- -- --
1993 8.2 7.6 0 10.0 9.7 2 8.8 5.1 0 10.4 9.9 2 -- -- --
1994 8.4 8.3 0 9.4 8.6 0 5.8 5.7 0 11.3 11.0 2 -- -- --
1995 9.2 7.6 0 8.4 7.4 0 6.7 6.3 0 9.0 8.4 0 -- -- --
1996 11.0 9.6 3 8.9 8.7 0 7.7 6.9 0 10.8 10.5 3 -- -- --
1997 7.1 6.8 0 7.3 7.1 0 5.9 4.9 0 7.3 7.0 0 -- -- --
1998 9.3 8.2 0 9.5 8.4 1 -- -- -- 9.4 7.9 0 8.1* 7.7* 0*
1999 6.6 5.9 0 8.2 7.8 0 -- -- -- 7.5 6.5 0 10.1 7.6 1
2000 5.2 4.7 0 5.8 5.4 0 -- -- -- 5.2 4.8 0 7.2 5.5 0
2001 6.2 5.7 6.1 5.7 0 -- -- -- 5.4 5.2 0 9.8 7.7 1
2002 -- -- -- 4.7 4.6 0 -- -- -- 5.4 4.7 0 6.4 5.8 0
2003 -- -- -- 6.1 5.7 0 -- -- -- 6.2 5.4 0 8.3 6.7 0
2004 -- -- -- 6.8 6.4 0 -- -- -- 5.8 5.5 0 8.1 7.9 0
2005 -- -- -- 4.8 4.8 0 -- -- -- -- -- -- 5.7 4.6 0
2006 -- -- -- 5.1 4.3 0 -- -- -- -- -- -- 6.5 6.1 0
2007 -- -- -- 4.0 3.5 0 -- -- -- -- -- -- 5.5 5.3 0
2008 -- -- -- 4.0 3.7 0 -- -- -- -- -- -- 6.3 5.4 0
* Incomplete year of data. In 1998 Turnagain station began operations in mid-October.
III.B.3-18 Adopted August 5th, 2009You can also read