Air pollution from gas refinery through contamination with various elements disrupts semiarid Zagros oak (Quercus brantii Lindl.) forests, Iran ...
←
→
Page content transcription
If your browser does not render page correctly, please read the page content below
www.nature.com/scientificreports
OPEN Air pollution from gas refinery
through contamination
with various elements disrupts
semiarid Zagros oak (Quercus
brantii Lindl.) forests, Iran
Hamed Dadkhah‑Aghdash1, Hassan Zare‑Maivan1*, Mehdi Heydari2, Mohsen Sharifi1,
Manuel Esteban Lucas‑Borja3 & Ravi Naidu4
Soils and oak trees (Quercus brantii Lindl.) in Zagros forests are suffering from the air pollution caused
by the Ilam Gas Refinery. Thus, for the first time, we investigated the contamination level of sulfur
and trace elements in these ecosystems. Sampling of soil and tree leaves was carried out in different
seasons of 2019 and at different distances from the gas refinery. The results showed that soils and
leaves at the various distances compared with control distance (10,000 m) were more affected by
the gas refinery. Distance from the pollution source and physicochemical properties of soils were
the main factors affecting contamination of soil elements contents. The soils with pollution load
indices (PLI) of 4.54 were in the highly polluted category. Sulfur was at highly polluted category in
soils and were highly enriched in trees. The trees mainly absorbed studied elements via their aerial
organs. Our findings indicated that oak trees with the highest value of metal accumulation index are
influence tools for monitoring various elements in the polluted air produced by the gas refinery. It is
recommended that the ecosystem components near the refinery be studied to accurately evaluate
disorders in the food chain.
Environmental pollution in countries with rapid industrial development is one of the most challenging persistent
causes of danger to human h ealth1 as well as generating significant direct and indirect adverse effects on p
lants2,3.
Factors including air humidity, precipitation, and hot temperatures may exacerbate pollution damage to plants4
even further. Plants can absorb air pollutants through roots and bioaccumulate in the leaves and bark of t rees5–7.
Forests are among the most valuable and widespread components of terrestrial ecosystems and are vulnerable to
increasing depositions of trace elements in line with increased unsustainable industrial and economic activity8,9.
For example, the semiarid oak forests of Zagros that are located in the west of Iran and in bordering Iraq are one
of these valuable forest ecosystems. In recent years, Ilam Gas Refinery (IGR) was established and continued its
relentless activity, soils and Brant oak trees (Quercus brantii Lindl.) in forests are subjected to potentially toxic
elements (PTEs) and sulfur gases released from its exhaust output throughout the year and across different
distances. These atmospheric contaminants are deposited depending on their particle sizes, wind velocity and
direction and accumulate directly on canopies and aerial parts of trees. In the long run, the higher concentrations
of trace elements become potentially harmful to the environmental components, such as soil in which case its
remediation proves costly and c umbersome10. Soils are commonly the sink for accumulating trace elements in
terrestrial ecosystems networking to other organisms in the food chain and the a tmosphere11.
Many factors affect the distribution of PTEs in terrestrial ecosystems. For example, the topography of the
impacted area, dominant wind velocity and direction, total leaf surface area index and proportion of plant cover,
background bedrock, as well as, the particle size of pollutants, the height of exhausts, and pollution load outputs
all affect deposition rate on leaves and s oils12. Physical-structural properties of the exhaust tower of industrial
1
Department of Plant Biology, Faculty of Biological Sciences, Tarbiat Modares University, Tehran, Iran. 2Department
of Forest Sciences, Faculty of Agriculture, Ilam University, Ilam, Iran. 3Department of Agroforestry Technology
and Science and Genetics, Higher Technical School of Advanced Agricultural and Forestry Engineering, Castilla La
Mancha University, Albacete, Spain. 4Global Centre for Environmental Remediation (GCER), Faculty of Science,
The University of Newcastle, University Drive, Callaghan, NSW 2308, Australia. *email: zaremaih@modares.ac.ir
Scientific Reports | (2022) 12:284 | https://doi.org/10.1038/s41598-021-04429-8 1
Vol.:(0123456789)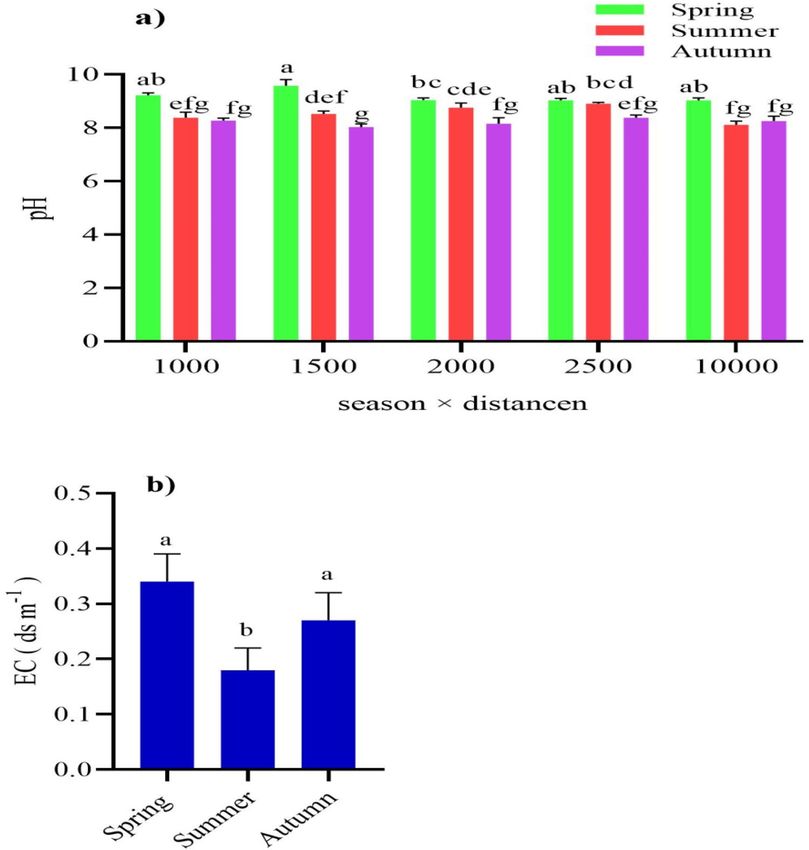
www.nature.com/scientificreports/
plants affect the Hydrogen Sulfide gas as the major form of sulfur in the atmosphere and trace elements of which
are deposited in soils and plants of terrestrial ecosystems, affecting tree health13.
PTEs, from either natural or anthropogenic sources, has high stability in the environment and are generally
non-degradable; they can be transported in the air or accumulated and deposited in inner layers of i t14. Soil type,
its physical and chemical properties including texture, and the nature of different trace elements are the main
factors that affect the accumulation of elements in s oils15.
Various pollution indices such as the enrichment factor (EF) and the geoaccumulation index (Igeo) can be
used to measure the level of trace elements in the s oil14. Although many studies have been conducted on levels
of trace elements pollution in urban and agricultural soils, only a few have studied the trace elements pollution
assessment of forest soils16. For example, Koptsik et al.17 reported on the adverse effects of air pollution source
on forest ecosystems from Russia. Also, sulfur dioxide was the main pollutant emitted by the Jeddah oil refinery
in Saudi Arabia, and it adversely affected the surrounding environment4. So far, little work has been done on
the biomonitoring of trace elements in the ecosystems near the gas refinery and petrochemical plants in Iran18.
Ilam Gas Refinery (IGR) was established about 14 years ago in the sub-mountainous region of Zagros oak
(Quercus brantii Lindl.) forest ecosystems. Many toxic atmospheric pollutants and trace elements are released
from the gas refinery in different seasons of the year and across various distances. These contaminants can
accumulate directly in aerial organs of trees from the air portion and indirectly via absorbed pollutants in soils
and then transformed to tree organs.
Despite the immense importance of the Zagros forest ecosystems to the living of local inhabitants and for-
est biota, the establishing of refinery serves development purposes without environmental regard. It is usually
claimed that IGR is not a polluting plant. But, there is no data to support this claim. We have provided data that
gas refinery activities contaminating the environment, and its contamination is dependent on the season and the
distance from the source. The duration of the activity, in the long run, will cause accumulative contamination in
the ecosystem components and consumers and potentially cause health risks in the food chain. Findings of this
original and first time investigated research will raise awareness and allow environmental authorities to enforce
regulations more often and monitor air quality regularly. Besides, we provide a simple analysis methodology
of soil samples and tree leaves to monitor levels of metal bioaccumulation in the ecosystem components for
better management applications and practices. The objectives of this research are (i) Investigation of the season
and distance changes from the gas refinery on the sulfur and various trace elements concentrations in soils and
oak leaves, (ii) Assessment of sulfur and trace element contamination levels in soils and tree leaves, and (iii)
Establishment of environmental contamination data reference in Zagros Forest ecosystems for future use. We
hypothesise that the soils and oak trees will be affected by sulfur and various trace elements’ concentration in
different seasons and at different distances from the gas refinery.
Results
Multivariate analyses of the effect of season and distance on different elements of soil and
leaf samples. Regarding multivariate analyses for the soil nonmetric multidimensional scaling (NMDS) for
distance (S, Cr, Cu, Mn, Ni, Pb, As, and Zn), there were two clusters: one for distances of 1000, 1500, 2000, and
2500 m (so that different elements at these distances were equally influenced by the pollution source), and the
other for the control at 10,000 m distance in a separate cluster. Regarding multivariate analyses for leaf NMDS
for distance, there were three different clusters. One cluster was the closest distance (1000 m from the source),
another included the 1500, 2000, and 2500 m distances (all of these distances were similarly influenced by pol-
lution), and the third was the 10,000 m (control) distance from the source (Fig. 1a,b). Regarding multivariate
analyses for the soil and leaf NMDS for the season (S, Cr, Cu, Mn, Ni, Pb, As, and Zn), no clear pattern was
observed for the effect of the season (Fig. 2a,b).
The effects of air pollution on soil texture and its physicochemical properties. The soil textures
at 1000 and 1500 m distances were loam clay; other distances also had a loam texture, with mean clay, silt, and
sand percentages of 40.6%, 25%, and 34.4% at these different distances from the IGR plant, respectively.
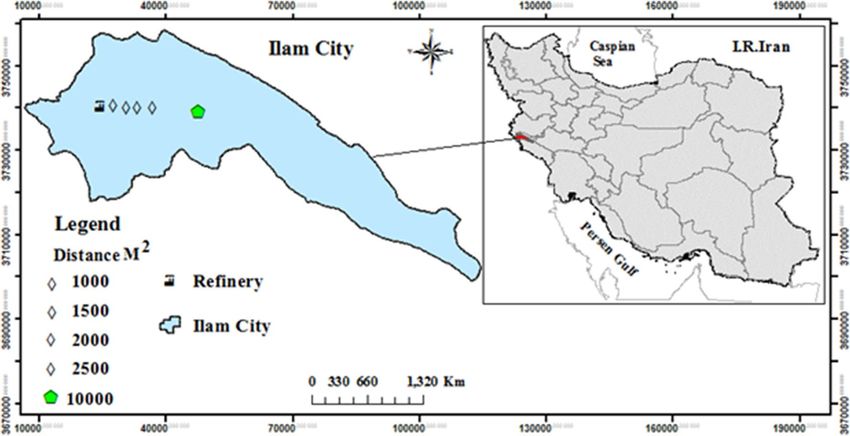
Soils in summer at the control distance had the significantly lowest basic pH (8.11; p < 0.05) as compared
with other distances. Inversely, there were no significant differences in soil pH at various distances in spring
and autumn compared with the control distance (Fig. 3a). Soils were with the lowest EC in summer (0.10 ds/m;
p < 0.05) compared with the other seasons (Fig. 3b).
The concentration of different elements in soils and leaves and a comparison. The mean ele-
ment concentrations of S, Cr, Cu, Mn, Ni, Pb, As, and Zn in the soil samples, in decreasing order, S > Mn > As
> Ni > Zn > Cr > Cu > Pb (Table 1). The mean element concentrations (mg kg−1) in oak tree leaves were 1,794 for
S, 8.07 for Cr, 5.14 for Cu, 22.81 for Mn, 5.3 for Ni, 2.35 for Pb, 11.7 for As, and 26.7 for Zn; thus, in decreasing
order S > Zn > Mn > As > Cr > Ni > Cu > Pb. The S and Pb elements in the leaf and soil samples had the highest
and lowest concentrations, respectively. The elements of As, Cr, Ni, and S were higher than specified in the soil
quality standards of the Iran Department of Environment and world soil standards19,20.
Pollution assessment of different elements in soil and leaf samples. The mean Igeo values for S,
Cr, Cu, Mn, Ni, Pb, As, and Zn, were in decreasing order and ranked as S > As > Pb > Mn > Ni > Cu > Cr > Zn. The
mean soil PI values were 1,457.56 for S, 1.22 for Cr, 1.48 for Cu, 1.73 for Mn, 1.51 for Ni, 3.36 for Pb, 12.35 for
As, and 1.06 for Zn; thus, in decreasing order and ranked S > As > Pb > Mn > Ni > Cu > Cr > Zn (Table 2). Besides,
the PLIs in all soil samples were 4.54.
Scientific Reports | (2022) 12:284 | https://doi.org/10.1038/s41598-021-04429-8 2
Vol:.(1234567890)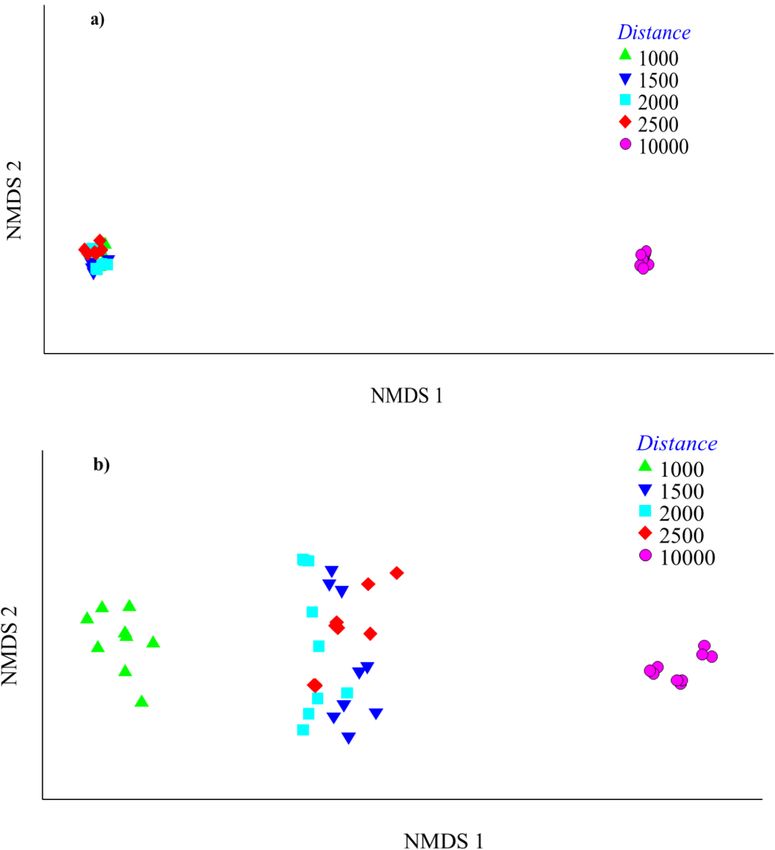
www.nature.com/scientificreports/

                                 Figure 1.  Ordination by soil (a) and leaf (b) nonmetric multidimensional scaling (NMDS) of distance (1000,
                                 1500, 2000, 2500, 10,000 m) showing the different elements (S, Cr, Cu, Mn, Ni, Pb, As and Zn). Resemblance:
                                 S17 Bray Curtis similarity, Transform: Log(X + 1), 2D Stress: 0.01.

                                     The BCF showed the capability of trees to absorb various elements from the soil portion. The mean BCF values
                                 for S, Cr, Cu, Mn, Ni, Pb, As and Zn, in decreasing order for accumulation of metals based on the BCF value,
                                 Pb > Zn > Cu > As > Cr > S = Ni > Mn (Table 2). The mean EF values for S, Cr, Cu, Mn, Ni, Pb, As, and Zn were in
                                 decreasing order, S > Cr > Ni > Pb > As > Zn > Cu > Mn. The mean AOM values were 75 for S, 40 for Cr, 39 for Cu,
                                 32 for Mn, 39 for Ni, 38 for Pb, 40 for As, and 32 for Zn (Table 2). The mean metal accumulation sub-index of
                                 studied elements in oak tree leaves was in decreasing order and ranked as S > Mn > As > Cu > Cr > Zn > Pb > Ni.
                                 Besides, the MAI of leaves was 19.91 (Fig. 4).

                                 Discussion
                                 Results indicated pollution loads from the source at different distances affect the concentration of various ele-
                                 ments in the soils and leaves differently. Pollution source has differential effects according to how proximate a site
                                 is to it. This is evident from the data for distances up to 2500 m from the gas refinery which showed the greatest
                                 concentration of trace elements in soil and oak tree leaves. Data analysis clustered control distance separated
                                 from the other four distances which clustered together. Lower quantities of elements in soils and leaves at the
                                 closest distance are most likely because of the height of the flame exhaust tower of the gas refinery which affects
                                 the trajectory of contaminants transport and deposition in conjunction with wind velocity.

Scientific Reports |   (2022) 12:284 |                https://doi.org/10.1038/s41598-021-04429-8                                                     3

                                                                                                                                                Vol.:(0123456789)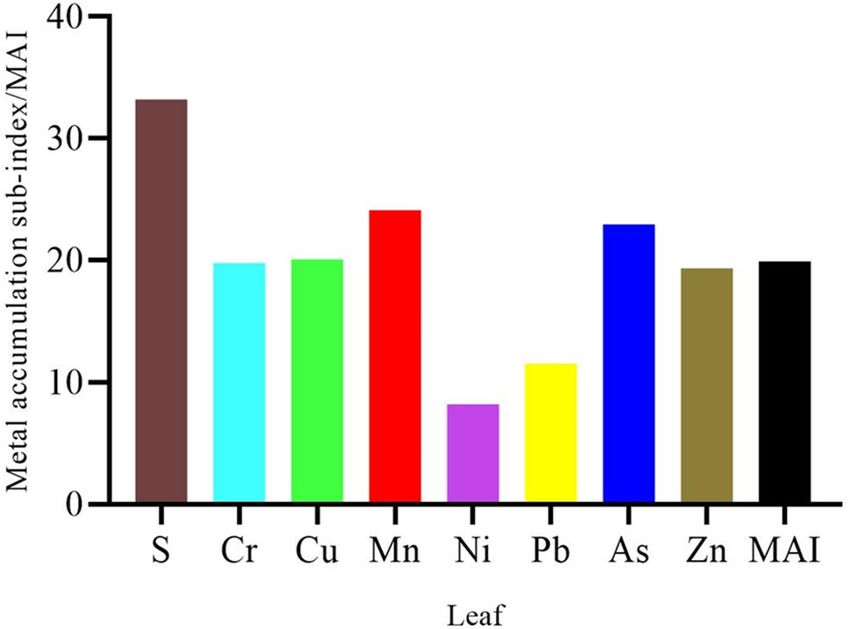
www.nature.com/scientificreports/
Figure 2. Ordination by soil (a) and leaf (b) nonmetric multidimensional scaling (NMDS) for season (spring,
summer and autumn) showing the different elements (S, Cr, Cu, Mn, Ni, Pb, As and Zn). Resemblance: S17 Bray
Curtis similarity, Transform: Log(X + 1), 2D Stress: 0.01.
Elements in tree leaves were affected by the season and the distance from the source. Due to the semiarid
climate of this forest and low available moisture, soil and leaf element loads remained unchanged across seasons.
More prevalent spring rains could deposit high pollutants and trace elements that accumulate on the leaf surfaces
compared to other seasons, summer was hotter and drier, and autumn lead to leaf senescence. Another broad-leaf
forest tree species, such as Tilia cordata Mill. had similar responses21 to air pollution.
In explaining the concentrations of trace elements in the soil, three sets of factors could be considered: (i) Soil
properties such as pH, EC, and texture and (ii) Environmental factors such as distance from pollution source,
seasonal changes, and different climatic and geographic conditions and (iii) Physical and structural as well as
exhaust output properties of the IGR plant, such as size or height of the exhaust tower and output loads per unit
of time. There is a positive correlation with the clay particle size of soil and concentration of trace elements to the
highly polluted category in s oils22. The geology of the bedrock, the geography of the Zagros Forests, and climate
conditions in this forest as well as the anthropogenic contribution of the gas refinery caused the sampled soils to
have basic pH and differing EC properties across seasons and distances from the gas refinery.
Scientific Reports | (2022) 12:284 | https://doi.org/10.1038/s41598-021-04429-8 4
Vol:.(1234567890)www.nature.com/scientificreports/
Figure 3. The effects of air pollution on soil properties of pH (a) and EC (b) for different seasons and distances
from the gas refinery.
Studied element (mg kg−1) Soil World soil standards Iranian soil standards
AS 125.02 4.7 17
Cr 53.07 42 0.4
Cu 22.23 14 63
Pb 3.18 25 300
Ni 68.12 18 50
Zn 67.10 62 200
Mn 364.72 418 –
S 7707.69 20 –
Table 1. The mean concentration of different elements in soil samples and comparison with world and Iranian
soil standard.
The pH of soils varied by season (moisture and evaporation equation) and distance from the source, but
remained in the alkaline range, with an upper limit of 8. The presence of sodium, carbonate and weathered and
eroding bedrocks of calcic bedrock matter may be the main reasons that these soils were alkaline23. Also, soil
samples in summer had the lowest EC compared with other seasons, but overall mean soil EC (salinity) was
remained EC < 1 ds/m and no saline condition imposed on plant roots. The findings of this investigation cor-
roborate the results of other researches in the greater Zagros ecosystem that reported similar soil property and
behaviour around industrial plants. For example, researchers evaluated soils from different industrial sites in
Scientific Reports | (2022) 12:284 | https://doi.org/10.1038/s41598-021-04429-8 5
Vol.:(0123456789)www.nature.com/scientificreports/
Pollution indices S Cr Cu Mn Ni Pb As Zn
PISoil 1457.56 1.22 1.48 1.73 1.51 3.36 12.35 1.06
Igeosoil 9.89 − 0.32 − 0.03 0.18 0.0 1.03 2.5 − 0.53
EFplant 30.76 1.72 0.24 0.18 1.57 0.79 0.63 0.34
BCFplant 0.07 0.13 0.24 0.06 0.07 0.75 0.16 0.40
AOM (%) 75 40 39 32 39 38 40 31
Table 2. Different pollution indices for S, Cr, Cu, Mn, Ni, Pb, As, and Zn elements in soils and leaf samples
of oak trees. Igeo geoaccumulation index, PI pollution index, BCF bioconcentration factor, EFplant enrichment
factor of plants, AOM air originated metals.
Figure 4. Mean metal accumulation sub-index and MAI of different elements in leaves of oak trees.
Ahvaz and showed that soils had high pH with basic properties and low EC and were almost entirely clay24. Also,
Solgi et al.23 found that the pH of soils was in the neutral to the alkaline range and had a low EC value that was
not saline and the main texture of the soils was loam. In line with our results that soils had pH > 7, and contained
mostly clay which contributes to low mobility of ions and trace elements in soils, other researchers found that
the pH value of soils causes most ions to have low mobility25,26.
The elements of As, Cr, Ni, and S had higher concentrations than recommended by both Iranian and World
Soil Quality Standards for the environment. While sulfur as a nutrient plays an important function in the soils
of forest ecosystems, greater amounts of it will not benefit these e cosystems27. Sulfur concentrations were higher
than established normal levels in both soil and leaf samples. Similar results were reached by Cicek and Koparal19,
who found that soils and oak trees (Quercus infectoria L.) around a pollution source in Turkey showed a greater
sulfur content than of normal range for soils (0.006–0.02 g kg−1) and plants (0.01–0.15 g kg−1). Besides, the con-
centration of studied elements in soil portions was generally higher than those in tree leaves.
Our results show that oak trees had normal ranges for Cu, Zn, and Pb. According to Kabata-Pendias et al.28and
Padmavathiamma et al.29, the concentration of Cu, Zn, and Pb in the ranges of 2–20 mg k g−1 and 10–150 mg
kg−1 and less than 10 mg k g−1 are normal.
Soils show different affinities for adsorption of trace elements, as well as tree species, show different affinities
for absorbing ions and possibly bioaccumulating trace elements. For example, Serbula et al.26 while assessing
various heavy metals in Robinia pseudoacacia L. trees across different sites, found that Hg, As and Cd were lower
than the detection limit and Pb concentration was in the toxic range. In this investigation, As had a higher con-
centration and Pb was in the normal range in oak tree leaves.
According to Qing et al.30 the mean Igeo of S fell in the extremely polluted level, As was in the moderately
to the extremely polluted level, Pb was in the moderate range, Mn and Ni were considered uncontaminated to
the moderately polluted level, and Cr, Zn, and Cu were practically at unpolluted level. The results for I geo and
PI showed that S had the highest and Cr, and Zn had the lowest pollution in soil samples. The PLIs in all soil
samples were in the highly polluted level.
In this research, oak trees with BCF < 1 for studied elements might do not accumulate metals from soils. Due
to alkaline pH and low EC of soils, almost all of the elements had low mobility in soils and low absorption by
oak trees31. This is similar to findings of Serbula et al.26 on the assessment of heavy metals absorption by leaves of
Robinia pseudoacacia L. trees across different alkaline (pH > 7) sites which showed lower metal mobility in soils
and low absorption by trees. Therefore, it is suggested that oak trees accumulate studied elements from aerial
portions, primarily through their leaves.
Scientific Reports | (2022) 12:284 | https://doi.org/10.1038/s41598-021-04429-8 6
Vol:.(1234567890)www.nature.com/scientificreports/
The element of sulfur with EF > 2 was enriched in tree leaves. The properties of leaf organs, such as wax thick-
ness and composition cause different elements to have different enrichment capacities in leaves. These elements
could be taken from the air in leaves to enriched level compared to other elements.
The properties of leaves such as wax layers, the surface condition of leaves, and their structures are important
factors that determine the attraction of different metals from the a ir18. Oak tree leaves with mentioned properties
directly can both absorb and accumulate almost all of the elements with aerial organs. S and Zn had the highest
and lowest capacity for accumulation among the studied elements, respectively. In line with our results, Solgi
et al.23 found that concentrations of Zn, Cu, and Pb in leaves of Fraxinus excelsior L. by washing with distilled
water decreased and their potential to reduce concentration varied among the metals.
Several factors that determine the accumulation of different elements by aerial organs of trees from the
atmosphere include forms and structures of trace elements and their concentration, various tissues and anatomy
of tree components, and their reactions and capacities to accumulate trace elements32. Oak leaves had various
reactions to the pollution of the atmospheric elements of the gas refinery. They were enriched with trace elements
from the air portion. Besides, sulfur in leaves had the highest metal accumulation sub-index. Thus, trees mainly
accumulate trace elements from the aerial organs. On the contrary to our results, Safari et al.18 evaluated various
trace elements in ecosystems around the petrochemical industrial sites and found that tree leaves had low MAI.
Zagros ecosystem provides many values and services in the region, including services such as for sheep herds
and cattle from tree leaves and grasses as well as wild animal species from grass and oak tree seeds. The health
risk is that air pollution from the gas refinery will disrupt these ecosystem components. The concentration of
elements was higher in soils relative to tree leaves. The greater hurdle in the long run will come from pH changes
affecting, in turn, the survivability of buried plant seeds. In addition, contaminating elements could enter the
food chain, through herbaceous plants in growing seasons and potentially place human and other consumers’
health at r isk33. Therefore, to study more precisely the effects of pollution caused by the gas refinery on the food
chain, it is recommended that herbaceous plants are grown in these forest ecosystems be studied further.
Conclusions
Variations in distance from the source compared with different seasons of the year had a higher effect on the
concentration of sulfur and trace elements in the soil samples and tree leaves. Some physicochemical properties
of soils in Zagros forests induced to various elements had low mobility in the soils, and oak trees almost did not
absorb them from the soil portion. According to different pollution indices, sulfur was at the high pollution level
in soil samples, oak leaves and was highly aerial accumulation and enriched in tree leaves. It is concluded that
soil and leaf samples were contaminated with various elements, especially with sulfur. Contaminating elements
in herbaceous plants and tree leaves that grow in polluted soils could enter the food chain in growing seasons,
and potentially place human and other consumers’ health at risk.
Material and methods
Description of study areas. IGR plant (33° 42/N, 46° 13/E) is located along the edge of the mountains of
Zagros forests and 25 km from Ilam city. Its main activity, to supply gas to the western provinces of Iran, started
in 2007. It converts sour gas to sweet gas and also produces various products such as pastil sulfur, ethane, and
liquefied gas. The refinery has two chimneys, which release waste gases into the atmosphere. Oak trees are the
main tree species of the Zagros forests around the refinery; these are exposed to various air pollutants and dif-
ferent elements from this source. Based on random analysis of exhaust emissions, sulfur dioxide and sulfide
hydrogen are the major pollutants emitted from the flare gases of this refinery plant34. The sampling points have
an average altitude of about 1000–1250 m and a slope of less than 20%. The climate of the region is semiarid
and influenced by Mediterranean winds. The predominant wind direction was west and southwest. The highest
and lowest air temperatures were 41.4 °C and − 11.3 °C, respectively. The average annual rainfall was 71.94 mm
(http://www.amarilam.ir).
Samples collection and analyses. All methods were carried out in accordance with the relevant institu-
tional, national, and international guidelines and legislation. Besides they were discussed and approved by the
Research Ethics Committee of Tarbiat Modares University. The formal identification of the Quercus brantii Lindl.
was performed by H. Dadkhah-Aghdash based on colorful Flora of I ran35. The permissions or licenses to collect
Brant oak (Quercus brantii Lindl.) trees in Zagros forests were obtained. A voucher specimen of Brant oaks were
collected and deposited at the Herbarium of department of Plant Biology of Tarbiat Modares University.
We studied different distances (1000, 1500, 2000, 2500, and 10,000 m [control]) in an easterly direction from
the gas refinery. The map of study area was drawn by software of ArcGIS version of 10.5, https://desktop.arcgis.
com (Fig. 5). At each distance, three soil samples taken from the depth of 0–20 cm with a plastic gardening shovel,
30 healthy and mature leaves were collected from a certain height (nearly the middle of the canopy) and the
outer canopy of three Brant oak trees in the late spring, summer, and autumn of 2019. These trees with average
height and diameter at breast height of 5.5 m and 45 cm were selected randomly. The leaf and soil samples were
put into polyethylene bags and transported to the laboratory for analysis36.
In the lab, firstly the leaves were categorized into two types: unwashed leaves and leaves washed with ethyl-
enediaminetetraacetic acid (EDTA) solution to remove some atmospheric dusts and particles deposition. The
leaf and soil samples were dried for 10 days until they reached a constant weight at lab temperature. The leaves
were grinded and homogenized, soils were sieved with ASTM mesh (DAMAVAND, Iran) with a diameter of
2 mm and homogenized.
To determine the pH and electrical conductivity (EC) of soils, 2 g of the soil samples were shaken in 10 ml
of double-distilled water with a ratio of 1:5; after 1 h, the pH and electrical conductivity (EC) of the solution
Scientific Reports | (2022) 12:284 | https://doi.org/10.1038/s41598-021-04429-8 7
Vol.:(0123456789)www.nature.com/scientificreports/
Figure 5. Locations of collection sites of soil samples and Brant oak leaves at five different distances (1000,
1500, 2000, 2500 and 10,000 m [control]) from the gas refinery (drawn by H. Dadkhah-Aghdash using software
of ArcGIS Desktop. version of 10.5. ESRI, California, US. https://desktop.arcgis.com).
were measured by a digital pH meter (Fan Azma Gostar Company, Iran) and EC meter (Sartorius, PT-20, USA).
The analysis of the particle sizes of the soil was carried out using the hydrometer method and texture class was
determined with a soil texture t riangle37.
According to different U.S.EPA protocols that were modified by following references, the soil and leaf sam-
ples were prepared and dissolved. The digestion of soil samples was conducted with a mixture of concentrated
HF–HClO4–HNO338. Approximately 0.5 g of dry soil sample was digested with 10 mL of HCl on a hot plate
at ~ 180 °C until the solution was reduced to 3 mL. Approximately 5 mL of HF (40%, w/w), 5 mL of H NO3 (63%,
w/w), and 3 mL of HClO4 (70%, w/w) were then added and the solution was digested. This process was continued
with adding 3 mL of H NO3, 3 mL of HF, and 1 mL of HClO4 until the silicate minerals had fully disappeared.
This solution was transferred to a 25 mL volumetric tube, and 1% H NO3 was added to bring the sample up to
a constant volume for the element’s determinations. After filtering the digested samples, the concentrations of
sulfur (S), arsenic (As), chromium (Cr), copper (Cu), lead (Pb), zinc (Zn), manganese (Mn), and nickel (Ni) were
measured via inductively coupled plasma mass spectrometry (ICP-MS,7500 CS, Agilent, US). The procedures of
quality assurance and quality control (QA/QC) were performed.To quantify element contents from soil samples,
external standards with calibration levels were used. The precision and the repeatability of the analysis were tested
on the instrument by analyzing three replicate samples.
According to Liang et al.39 leaf samples were acid digested and sieved powder samples were placed in the
acid-washed tubes and 10 mL of 65% nitric acid was added to it. The solution was placed at room temperature
overnight (12 h) after that, it was placed for 4 h at 100 °C and then 4 h at 140 °C until the solution color was clear.
After cooling, the solution was diluted by deionized water to 50 mL and then passed through Whatman filter
paper until 25 mL of the filtrate volume was provided. Each sample was digested three times and the average of
measurements is reported. Total plant elements were measured by using the ICP-MS (7500 CS, Agilent, US). A
control sample was also used beside each sample to determine the background pollution during digestion. To
confirm the accuracy of the methodology and to ensure the extraction of trace elements from the leaf samples,
the standard solution of each studied elements was used.
Measuring of pollution levels of different elements in soils and leaves. For assessment of con-
tamination levels (concentration) of different elements in soils and trees, common indices of pollution includ-
ing geoaccumulation index (Igeo), pollution index (PI), pollution load index (PLI), enrichment factor of plants
(EFplant), bioconcentration factor (BCF), air originated metals (AOM ), metal accumulation index (MAI) were
used.
Igeo was calculated using the following (Eq. 1):
Igeo = log2 [Cn /1.5 Bn ] (1)
where Cn is the measured concentration of the element n, B n is the geoaccumulation background for this ele-
ment and 1.5 is a constant coefficient used to eliminate potential variations in the baseline data40. The Igeo clas-
sifies samples into seven grades: < 0 for practically unpolluted; 0–1 for unpolluted to moderately polluted; 1–2
for moderately polluted; 2–3 for moderately to strongly polluted; 3–4 for strongly polluted; 4–5 for strongly to
extremely polluted; and > 5 for extremely polluted30.
The first PI is expressed as (Eq. 2):
Scientific Reports | (2022) 12:284 | https://doi.org/10.1038/s41598-021-04429-8 8
Vol:.(1234567890)www.nature.com/scientificreports/
PI = Ci /Si (2)
−1
where Ci is the concentration of element i in the soil (mg kg ) and Si is the soil quality standard or reference
value for element i (mg kg−1). The PLI for different elements is calculated via the (Eq. 3):
PLI = (PI1 × PI2 × PI3 × · · · × PIn )1/n (3)
The PLI of soils is classified as follows: PLI < 1 is unpolluted, 1 < PLI < 2 is unpolluted to moderately polluted,
2 < PLI < 3 is moderately polluted, 3 < PLI < 4 is moderately to highly polluted, 4 < PLI < 5 is highly polluted, and
PLI > 5 is very highly polluted.
Plant EF is calculated as (Eq. 4):
EFplant = Cplant / Ccontrol (4)
−1
where Cplant and C control are element concentrations (mg kg ) in tree leaves at the polluted site and the control
site, respectively. A value of EF > 2 indicates that a tree is enriched with the specific element41.
BCF, which indicates the ability of plants to accumulate different elements from the soil7,42, is calculated as
(Eq. 5):
BCF = ([C]L /[C]S ) (5)
where [C]L and [ C]S are, respectively, the concentration of different elements in leaf and soil samples. Values of
BCF > 1, BCF < 1, and BCF = 1 imply that the trees are accumulators, excluders, and indicators, respectively, for
different elements39.
AOM, used to determine the number of different elements in leaves originating from ambient air18, are
calculated by the (Eq. 6):
AOM (%) = ((Cunwashed leaves ) − (Cwashed leaves ))/(Cunwashed leaves ) ∗ 100 (6)
where (c) is the concentration of studied element.
Oak tree leaves had different abilities to accumulate atmospheric studied elements. MAI was calculated as
(Eq. 7):
n
MAI = 1/n Ij (7)
j=1
where n is the total number of studied elements, and Ij is the sub-index of variable j, calculated by dividing the
mean concentration (x) of each element by its standard deviation43,44.
Data analysis. Before analysis of variance, the normality of the data distribution was checked by SAS ver-
sion software using Shapiro–Walk and Kolmograph-Smirnov tests. The logarithmic conversion was used to the
normality of the data in Excel. Different properties of soils such as pH and EC for two factors including seasons
in three levels (spring, summer, and autumn) and distance in five levels (1000, 1500, 2000, 2500, and 10,000)
with three replicates were analyzed in a completely randomized design. Analysis of variance was performed
by two-way ANOVA with SAS software and the comparisons of means were conducted with Duncan’s test at
p < 0.05. The differences among the distance and season factors were studied using a resemblance matrix for
the different elements (S, Cr, Cu, Mn, Ni, Pb, As, and Zn). The resemblance is the general term in the PRIMER
software used to cover (dis)similarity or distance coefficients between all pairs of the samples.
Following this, elements matrices were log x + 1 transformed, and the resemblance matrix was built using the
Euclidean distance. Elements were analysed using nonmetric multidimensional scaling (NMDS) and the Kruskal
stress formula (minimum stress: 0.01) for visualizing the level of similarity. Statistical analyses were conducted
using PRIMER 6 s oftware45,46.
Data availability
The data used to support the findings of this study are available from the corresponding author upon reasonable
request.
Received: 18 October 2021; Accepted: 14 December 2021
References
1. Usman, K., Abu-Dieyeh, M. H., Zouari, N. & Al-Ghouti, M. A. Lead (Pb) bioaccumulation and antioxidative responses in Tetraena
qataranse. Sci. Rep. 10, 1–10 (2020).
2. Seyyednejad, S., Niknejad, M. & Koochak, H. A review of some different effects of air pollution on plants. Res. J. Environ. Sci. 5,
302–309 (2011).
3. Nayak, R., Biswal, D. & Sett, R. Biochemical changes in some deciduous tree species around Talcher thermal power station, Odisha,
India. J. Environ. Biol. 34, 521–528 (2013).
4. Al-Jahdali, M. & Bisher, A. B. Sulfur dioxide (SO2) accumulation in soil and plant’s leaves around an oil refinery: A case study from
Saudi Arabia. Am. J. Environ Sci. 4, 84–88 (2008).
5. Baldantoni, D., De Nicola, F. & Alfani, A. Air biomonitoring of heavy metals and polycyclic aromatic hydrocarbons near a cement
plant. Atmos. Pollut. Res. 5, 262–269 (2014).
Scientific Reports | (2022) 12:284 | https://doi.org/10.1038/s41598-021-04429-8 9
Vol.:(0123456789)www.nature.com/scientificreports/
6. Odabasi, M. et al. Investigation of spatial and historical variations of air pollution around an industrial region using trace and
macro elements in tree components. Sci. Total Environ. 550, 1010–1021 (2016).
7. Alahabadi, A. et al. A comparative study on capability of different tree species in accumulating heavy metals from soil and ambient
air. Chemosphere 172, 459–467 (2017).
8. Schaubroeck, T., Staelens, J., Verheyen, K., Muys, B. & Dewulf, J. Improved ecological network analysis for environmental sustain-
ability assessment; a case study on a forest ecosystem. Ecol. Model. 247, 144–156 (2012).
9. Lin, W. et al. Assessment of trace metal contamination and ecological risk in the forest ecosystem of dexing mining area in northeast
Jiangxi Province, China. Ecotoxicol. Environ. Saf. 167, 76–82 (2019).
10. Shen, Q., Wu, M. & Zhang, M. Accumulation and relationship of metals in different soil aggregate fractions along soil profiles. J.
Environ. Sci. 115, 47–54 (2022).
11. Ahmad, W. et al. Toxic and heavy metals contamination assessment in soil and water to evaluate human health risk. Sci. Rep. 11,
1–12 (2021).
12. Norouzi, S., Khademi, H., Cano, A. F. & Acosta, J. A. Biomagnetic monitoring of heavy metals contamination in deposited atmos-
pheric dust, a case study from Isfahan, Iran. J. Environ. Manag. 173, 55–64 (2016).
13. Mutia, T. M., Fridriksson, T. & Jónsdóttir, I. S. Concentrations of sulphur and trace elements in semi-arid soils and plants in rela-
tion to geothermal power plants at Olkaria, Kenya. Geothermics 61, 149–159 (2016).
14. Mazurek, R. et al. Assessment of heavy metals contamination in surface layers of Roztocze National Park forest soils (SE Poland)
by indices of pollution. Chemosphere 168, 839–850 (2017).
15. Kabata-Pendias, A. Trace Elements in Soils and Plants 4th edn, Vol. 505 (CRC Taylor and Francis Group, 2011).
16. Turtscher, S., Berger, P., Lindebner, L. & Berger, T. W. Declining atmospheric deposition of heavy metals over the last three decades
is reflected in soil and foliage of 97 beech (Fagus sylvatica) stands in the Vienna Woods. Environ. Pollut. 230, 561–573 (2017).
17. Koptsik, S. et al. Heavy metals in soils near the nickel smelter: Chemistry, spatial variation, and impacts on plant diversity. J.
Environ. Monit. 5, 441–450 (2003).
18. Safari, M. et al. Potential of trees leaf/bark to control atmospheric metals in a gas and petrochemical zone. J. Environ. Manag. 222,
12–20 (2018).
19. Cicek, A. & Koparal, A. Accumulation of sulfur and heavy metals in soil and tree leaves sampled from the surroundings of Tuncbilek
Thermal Power Plant. Chemosphere 57, 1031–1036 (2004).
20. Alloway, B. J. Heavy Metals in Soils: Trace Metals and Metalloids in Soils and their Bioavailability Vol. 22 (Springer Science & Busi-
ness Media, 2012).
21. Soba, D. et al. Foliar heavy metals and stable isotope (δ13C, δ15N) profiles as reliable urban pollution biomonitoring tools. Urban
For. Urban Green. 57, 126918 (2021).
22. Hahn, J. et al. Catchment soils as a factor of trace metal accumulation in sediments of the reservoir Klingenberg (eastern Ore
Mountains, Germany). J. Environ. Sci. 86, 1–14 (2019).
23. Solgi, E., Keramaty, M. & Solgi, M. Biomonitoring of airborne Cu, Pb, and Zn in an urban area employing a broad leaved and a
conifer tree species. J. Geochem. Explor. 208, 106400 (2020).
24. Keshavarzi, B., Najmeddin, A., Moore, F. & Moghaddam, P. A. Risk-based assessment of soil pollution by potentially toxic elements
in the industrialized urban and peri-urban areas of Ahvaz metropolis, southwest of Iran. Ecotoxicol. Environ. Saf. 167, 365–375
(2019).
25. Kabata-Pendias, A. Trace Elements in Soils and Plants (CRC Press, 2010).
26. Serbula, S. M., Miljkovic, D. D., Kovacevic, R. M. & Ilic, A. A. Assessment of airborne heavy metal pollution using plant parts and
topsoil. Ecotoxicol. Environ. Saf. 76, 209–214 (2012).
27. Kravitz, B., Robock, A., Oman, L., Stenchikov, G. & Marquardt, A. B. Sulfuric acid deposition from stratospheric geoengineering
with sulfate aerosols. J. Geophys. Res. Atmos. 114, 1–7 (2009).
28. Kabata-Pendias, A. & Pendias, H. Trace Elements in Soils and Plants 3rd edn. (CRC Press, 2001).
29. Padmavathiamma, P. K. & Li, L. Y. Phytoremediation technology: Hyper-accumulation metals in plants. Water Air Soil Pollut. 184,
105–126 (2007).
30. Qing, X., Yutong, Z. & Shenggao, L. Assessment of heavy metal pollution and human health risk in urban soils of steel industrial
city (Anshan), Liaoning, Northeast China. Ecotoxicol. Environ. Saf. 120, 377–385 (2015).
31. El-Khatib, A. A., Barakat, N. A., Youssef, N. A. & Samir, N. A. Bioaccumulation of heavy metals air pollutants by urban trees. Int.
J. Phytorem. 22, 210–222 (2020).
32. Alatou, H. & Sahli, L. Using tree leaves and barks collected from contaminated and uncontaminated areas as indicators of air
metallic pollution. Int. J. Phytorem. 21, 985–997 (2019).
33. Liu, W. et al. Variability in plant trace element uptake across different crops, soil contamination levels and soil properties in the
Xinjiang Uygur Autonomous Region of northwest China. Sci. Rep. 11, 1–13 (2021).
34. Aghdash, H. D. et al. Acorn germination and oak (Quercus brantii Lindl.) seedling development dramatically affected by spatial
position of maternal trees from Ilam gas refinery, Iran. Ecol. Eng. 170, 106329 (2021).
35. Ghahraman, A. Colorful flora of Iran. The Research Institute of Forest and Pastures, Tehran. Implication to biodiversity conserva-
tion. SINET Ethiop. J. Sci. 30, 1–12 (1979).
36. Estefan, G., Sommer, R. & Ryan, J. Methods of soil, plant, and water analysis. Manual West Asia North Afr. Region 3, 65–119 (2013).
37. Palmer, R. G. & Troeh, F. R. Introductory Soil Science Laboratory Manual (1977).
38. Da Silva, Y. J. A. B., do Nascimento, C. W. A., Cantalice, J. R. B., da Silva, Y. J. A. B. & Cruz, C. M. C. A. Watershed-scale assessment
of background concentrations and guidance values for heavy metals in soils from a semiarid and coastal zone of Brazil. Environ.
Monit. Assess. 187, 1–10 (2015).
39. Liang, J., Fang, H., Zhang, T., Wang, X. & Liu, Y. Heavy metal in leaves of twelve plant species from seven different areas in Shanghai,
China. Urban For. Urban Green. 27, 390–398 (2017).
40. Solgi, E., Esmaili-Sari, A., Riyahi-Bakhtiari, A. & Hadipour, M. Soil contamination of metals in the three industrial estates, Arak,
Iran. Bull. Environ. Contam. Toxicol. 88, 634–638 (2012).
41. Mingorance, M., Valdes, B. & Oliva, S. R. Strategies of heavy metal uptake by plants growing under industrial emissions. Environ.
Int. 33, 514–520 (2007).
42. Shi, X. et al. Seedling growth and metal accumulation of selected woody species in copper and lead/zinc mine tailings. J. Environ.
Sci. 23, 266–274 (2011).
43. Liu, Y.-J., Zhu, Y.-G. & Ding, H. Lead and cadmium in leaves of deciduous trees in Beijing, China: Development of a metal accu-
mulation index (MAI). Environ. Pollut. 145, 387–390 (2007).
44. Hu, Y., Wang, D., Wei, L., Zhang, X. & Song, B. Bioaccumulation of heavy metals in plant leaves from Yan’ an city of the Loess
Plateau, China. Ecotoxicol. Environ. Saf. 110, 82–88 (2014).
45. Anderson, R. E., Sogin, M. L. & Baross, J. A. Biogeography and ecology of the rare and abundant microbial lineages in deep-sea
hydrothermal vents. FEMS Microbiol. Ecol. 91, 1–11 (2015).
46. Clarke, K. & Gorley, R. Getting started with PRIMER v7. PRIMER-E: Plymouth, Plymouth Marine Laboratory Vol. 20 (2015).
Scientific Reports | (2022) 12:284 | https://doi.org/10.1038/s41598-021-04429-8 10
Vol:.(1234567890)www.nature.com/scientificreports/
Acknowledgements
This research was financially supported by Tarbiat Modares University. Grant Number 81816.
Author contributions
H.D., H.Z. and M.H. conceived of the presented idea. H.D. carried out field and experimental studies, analyzed
data, wrote the manuscript. H.D. and H.Z. acquired funding, manuscript structuring, and improvement. H.Z. and
M.H. contributed to data interpretation. M.S. advisor to investigate the contamination of trace elements in soils
and trees. M.L and R.N. contributed to the final version of the manuscript. All authors reviewed the manuscript.
Competing interests
The authors declare no competing interests.
Additional information
Correspondence and requests for materials should be addressed to H.Z.-M.
Reprints and permissions information is available at www.nature.com/reprints.
Publisher’s note Springer Nature remains neutral with regard to jurisdictional claims in published maps and
institutional affiliations.
Open Access This article is licensed under a Creative Commons Attribution 4.0 International
License, which permits use, sharing, adaptation, distribution and reproduction in any medium or
format, as long as you give appropriate credit to the original author(s) and the source, provide a link to the
Creative Commons licence, and indicate if changes were made. The images or other third party material in this
article are included in the article’s Creative Commons licence, unless indicated otherwise in a credit line to the
material. If material is not included in the article’s Creative Commons licence and your intended use is not
permitted by statutory regulation or exceeds the permitted use, you will need to obtain permission directly from
the copyright holder. To view a copy of this licence, visit http://creativecommons.org/licenses/by/4.0/.
© The Author(s) 2022
Scientific Reports | (2022) 12:284 | https://doi.org/10.1038/s41598-021-04429-8 11
Vol.:(0123456789)You can also read