Advanced Monte Carlo simulations of emission tomography imaging systems with GATE
←
→
Page content transcription
If your browser does not render page correctly, please read the page content below
Physics in Medicine & Biology

TOPICAL REVIEW • OPEN ACCESS

Advanced Monte Carlo simulations of emission tomography imaging
systems with GATE
To cite this article: David Sarrut et al 2021 Phys. Med. Biol. 66 10TR03

View the article online for updates and enhancements.

                             This content was downloaded from IP address 157.193.240.105 on 03/08/2021 at 16:01
Phys. Med. Biol. 66 (2021) 10TR03                                                         https://doi.org/10.1088/1361-6560/abf276

                              TOPICAL REVIEW

                              Advanced Monte Carlo simulations of emission tomography imaging
OPEN ACCESS
                              systems with GATE
RECEIVED
9 December 2020
                              David Sarrut1,∗ , Mateusz Bała2, Manuel Bardiès3, Julien Bert4, Maxime Chauvin5 ,
REVISED
3 March 2021
                              Konstantinos Chatzipapas6 , Mathieu Dupont7 , Ane Etxebeste1 , Louise M Fanchon8, Sébastien Jan9,
                              Gunjan Kayal5,10, Assen S Kirov8 , Paweł Kowalski11 , Wojciech Krzemien11, Joey Labour1 ,
ACCEPTED FOR PUBLICATION
26 March 2021                 Mirjam Lenz12,13, George Loudos6, Brahim Mehadji7, Laurent Ménard14,15, Christian Morel7 ,
PUBLISHED
                              Panagiotis Papadimitroulas6 , Magdalena Rafecas16, Julien Salvadori17, Daniel Seiter18,
14 May 2021                   Mariele Stockhoff19 , Etienne Testa20, Carlotta Trigila21 , Uwe Pietrzyk13, Stefaan Vandenberghe19,
                              Marc-Antoine Verdier14,15, Dimitris Visvikis4, Karl Ziemons12 , Milan Zvolský16 and Emilie Roncali21
Original content from this    1
                                   Université de Lyon, CREATIS, CNRS UMR5220, Inserm U1294, INSA-Lyon, Université Lyon 1, Lyon, France
work may be used under        2
the terms of the Creative
                                   Jagiellonian University, Kraków, Poland
                              3
Commons Attribution 4.0            Cancer Research Institute of Montpellier, U1194 INSERM/ICM/Montpellier University, 208 Av des Apothicaires, F-34298 Montpellier
licence.                           cedex 5, France
                              4
Any further distribution of        LaTIM, INSERM UMR 1101, IBRBS, Faculty of Medicine, Univ Brest, 22 avenue Camille Desmoulins, F-29238, Brest, France
                              5
this work must maintain            CRCT, UMR 1037, INSERM, Université Toulouse III Paul Sabatier, Toulouse, France
attribution to the            6
                                   Bioemission Technology Solutions (BIOEMTECH), Alexandras Av. 116, Athens, Greece
author(s) and the title of    7
the work, journal citation         Aix-Marseille Univ, CNRS/IN2P3, CPPM, Marseille, France
                              8
and DOI.                           Department of Medical Physics, Memorial Sloan Kettering Cancer Center, New York, NY, 10065, United States of America
                              9
                                   Université Paris-Saclay, CEA, CNRS, Inserm, BioMaps, Service Hospitalier Frédéric Joliot, F-91401, Orsay, France
                              10
                                   SCK CEN, Belgian Nuclear Research Centre, Boeretang 200, Mol 2400, Belgium
                              11
                                   High Energy Physics Division, National Centre for Nuclear Research, Otwock-Świerk, Poland
                              12
                                   FH Aachen University of Applied Sciences, Forschungszentrum Jü lich, Jü lich, Germany
                              13
                                   Faculty of Mathematics and Natural Sciences, University of Wuppertal, Wuppertal, Germany
                              14
                                   Université Paris-Saclay, CNRS/IN2P3, IJCLab, F-91405 Orsay, France
                              15
                                   Université de Paris, IJCLab, F-91405 Orsay France
                              16
                                   Institute of Medical Engineering, University of Lübeck, Lübeck, Germany
                              17
                                   Department of Nuclear Medicine and Nancyclotep molecular imaging platform, CHRU-Nancy, Université de Lorraine, F-54000, Nancy,
                                   France
                              18
                                   Department of Medical Physics, University of Wisconsin-Madison School of Medicine and Public Health, Madison, WI, 53705, United
                                   States of America
                              19
                                   Medical Image and Signal Processing (MEDISIP), Ghent University, Ghent, Belgium
                              20
                                   Univ. Lyon, Univ. Claude Bernard Lyon 1, CNRS/IN2P3, IP2I Lyon, F-69622, Villeurbanne, France
                              21
                                   Department of Biomedical Engineering, University of California, Davis, CA 95616 United States of America
                              ∗
                                   Author to whom any correspondence should be addressed.
                              E-mail: david.sarrut@creatis.insa-lyon.fr

                              Keywords: Monte Carlo simulation, Positron emission tomography, Single-photon emission computed tomography, Compton Camera

                              Abstract
                              Built on top of the Geant4 toolkit, GATE is collaboratively developed for more than 15 years to design
                              Monte Carlo simulations of nuclear-based imaging systems. It is, in particular, used by researchers
                              and industrials to design, optimize, understand and create innovative emission tomography systems.
                              In this paper, we reviewed the recent developments that have been proposed to simulate modern
                              detectors and provide a comprehensive report on imaging systems that have been simulated and
                              evaluated in GATE. Additionally, some methodological developments that are not specific for imaging
                              but that can improve detector modeling and provide computation time gains, such as Variance
                              Reduction Techniques and Artificial Intelligence integration, are described and discussed.

                              1. Introduction

                              GATE is an open-source, community-based software effort relying on the Geant4 toolkit (Allison et al 2016)
                              dedicated to Monte Carlo simulation in medical physics. GATE is about 15 years old and evolves a lot through

                              © 2021 Institute of Physics and Engineering in Medicine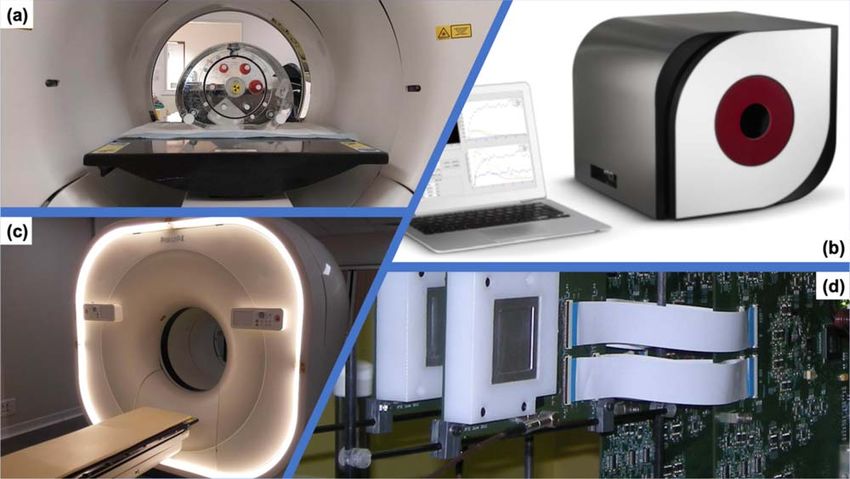
Phys. Med. Biol. 66 (2021) 10TR03                                                                             D Sarrut et al

users’ contributions. It was initially focused on nuclear imaging (Santin et al 2003, Strul et al 2003, Jan et al 2004,
Buvat and Lazaro 2006), then expanded to external and internal radiotherapy (Jan et al 2011), dosimetry (Sarrut
et al 2014) and hadrontherapy (Grevillot et al 2020). The simulated physics is managed by the Geant4 Monte
Carlo kernel in charge of tracking particles in matter and processing physical interactions. On top of Geant4,
GATE gathers multiple developments that facilitate medical physics simulations. Indeed, numerous clinical,
preclinical, and prototype positron emission tomography (PET) and single photon emission compute
tomography scanners were simulated and confronted with experimental data.
     Since the initial 2004 OpenGATE collaboration article, emission tomography systems have changed
dramatically (Vandenberghe et al 2020) with improved time-of-flight (TOF) methods, better detection systems
based on silicon photomultipliers (SiPMs), long axial field of views (FOVs), multi-headed systems, etc. At the
same time, Monte Carlo simulation also had to evolve to support those developments. This type of simulation
remains the gold standard for design, optimization and assessment of imaging systems, and serves to estimate
their performance, to optimize acquisition parameters, and to design reconstruction algorithms.
     Since then, no synthesis of emission tomography (SPECT, PET, Compton Camera) capabilities of GATE has
been published. The goal of this paper is to review the current GATE capabilities and limitations for simulating
emission tomography imaging systems. The article is organized in the following way: section 2 describes the
recent developments for detector simulations, section 3 gives more details about validated simulated imaging
systems, and finally section 4 reports on additional developments not specific to emission tomography yet
helpful to the field.

2. Detector developments

In the following, we describe the main modules recently developed or updated for simulation of modern
emission tomography systems. The first subsection summarizes the two main modes of simulation, then, we
describe optical photon tracking, Cerenkov-based TOF and Compton camera modules (CCMod).

2.1. Principal simulation modes
In nuclear imaging, events are usually detected by collecting scintillation photons emitted after energy
deposition of high-energy gamma photons in inorganic crystals (LYSO22, LSO23, BGO24, etc) using
photodetectors such as photomultiplier tubes (PMT), avalanche photodiodes (APDs) or SiPMs (Roncali and
Cherry 2011). There are two modes that can be used in GATE to simulate this detection stage.
     The first mode consists in full Monte Carlo tracking of the emitted optical photons. In such simulations,
precise definition of the crystal optical surfaces is crucial to obtain a realistic light distribution. While it is useful
to design and to better understand the in-depth behavior of a given detection system, simulating all optical
photons leads to long computation times due to the very large number of tracked particles (Cherry et al 2012).
This first mode will be presented in section 2.2.
     In the second simulation mode in GATE, the response of the photodetection components is simulated by a
specific module called a digitizer. In that case, an analytical model is used to generate detection events from the
list of interaction events within the crystal, assuming the number of generated digital pulses is proportional to
the number of scintillation photons in the crystal. This digitizer converts photon interactions in the crystal into
digital counts and assigns time stamps to every event. Numerous parameters are provided to the user who can
apply successive signal processing operations to generate a final response adapted to the hardware: pixelated or
monolithic scintillator detectors, depth-of-interaction (DoI) modeling, dead time, etc. Moreover, various
stochastic uncertainties can be added to reproduce the intrinsic resolution of components such as the intrinsic
radioactivity of 176Lu in LSO (McIntosh et al 2011), or the intrinsic resolution of a particular scintillator (Jan et al
 2004).
     A specific vocabulary is used: hits, singles, coincidences. Individual particle interactions within a detector
element (e.g. crystal) are called hits, each hit containing information about the interaction process type, the
position, deposited energy, time, the volume where the interaction occurs, etc. The hits within the same readout
volume are gathered into singles. Singles are sorted by time-stamp and associated in coincidences according to
several rules, in particular to handle coincidence windows during which more than two singles are detected. In
PET imaging, it is common to consider several types of coincidences: the scatters (coincidence events resulting
from scattered photons inside the subject), the randoms (accidental coincidences), the trues (real, expected
coincidences). The sum of those three types are called the prompts (total detected coincidences). In reality, the
22
     Lutetium–yttrium oxyorthosilicate.
23
     Lutetium oxyorthosilicate.
24
     Bismuth germanium oxide.

                                                 2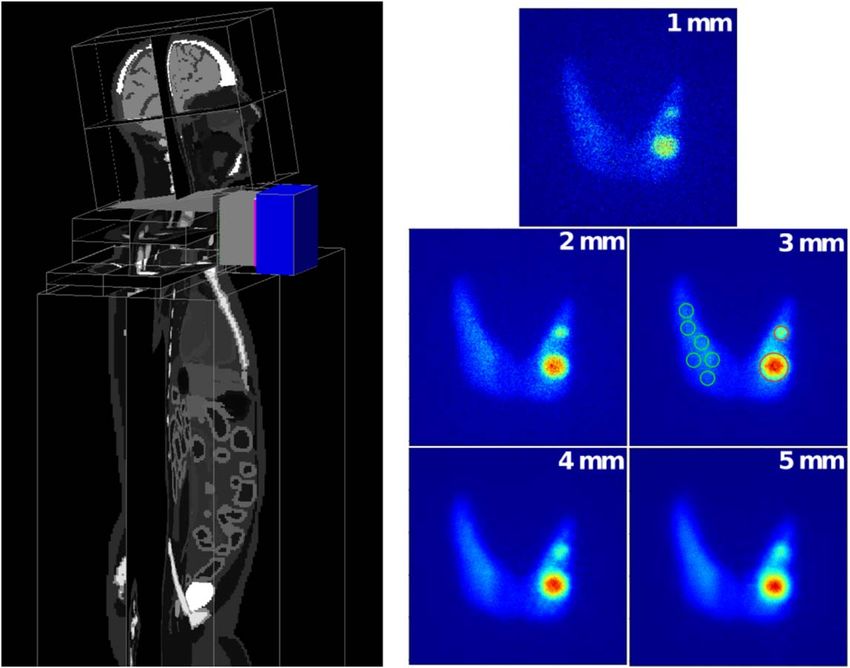
Phys. Med. Biol. 66 (2021) 10TR03                                                                                            D Sarrut et al

   Figure 1. Optical simulations of a calibration setup for monolithic scintillators. A 50 × 50 × 16 mm3 LYSO crystal was modeled read
   out by a pixelated array of photo-detectors. The scintillator surfaces are defined by the LUT Davis reflection model based on measured
   data. The calibration beam is encapsulated in a tungsten collimator which is simulated by importing the 3D STL file into GATE. The
   source is a monoenergetic 511 keV gamma point source.

number of randoms is not known from experimental data and is estimated by the delay coincidences obtained
from delayed time coincidence windows (Strydhorst and Buvat 2016a). GATE generates all types of coincidences
for detailed analysis.
    The digitizers processes are common to PET, SPECT and CCMods and may be used either ‘online’, during
the Monte Carlo particle tracking, or ‘offline’, after the end of the simulation. In this latter case, the simulation
output requires hits, singles, and/or coincidences data to be saved in root (or Python) files that can be post-
processed. More details can be found in Strydhorst and Buvat (2016a), Etxebeste et al (2020).

2.2. Optical photon tracking and SiPM
The precise definition of crystal optical surfaces can be modeled with the Davis look-up table (LUT) surface
reflection model, introduced in GATE since version 8.0 (Stockhoff 2017). This model is based on measured
surface data obtained by atomic force microscopy. Users can choose between two surfaces, a polished and a
rough one. For each surface, four LUTs are available: LSO crystal with no reflector, coupled to Teflon through an
air interface, ESR-air and ESR-grease. The models consider optical photon reflection probabilities and
directions depending on the incidence angle of the photon on the crystal surface. The models were validated
against experimental data. Next step towards finer detector modeling lies in the use of completely customized
LUTs. For this reason, a standalone user interface has been developed to allow users to generate LUTs for any
surface obtained with a 3D scanning method with a sub-micron resolution with the personalized definition of
the intrinsic properties of the scintillator and the coupling medium and a specific reflector attached to the
crystal, Trigila et al (2021). The LUTDavis model has been validated for several configurations by comparing the
experimental and simulated light output of single crystals, with an error of less than 10% (Roncali and
Cherry 2013).
     With the LUTDavis model, a large monolithic scintillation detector for clinical PET systems was simulated
using optical photon tracking. The detector consisted of 50 × 50 × 16 mm3 LYSO coupled with optical grease
to an array of SiPMs (see figure 1). The gamma entrance face was defined with the polished ESR LUT. The crystal
sides were defined with an adapted LUT modeling a rough surface with black paint leading to absorption of
photons transmitted by the crystal surface. The SiPM readout side was simulated by LUTs that model polished
surfaces and take into account the index of refraction of optical grease. Optical simulations were used to
optimize the performance of the detector by testing various setups and their influence on the desired
performance parameter. It was thus possible to gain insight into physical processes that are difficult or
impossible to measure experimentally, notably ground-truth interaction positions, especially DoI. Each
influencing factor can be analyzed separately as for example the influence of Compton scattered events, the
influence of intrinsic 176Lu radiation of the scintillator, the influence of test-equipment, e.g. collimators or
housing.
     In Stockhoff et al (2019), the focus was set on the spatial resolution influenced by the size of the
photodetector pixels, the photon detection efficiency (PDE) and the number of channels used to read out the
sensor array. The outcome of this simulation study demonstrated the high spatial resolution of 0.4–0.66 mm full
width at half maximum (FWHM) that can be obtained by a monolithic detector under idealized configurations.
High PDE and small pixel sizes improved the resolution, while the number of electronic readout channels could
be decreased drastically by summing rows and columns with only a small or no degradation on the spatial
resolution. In Decuyper et al (2019, 2021) the performance of the detector could further be improved by using

                                                        3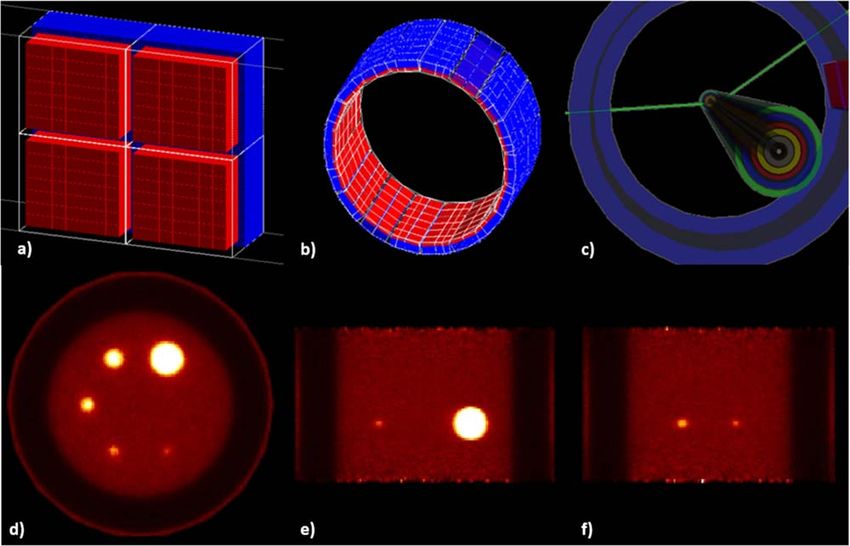
Phys. Med. Biol. 66 (2021) 10TR03                                                                        D Sarrut et al

artificial neural networks (ANNs) to train the positioning algorithm. The simulation was used to identify and
address potential pitfalls related to ANNs which could then be translated to the experimental results. @Mariele
do you have any validation numbers to add? The simulation of single detector modules does not only require a
dedicated surface modeling, but also has to account for the detection of scintillation photons and the subsequent
pulse processing inside the photodetector. The increasing use of SiPMs (see section 2) in the context of PET
imaging (Lewellen 2008, Cabello and Ziegler 2018, Conti and Bendriem 2019) motivated the implementation of
specific digitizer modules for analog and digital SiPMs (dSiPMs), so that both the complete scanner system and
the single detector modules can be simulated.
     First, a digitizer module for analog SiPMs (aSiPMs) was implemented, allowing to reproduce signals
originating from aSiPMs. For each optical photon impinging onto the surface of detection, a pulse has a non-
null probability to be generated at a time t + Δt considering the PDE, where t corresponds to the time of the
detection and Δt accounts for the single photon time resolution. The digitizer also takes into account aSiPM
saturation and various sources of noise such as dark counts, crosstalks, afterpulses, after-crosstalks and signal
white noise (Mehadji 2020).
     A second digitizer module was implemented for dSiPMs, referring to the Philips digital photon counter
(DPC). A DPC sensor tile is subdivided into 16 so-called dies, which comprise four pixels each and are read out
independently. In contrast to aSiPMs, this device stores the number of counted photons on the four pixels of a
die and a die timestamp for each event. It therefore delivers a completely digital signal. Furthermore, it makes
use of a trigger and validation logic in order to reduce the recording of dark counts (Degenhardt et al 2009, Frach
et al 2009). This dedicated digitizer currently allows for consideration of the most relevant noise sources (dark
noise and optical crosstalk), the PDE of the sensor, and the specific trigger and validation logic. For validation of
the model, the probabilities for trigger and validation, determined by Tabacchini et al (2014), have been
successfully reproduced (Lenz 2020).

2.3. Cerenkov-based TOF
The use of ultra-fast (10 ps) Cerenkov emission for TOF PET detectors has been investigated extensively as an
alternative to traditional time triggering on scintillation photons emitted within tens to hundreds of ns
(Lecoq 2012, Somlai-Schweiger and Ziegler 2015, Brunner and Schaart 2017, Kwon et al 2016, Cates et al 2018).
The potential of Cerenkov light has become the foundation of a paradigm shift in TOF PET, with initiatives such
as the 10 ps TOF challenge (Lecoq 2017, Schaart et al 2020, Lecoq et al 2020). The very low number of Cerenkov
photons produced by each gamma interaction in the Cerenkov radiator (around 15–20 per photoelectric
interaction for BGO) is the main limitation in fully exploiting these photons and warrants thorough studies to
better understand their production, transport, collection and conversion into an electric signal. This can only be
achieved through detailed simulation, as it is not possible to separate these components experimentally.
    GATE has been increasingly used to study Cerenkov emission for its ability to model all aspects of the optical
detection chain including the effect of optical surfaces. However, it requires modifications to tag the Cerenkov
photons in the hits tree and associate them to their parent gamma event (Ariño-Estrada et al 2020, Kwon et al
2019, Roncali and Kwon 2019) and does not include tools for a complete optical analysis. Studies have been
reported in two materials: the well-known scintillator BGO, and the novel semi-conductors thallium bromide
(TlBr) and thallium chloride (TlCl). In BGO, GATE simulations of the Cerenkov production and transport in
the crystal described the direction of the initial Cerenkov photons, as well as the contribution of Cerenkov
photons to the detector timing resolution. These simulation studies, in excellent agreement with experimental
results, provided a new explanation of the long tails in the timing spectrum observed experimentally in BGO by
several groups. GATE simulations in a dual-ended readout BGO detector also elucidated the nature of the time
difference between the two crystal ends by identifying the type of photon first detected by the photodetector
(Cerenkov or scintillation). In TlBr and TlCl, GATE simulations were used to generate and track Cerenkov
photons from the emission point to the photodetector (Ariño-Estrada et al 2020). The number of photons
produced and detected per photoelectric interaction was estimated from the simulations, indicating the
potential of TlCl as a Cerenkov radiator thanks to its optical properties. Using the simulated photon time
stamps, the timing spectrum for different trigger thresholds was computed and confirmed the advantage of
TlCl. Good agreement was obtained between simulations and experiments, with an overestimation of the
number of detected photons of 12% (Ariño-Estrada et al 2020).

2.4. Compton camera modules
The recent GATE CCMod (Etxebeste et al 2020) provides a framework where different Compton camera
configurations can be simulated and facilitates comparison between the performance of different prototypes in
medical experimental settings such as hadron therapy monitoring or nuclear medicine. CCMod is designed to
reproduce the response of most common configurations in medical applications composed of a scatterer and an

                                               4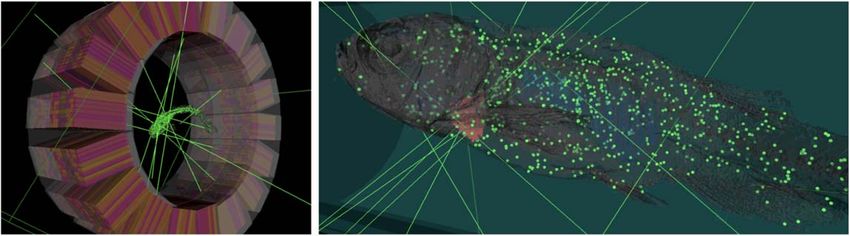
Phys. Med. Biol. 66 (2021) 10TR03                                                                       D Sarrut et al

absorber detectors working in time coincidence (Everett et al 1977). However, it can be adapted to accommodate
other designs such as one single detector layer system that acts as scatterer and absorber at the same time (Lehner
et al 2004, Mihailescu et al 2007, Maier et al 2018, Montémont et al 2017) frequently employed in homeland
security applications.
     In CCMod, volumes defined as detector layers act as Geant4 sensitive detectors. The detector response (the
list of singles) is simulated by applying sequentially a chain of digitizer modules to the stored information of
particle interactions. The same data structure in SPECT or PET systems is employed so that digitizer modules
may be applied interchangeably to all three types of imaging devices. Since in Compton cameras different
detector layers have usually different roles and characteristics, digitizer modules that can be applied
independently to each detector layer have been included. Singles are sorted into coincidences using the sorter
developed for PET systems (Strydhorst and Buvat 2016a). Additional options have been included for CCMod
such as allowing only singles in a specific detector layer (absorber) to open its own time coincidence window.
Besides, different criteria for coincidence acceptance are available such as requiring at least one single in each
detector type. Since, in a Compton camera system, the order of the singles within each coincidence determines
the estimated cone surface where the source is located, a dedicated coincidence processor has been included for
coincidence sequence reconstruction. At each step of this processing, from interactions to cone information,
corresponding data output is available. This recent extension of GATE (Etxebeste et al 2020) has been
successfully validated against experimental data and employed to predict the performance of prototypes under
construction (see section 3).

3. Simulation of imaging systems and applications

This section reviews the emission tomography imaging systems that were simulated and, at least partially,
validated against experimental data in GATE. In addition to detector development, and since the very first
version, GATE has been used to simulate complete clinical and preclinical imaging systems. Efforts have been
made to provide comparison against experimental data and improve the simulation when discrepancies have
been found. The tables 1 and 2 list some studies and the associated clinical and preclinical imaging systems (some
are illustrated figure 2). Most systems were PET scanners and, to a lesser extend, SPECT devices. CCMod in
GATE is very recent (Etxebeste et al 2020) and only one validation against experimental data has been reported to
date. Most of the evaluation methodologies were based on NEMA protocols and compared noise equivalent
count rate (NECR), sensitivity, resolution, etc between simulated and experimental data. In the following we
described some more recent studies, focusing on recent developments such as the use of SiPMs or TOF.
     Philips Vereos Digital PET/CT. In Salvadori (2020), a detailed model of the VereosTM DPC-PET was
proposed. This PET device, introduced in 2013, is one of the first PET/CT using SiPM detectors, together with,
the GE DicoveryTM MI PET/CT in 2016 and the Siemens Biograph VisionTM in 2018. On such systems, the
location of β+ annihilation is improved by the use of increase TOF resolution due to the use of SiPMs (210–378
ps). Moreover, the DPC system provides 1:1 coupling between the crystal array and the SiPM array, contributing
to decrease uncertainty in the interaction position and to improve the image resolution.
     The GATE model of the Vereos described the hierarchical structure of all the detection modules, for a total of
23 040 LYSO scintillator crystals (4 × 4 × 19 mm3). The complete digitization chain was simulated including
background noise (natural radioactivity of 176Lu in the crystals), dead time and pile-up, temporal resolution and
detector quantum efficiency. The model has been evaluated following NEMA NU 2-2018 guidelines, including
NECR, scatter fraction, TOF and energy resolution, sensitivity and spatial resolution. The authors reported very
good agreement between experiments and simulations for clinical activity concentrations, with differences at
maximum lower than 10%, concluding that the proposed GATE model can be used to very accurately reproduce
PET images from Vereos system.
     PET2020 long axial FOV PET. In Abi Akl et al (2019), Vandenberghe et al (2017) a long axial FOV PET
scanner was simulated in GATE. Each ring consists of 36 detector modules made up of 50 × 50 × 16 mm3
monolithic LYSO crystals. The system has an inner diameter of 65 cm. GATE was used to study the effect and
advantage of axial lengths between standard 20 cm, 1 m and 2 m long systems, covering the whole human body
versus a coverage of only head-to-hip. A 104 cm long system was 16 times more sensitive than a system with
20 cm axial length (1 m long uniform phantom). The effect of axial splitting of the detector rings to increase the
FOV was also studied, in turn for sensitivity as well as an adaptive system bore that allows a sensitivity gain and
advantages in spatial resolution due to the reduced acolinearity effect. The study showed that for objects shorter
than 1 m the sensitivity gain of a 2 m scanner is limited while the detector cost is doubled compared to the 1 m
system. Axial spreading is possible (at the expense of a loss in sensitivity) and an adaptive system bore can be
realized by the camera aperture principle.

                                              5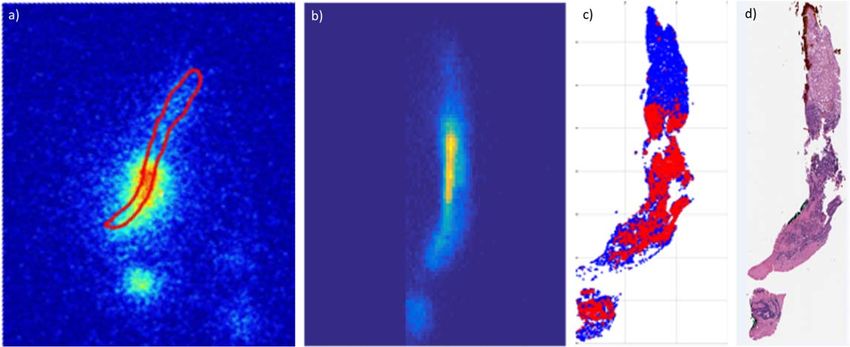
Phys. Med. Biol. 66 (2021) 10TR03                                                                                             D Sarrut et al

Table 1. Bibliography of simulated and evaluated against experimental data PET systems. LYSO: lutetium–yttrium oxyorthosilicate, LSO:
lutetium oxyorthosilicate, BGO: Bismuth germanium oxide. The second column indicates if it is clinical (C) or preclinical (PC, for small
animals) systems.

Bib. ref.                                                   C/PC                    PET system

2004 Assié et al (2004)                                      PC                     ECAT EXACT HR+, BGO, by CPS Innovations
2004 Lazaro et al (2004)                                     PC                     IASA prototype, CsI(Tl)
2004 Bataille et al (2004)                                    C                     ECAT HRRT, LSO, brain
2004 Groiselle et al (2004)                                   C                     prototype, CsI(NaI), by PhotoDetection Systems
2004 Rannou et al (2004)                                     PC                     prototype OPET, LSO/GSO
2005 Chung et al (2005)                                      PC                     prototype LSO and LuYAP
2005 Jan et al (2005)                                         C                     ECAT EXACT HR+, BGO, by CTI
2006 Karakatsanis et al (2006)                                C                     ECAT EXACT HR+ and Biograph 2, by Siemens
2006 Lamare et al (2006)                                      C                     Allegro/Gemini, GSO, by Philips
2006 Visvikis et al (2006)                                   PC                     prototypes, CZT
2006 Michel et al (2006)                                      C                     BioGraph HiRez, LSO, by Siemens
2006 Schmidtlein et al (2006)                                 C                     Advance/Discovery Light Speed, BGO, by GE
2006 Merheb et al (2006)                                     PC                     Mosaic, GO, by Philips
2006 Sakellios et al (2006)                                  PC                     prototype, LSO
2006 Vandenberghe (2006)                                      C                     prototype, Univ. Penn., TOF, LaBr3
2006 Vandenberghe et al (2006a)                               C                     Allegro/Gemini, GSO, by Philips
2007 Gonias et al (2007)                                      C                     Biograph 6, LSO, by Siemens
2007 van der Laan et al (2007)                               PC                     prototype, LSO
2007 Bruyndonckx et al (2007)                                 C                     prototype, LSO
2007 Yang et al (2007)                                       PC                     eXplore Vista, LYSO/GSO, by GE
2007 Vandervoort and Camborde (2007)                         PC                     microPET R4, Focus 120, LSO, by Siemens
2007 Rey (2007)                                              PC                     protoype, Lausanne ClearPET
2009 Rechka et al (2009)                                     PC                     LabPET, LYSO, LGSO, by Sherbrooke
2009 Geramifar et al (2009)                                   C                     Discovery DLS/DST/DSTE/DRX, BGO/LYSO, by GE
2011 McIntosh et al (2011)                                   PC                     Inveon, LSO, by Siemens
2011 Geramifar et al (2011)                                   C                     Discovery RX, LYSO, by GE
2012 Poon et al (2012)                                        C                     Biograph mCT, LSO, by Siemens
2012 Trindade et al (2012)                                    C                     Gemini TF, TruFlight Select, LYSO, by Philips
2013 Lee et al (2013)                                        PC                     Inveon trimodal, LSO, by Siemens
2013 Nikolopoulos et al (2013)                               PC                     Biograph DUO, LSO, by Siemens
2013 Zagni et al (2013)                                      PC                     Argus, LYSO/GSO, DOI, by Sedecal
2013 Solevi et al (2013)                                      C                     prototoype AX-PET, LYSO, SiPM, brain
2015 Moraes et al (2015)                                      C                     Biograph mCT, LSO, by Siemens
2015 Poon et al (2015)                                        C                     Biograph mCT, LSO, by Siemens
2015 Aklan et al (2015)                                       C                     Biograph mMR hybrid, LSO, by Siemens
2015 Monnier et al (2015)                                     C                     Biograph mMR hybrid, LSO, by Siemens
2016 Lu et al (2016)                                         PC                     Inveon, LSO, by Siemens
2016 Etxebeste et al (2016)                                  PC                     prototype, LYSO
2017 Sheikhzadeh et al (2017)                                 C                     NeuroPET, LYSO, SiPM, brain, by PDS
2017 Li et al (2017)                                          C                     Ray-Scan 64, BGO, by ARRAYS MIC
2018 Del Guerra et al (2018)                                  C                     prototype TRIMAGE, LYSO
2018 Kowalski et al (2018)                                    C                     prototype J-PET, plastic
2019 Abi Akl et al (2019)                                     C                     prototype PET2020, LYSO
2019 Kochebina et al (2019)                                   C                     prototype CaLIPSO, TMBi
2020 Emami et al (2020)                                       C                     Dual ring MAMMI breast, LYSO, by Oncovision
2020 Salvadori (2020)                                         C                     Vereos, LYSO, SiPM, Philips

     CaLIPSO brain PET. The CaLIPSO PET scanner (Kochebina et al 2019) is a detector concept dedicated to
human brain studies aiming at providing high detection efficiency with 1 mm3 spatial resolution and
coincidence time resolution (CTR) of about 150 ps. First, the prototype uses a liquid time projection chamber
(see figure 4), where an elementary cell of the PET imager is filled with trimethyl bismuth (TMBi). Electrons and
Cerenkov light are produced in the TMBi by γ interactions. Then, micro-channel plate PMTs (MCP-PMT) are
used to detect the Cerenkov light with an excellent time resolution (85 ps FWHM). The electrons produced
during the γ interactions drift along an electric field and are collected by a pixelated detector of mm2. Ionization
drift time allows to estimate depth of interaction with 1 mm precision (Ramos et al 2016, Canot et al 2017, Yvon
et al 2020). Due to fast Cerenkov light emission, time resolution of CTR close to 150 ps (FWHM) is expected.
This makes possible to use TOF technique to improve signal to noise ratio in final images.

                                                        6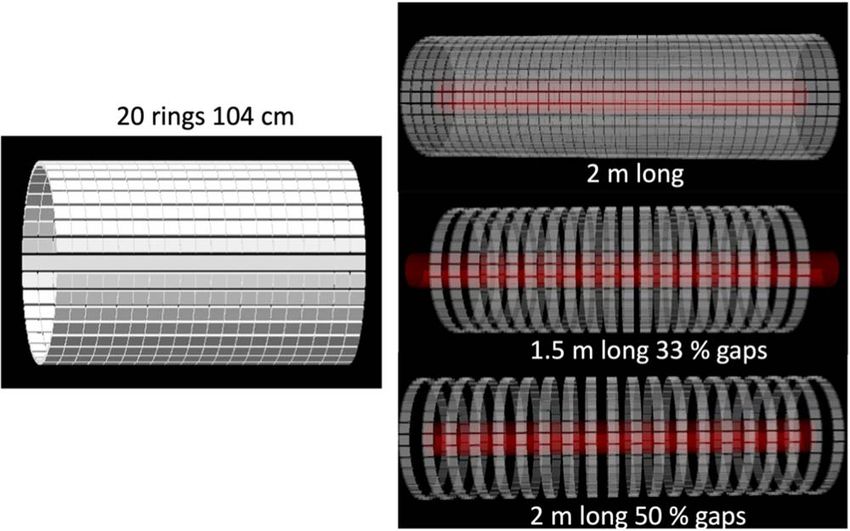
Phys. Med. Biol. 66 (2021) 10TR03                                                                                           D Sarrut et al

   Figure 2. Examples of some simulated imaging systems (clinical, pre-clinical, prototype). (a) NEMA IEC Body Phantom Set ready to
   be imaged on a PET/CT. (b) The Bioemtech γ-eye preclinical device. (c) Philips Vereos Digital PET/CT; (d) MACACO Compton
   Camera prototype with 2 layers of LaBr3 monolithic crystals coupled to SiPMs, developed by IFIC-Valencia. Reproduced with
   permission from Philips France Commercial.

Table 2. Bibliography of simulated and evaluated against experimental data SPECT systems. Collimators types are: low energy all purpose
(LEAR), medium energy general purpose (MEGP), low energy high resolution (LEHR), high energy (HE). The second column indicates if it
is clinical (C) or preclinical (PC, for small animals) systems.

Bib. ref.                                                  C/PC                 SPECT system

2003 Staelens et al (2003)                                   C                  AXIS, LEHR/MEGP, 99mTc, 22Na, 57Co, 67Ga, by Philips
2004 Assie et al (2004)                                      C                  DST-Xli, MEHR, 111I, by GE
2004 Assié et al (2004)                                      C                  AXIS, LEHR/MEGP, 99mTc, by Philips
2004 Lazaro et al (2004)                                    PC                  IASA prototype, CsI(Tl), 99mTc
2005 Staelens et al (2005)                                   C                  IRIX, LEHR/MEGP, 99mTc, by Philips
2005 Autret et al (2005)                                     C                  DST-XLi, Millennium VG, 131I, by GE
2006 Staelens et al (2006)                                  PC                  ECAM multi-pinhole, 123I, by Siemens
2006 Vandenberghe et al (2006b)                             PC                  prototype SOLSITCE, solid-state, CZT, 99mTc
2006 Sakellios et al (2006)                                 PC                  prototype, PSPMT, CsI(Tl), 99mTc
2008 Carlier et al (2008)                                    C                  Symbia, 99mTc, 111I, 131I, by Siemens
2009 Park et al (2009)                                      PC                  TRIAD XLT9, LEUHR, NaI(Tl), 99mTc, by Trionix
2010 Mok (2010)                                             PC                  XSPECT, multi-pinhole, 99mTc, by Gamma Medica-Ideas
2011 Robert et al (2011)                                     C                  prototype, HiSens, CZT, LEHR/H13, 99mTc, 57Co
2011 Boisson et al (2011)                                   PC                  prototype, parallel slat, YAP:Ce, 99mTc, 57Co
2015 Lee et al (2015b)                                      PC                  Symbia T2, LEAP/LEHR/HE, 131I, 99mTc, by Siemens
2015 Lee et al (2015a)                                      PC                  Inveon, LSO, 123I, 125I, by Siemens
2015 Spirou et al (2015)                                     C                  ECAM, NaI(Tl), 99mTc, by Siemens
2017 Georgiou et al (2017)                                  PC                  γ-eye, CsI(Na), 99mTc, 111In, 177Lu, by Bioemtech
2017 Costa et al (2017)                                      C                  Symbia T2, MEAP, 177Lu, by Siemens
2018 Taherparvar and Sadremomtaz (2018)                     PC                  prototype, CsI(Na), 99mTc
2019 Sadremomtaz and Telikani (2019)                        PC                  HiReSPECT, LEHR, CsI(Na), 99mTc, by PNP

    Simulation of this full size PET scanner was performed. As illustrated in figure 5, a cubic shape was used to
minimize dead zones and to simplify the manufacturing process. The CaLIPSO is composed of 4 sectors of 5 × 6
elementary modules. The acquisition FOV are 354 mm (axial) and 307 mm (radial). TMBi is encapsulated
within a transparent sapphire window coupled to the MCP-PMT with optical gel. The read-out ionization pad
structure is also integrated. The GATE digital detection model used dedicated parameterized modules to
simulate the detector response for the ionization and light signal readout. These semi-analytic models were
calibrated using detector prototypes. The first estimation of the non-paralyzable dead time was 3.5 μs,
corresponding to mean drift time and the shaping time for electronics readout. Estimated spatial resolution of
reconstructed images was 1.1 mm in the complete scanner FOV and sensitivity was 17 kcps/MBq.
    J-PET long axial FOV PET with plastic scintillators. J-PET is a PET system based on plastic scintillators
allowing for a cost-effective total body solution (Moskal et al 2019a, 2018, Moskal and Stepień 2020,

                                                       7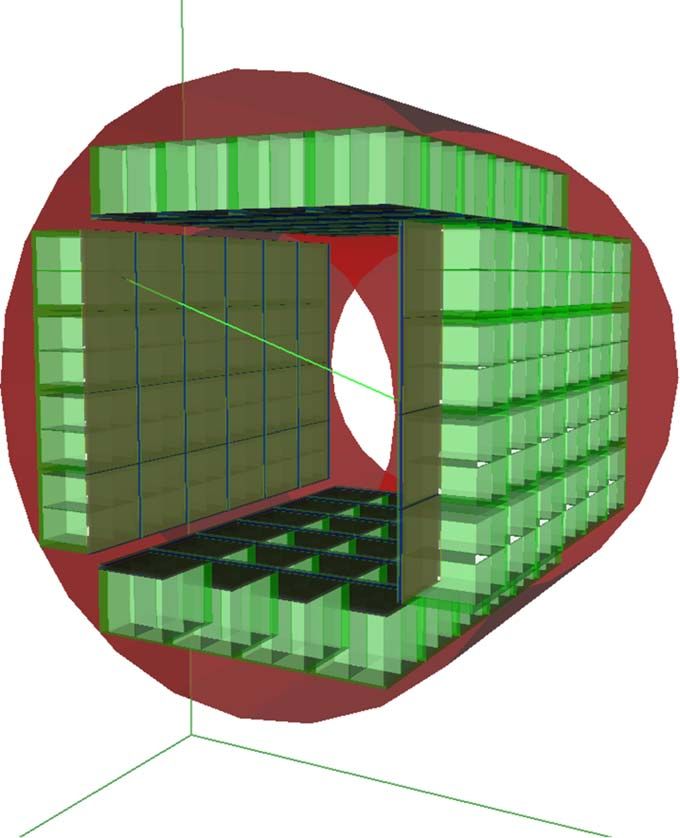
Phys. Med. Biol. 66 (2021) 10TR03                                                                                                 D Sarrut et al

   Figure 3. (Left) A long axial FOV scanner of 20 rings (104 cm axial length) based on monolithic scintillator blocks. (right) Long axial
   FOV systems of 2 m with full coverage, 1.5 m with 33% gaps and a 2 m long system with 50% gaps.

   Figure 4. Illustration of unit detector module based on the ionization chamber filled with trimethyl bismuth (TMBi).

Vandenberghe et al 2020). The J-PET prototype scanner with a long axial FOV built of axially arranged plastic
scintillator strips was simulated in GATE (Kowalski et al 2018). Three diameters of the scanner (75, 85 and
95 cm), three lengths (20, 50 and 100 cm) and two thicknesses T (4 and 7 mm) of scintillators were simulated for
both single- and double-layer geometries. Spatial resolution was simulated for three readout solutions: (1)
vacuum PMT, (2) SiPM matrices and (3) SiPM readout with an additional layer of wavelength shifting (WLS)
strips. The WLS were arranged perpendicularly to the scintillator strips, allowing for the determination of the
photon interaction point along the tomograph axis, based on the distribution of amplitudes of light signals in
WLS strips. The spatial resolution, sensitivity, scatter fraction and NECR were estimated according to the
NEMA-NU-2 protocol, as a function of the length of the tomograph, the number of detection layers, the
diameter of the tomographic chamber and for various types of applied readout. For the single-layer geometry
with a diameter of 85 cm, a strip length of 100 cm, a cross-section of 4 mm × 20 mm and SiPM with an
additional layer of WLS strips as the readout, the spatial resolution FWHM in the center of the scanner was
estimated to 3 mm (radial, tangential) and 6 mm (axial). For the analogous double-layer geometry with the same

                                                          8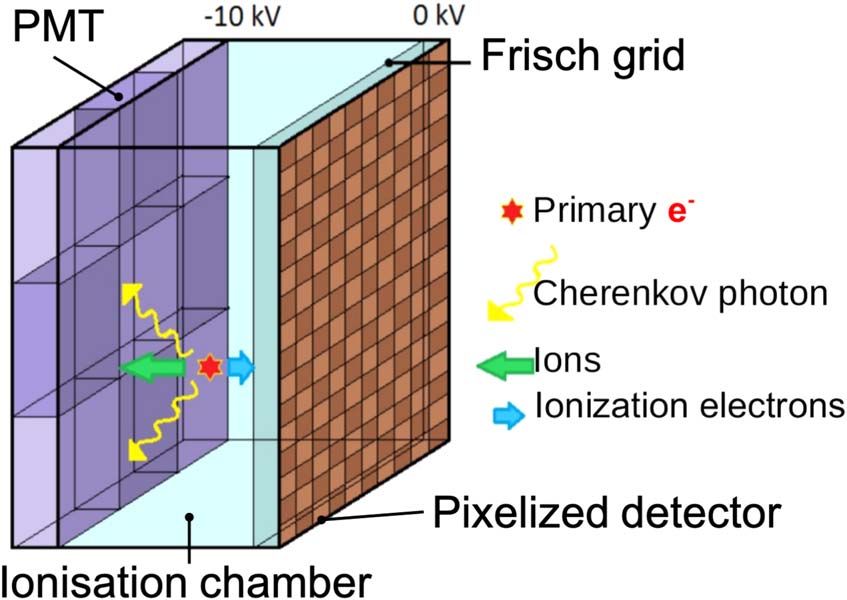
Phys. Med. Biol. 66 (2021) 10TR03                                                                                                 D Sarrut et al

   Figure 5. Design of the CaLIPSO PET scanner dedicated for high resolution brain imaging.

   Figure 6. Presentation of the (a) modeled module of the system (1st layer in red and 2nd layer in blue), (b) scheme of the full TRIMAGE
   scanner in GATE, reprinted from Del Guerra et al 2018, Copyright (2018), with permission from Elsevier. Copyright. © European
   Psychiatric Association 2018. (c) view of the simulated phantom geometry for the sensitivity measurements (the several layers of the
   sleeves are presented with different colors) and (d)–(f) transversal, coronal and sagittal slices of the 10 iterations of the simulated IQ
   phantom.

readout, diameter and scintillator length, with a strip cross-section of 7 mm × 20 mm, a NECR peak of 300 kcps
was reached at 40 kBq/c.c. activity concentration, the scatter fraction was estimated to be about 35% and the
sensitivity at the center amounts to 14.9 cps/kBq.

                                                          9
Phys. Med. Biol. 66 (2021) 10TR03 D Sarrut et al
Figure 7. Simulation set-up used for the choice of the collimator. Left—the complete camera and a 3D XCAT voxelized phantom.
Right—images of the thyroid with two hot nodules (0.6 and 1.2 cm diameter) simulated for five collimators. Given values are the
collimator spatial resolutions. Example of ROIs defined around the nodules and on the background are shown on the 3 mm SR
collimator image.
TRIMAGE: trimodality imaging for schizophrenia. A novel dedicated trimodality (PET/MR/EEG) imaging
prototype for schizophrenia was developed within the TRIMAGE project. The brainPET insert was modeled and
extensively evaluated with GATE. In Del Guerra et al (2018), several geometrical phantoms were implemented,
covering realistic imaging situations. The simulated PET model was evaluated for its performance (spatial
resolution, sensitivity and count rate) according to the NEMA standards. Figure 6 depicts the modeled scanner
alongside with the NU 2-2001 sensitivity phantom (Teräs et al 2007) and the PRESTO reconstructions of the
NU2-1994 Image Quality (IQ) phantom. Spatial resolution varied between 2.34 mm and 3.66 mm (FWHM)
axially moving radially 10–100 mm from the center of the FOV. The simulated coincidence efficiency (i.e. the
sensitivity) for a point source positioned at the center of the FOV was 61 cps/kBq. To assess the count rates, a
solid, cylindrical phantom made of polyethylene (density 0.96 ± 0.1 g cm−3) with dimensions of 70 mm in
length and 25 mm in diameter was used. The phantom was placed at the center of the axial and transaxial FOV of
the modeled scanner. A cylindrical hole of 3.2 mm diameter was drilled parallel to the central axis of the cylinder,
at a radial distance of 10 mm from the center. The line source insert was a clear polyethylene plastic tube 60 mm
in length, filled with 5 to 11 kBq ml−1 of 18F and threaded through the hole in the phantom for 1000 s
measurement time. The NECR showed a peak above 1.8 Mcps at 250 MBq.
The γ-eye SPECT camera. In Ricci et al (2019), the γ-eye, a small FOV preclinical scintigraphic camera was
extensively validated. The γ-eye is produced by BIOEMTECH and is suitable for in vivo molecular imaging of
radiolabeled biomolecules providing a screening tool for dynamic pharmacokinetics studies (Georgiou et al
2017). The γ-eye detector was simulated with GATE and evaluated for its spatial resolution and sensitivity
properties comparing experimental and simulated data. All of the appropriate electromagnetic and physical
processes were included, while no cuts or variance reduction techniques (VRT) were applied. A maximum
difference, equal to ≈16%, on spatial resolution observed, at 7.5 mm distance (5.85 mm experimental value
versus 4.9 mm simulation value). In the case of sensitivity, the difference recorded in zero mm source-to-
collimator distance (57 cps/MBq versus 63 cps/MBq) was ≈10.5%. For all the other distances the difference in
sensitivity was lower and very close to the mean value of 56 cps/MBq.
10Phys. Med. Biol. 66 (2021) 10TR03 D Sarrut et al
THIDOS compact mobile γ-camera for absorbed radiation dose control in molecular radiotherapy. The THIDOS
project aims to the optimization of the individualized patient dosimetry in radioiodine therapy of thyroid diseases by
the development of new instrumental and methodological approaches to strengthen the control of the absorbed dose
by reducing the uncertainties associated to dose calculation. In that framework we are developing a high-resolution
compact and mobile planar γ-camera with a 10 × 10 cm2 FOV for use at the patient bedside. The goal is to improve the
individual quantitative assessment of the distribution and biokinetics of radioiodine in target regions and organs-at-
risk before and after treatment administration. In Trigila (2019), the design of the high-energy parallel-hole tungsten
collimator was optimized using GATE and an XCAT 3D voxelized phantom with realistic background and thyroid
gland 131I distributions in order to improve quantification of small targets (nodules or tumor remnants) as shown in
figure 7. The camera was fully modeled and a specific study was carried out on the energy and spatial distributions of
scattered and penetration events inside the collimator. The best compromise in terms of contrast and signal-to-noise
ratio on nodules of various sizes was achieved with a 5.5 cm thick collimator with 1.1 mm hexagonal holes and
0.75 mm thick septa, which allows to minimize the partial volume effect, while reducing both scattered and
penetration events (effective septal penetration less than 7.5%). The expected spatial resolution (2 mm FWHM) and
efficiency (1.24 × 10⁻⁵) for a 131I source set a 5 cm from the collimator were found to be in good agreement with the
experimental results.
MACACO Compton Camera prototype. In Etxebeste et al (2020), the first version of MACACO (Medical
Applications CompAct COmpton camera) prototype (Muñoz et al 2017) built at IFIC-Valencia, was employed for
the validation of GATE CCMod against experimental data. This prototype is based on multiple (2–3) layers of
LaBr3 monolithic crystals coupled to SiPMs. A system configuration of two layers separated by 50 mm was
considered. The crystal sizes were 27.2 × 26.8 × 5 mm3 and 32 × 36 × 10 mm3 for the first and second layer
respectively both coupled to SiPM arrays with active area pixels of 3 × 3 mm2. The first layer was based on four
Hamamatsu MPPC S11830-3340MF monolithic arrays whereas the second one was based on an older version
S11064-050P(X1) with larger gaps between the pixels. Passive material of the prototype (boards, holders, etc) was
also included in the simulations. The performance of the system was characterized and compared to simulated data
in terms of energy spectra, efficiency, angular resolution and back-projection image onto the plane of the source
with good agreement. Hence, the angular resolution measure for 1275 keV incident photons was 13.4° ± 0.2°
(simulation) versus 13.5° ± 0.2° (experimental). Relative detection efficiency was slightly overestimated
2.6 × 10⁻³ (simulated) versus 1.9 × 10⁻³ (experimental) and consistent results within a 3-sigma interval were
obtained for energy spectra except for low energies where small differences were observed. These discrepancies
were partially caused by the approximations made in the simulation of the experimental discriminator threshold at
SiPM pixel level in the digitization process which allow us to avoid the generation and transport of optical photons.
Other applications in interventional nuclear medicine. As nuclear medicine techniques make rapid
advancement in surgery and in interventional radiology, we briefly summarize the current uses of GATE in
support of these applications. They include simulations of tomography units and 1D and 2D detectors with the
goal either to enhance the extracted diagnostic information or to maximize the therapeutic effect of the
procedures. Following is a list of GATE uses in radio-guided surgery, in trans-arterial radioembolization and in
real-time PET/CT guided biopsies.
In radio-guided surgery, GATE is used to simulate gamma and beta detection probes (Spadola et al 2016) and
optimize the imaging process. Vetter et al (2015) used GATE to evaluate the limits of accuracy of an analytical
approach to register a previous 3D SPECT image to the readings from an optically tracked hand-held 1D gamma
probe an approach known as freehand (fh) SPECT. Since in fh-SPECT the detector positions are arbitrary and
the system matrix is not defined, Hartl et al (2015) used GATE to simulate a LUT of detector readings at a
predefined grid of probe positions around a 99mTc source in order to obtain the contribution of each source
voxel to the detector readings. A LUT created with GATE was used for the fh-SPECT part of a novel hybrid probe
combining fh-SPECT with fh-fluorescence (van Oosterom et al 2020). The authors used a measured LUT for the
optical probe. They commented, that while fluorescence simulations are possible with GATE, the optical LUT
computation would be challenging since the opto-nuclear probe is not in direct tissue contact which leads to a
dynamic ratio of air and skin contributions (van Oosterom et al 2020). In an another development, the design of
a PET-like limited angle tomography system for intraoperative radio-guided imaging was explored using GATE
by Sajedi et al (2019).
After trans-arterial radioembolization of liver tumors with 90Y microspheres, verification of the correct
delivery of the microspheres and voxel-based dosimetry can be achieved by performing 90Y SPECT or 90Y PET
scans (Bastiaannet et al 2018). Since 90Y is a pure β-emitter, the bremsstrahlung radiation used for SPECT
imposes the use of broad energy windows which contain large amounts of scattered radiation. In that case, a
different Monte Carlo code (SIMIND) was used to optimize the collimators and the energy window for 90Y
SPECT (Roshan et al 2016). 90Y PET is challenging due to the very low positron yield (3.186× 10⁻⁵) and
Strydhorst et al performed a detailed analysis of the sources of quantification error in 90Y PET by separating true
coincidences from random and true events caused by the 176Lu LSO crystal activity and by bremsstrahlung
11Phys. Med. Biol. 66 (2021) 10TR03 D Sarrut et al
Figure 8. Measured (a) and simulated (b) autoradiography (ARG) images of a liver specimen obtained from 18F-FDG PET/CT guided
biopsy. The simulation was performed by building within GATE a 3D voxelized source model of the distribution of tumor cells in the
biopsy specimen by registering and stacking 2D slices ((c), only one slice shown) in which the location of tumor cells (red) was
obtained by a machine learning tool (TMARKER Schüffler et al 2013) applied to the 58 pathology sections (d) into which the specimen
was sectioned (Seiter et al 2018). The images are not to scale and the uptake in normal liver cells (blue in (c)) was set to zero for this
simulation (b). Among the other factors causing a difference between the measured and simulated ARG images are deformation of the
specimen during processing and inaccuracies in registration between the sections.
radiation in phantom simulations with GATE (Strydhorst et al 2016b). The point-spread function of a cone
beam SPECT collimator and the projections of a NEMA phantom model for SPECT parallel hole, cone beam
and multifocal collimators were simulated with GATE to validate the performance of the Utrecht Monte Carlo
system iterative SPECT reconstruction package for fast pre-radioembolization imaging with 99mTc
macroaggregated albumin (99mTc-MAA) (Dietze et al 2018). GATE was also used for investigating various
dosimetry aspects of radioembolization (Papadimitroulas et al 2012, Mountris et al 2014, Roncali et al 2020).
The specimens from real-time PET/CT guided biopsies are radioactive, allowing measurement of the
amount and the distribution of the PET tracer contained in them by radioactivity measurements. This concept
has been explored to show that autoradiography (ARG) images of the specimens are quantifiable and can aid
evaluating adequacy of the specimens for diagnosis and for genomic profiling as well as investigating the
specificity of beta emitting radiopharmaceuticals with high resolution (Fanchon et al 2015, Fanchon 2016,
Maybody et al 2016, Kirov et al 2018). GATE simulations of the positron transport through liver specimens and
gelatin-based specimen models which were used for calibrating the ARG detectors were performed to obtain a
gel-to-liver correction factor (Fanchon 2016, Kirov et al 2018). Further, an ARG image of the tumor cells in a
colorectal cancer liver specimen was simulated from the distribution of tumor cells as established in the
pathology slices into which the specimen was sectioned (Seiter et al 2018), see figure 8.
4. Methodological developments within GATE
In addition to developments dedicated to improve detector modeling, which are detailed in section 2, we briefly
review in the following sections recent features added in GATE that help to design emission tomography
simulation but are not specific to imaging.
4.1. Towards simpler analysis via Python
Historically, Geant4 and High Energy Physics community are linked to the ROOT CERN framework (Brun and
Rademakers 1997) that allows to efficiently manage and analyze physics data. Since the beginning, GATE also
allows to write ROOT files, e.g. detector events or phase space, or use them as input, e.g. use phase space file as a
source of particles. Python has become the tool of choice for data analysis with modules such as NumPy (Harris
et al 2020) or Matplotlib (Hunter 2007). Since version 9.0, GATE now includes additional options to read/write
data in NPY file format (Harris et al 2020) that can be processed with Python. Also, ROOT files can be processed
in Python with the uproot module (Pivarski 2020). Details about the NPY file format can be found in the GATE
user guide25 and examples of Python analysis are available on the GateContrib repository26.
25
https://opengate.readthedocs.io
26
https://github.com/OpenGATE/GateContrib
12Phys. Med. Biol. 66 (2021) 10TR03 D Sarrut et al
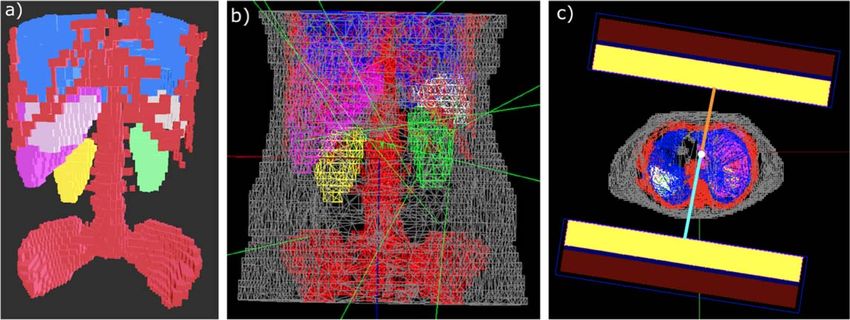
Figure 9. a) Patient mesh model with all segmented volumes of interest: bones (red), lungs (blue), liver (pink), spleen (white) and left
and right kidney (green and yellow). (b) Snapshot of patient model with the remainder of the body (gray) from GATE. Few green lines
represent photons emissions. (c) Visualization of the auto-contouring gamma camera motion in GATE. Unequal distances of each
detector from the center of rotation (in orange and blue respectively) shows that the camera moves in a non-circular orbit.
Finally, the GATE community recently started a new repository, called GateTools27, that gather Python
functions that can be useful for simulation setup and analysis. As example, it contains tools to convert or resize
images in various file formats, to convert DICOM RT structures, to manage phase-space files or analyze dose
map, with DVH (Dose Volume Histogram) or gamma-index for example. All tools are available as Python
function and as command-line independent scripts. At the time of writing, there are more than twenty different
tools. The installation is very easy thanks to conventional Python pip install. Like GATE itself, the code is
open-source and community driven. It should evolve in the future thanks to users’ contributions.
4.2. Variance reduction techniques
Several VRTs were developed in GATE. Among those useful for emission tomography, we can describe the
following: for particles with relatively large mean free path lengths comparatively to voxels size, Woodcock
tracking (Rehfeld et al 2009) using fictitious interactions can be used to speed up tracking; for SPECT simulation,
angular response function (ARF) (Song and Segars 2005, Descourt et al 2010, Sarrut et al 2018) replaces the
detector response by an analytical (or neural network) model providing probabilities of detection in all energy
channels; ARF can be combined with fixed forced detection that forces the detection of a photon in each detector
pixel weighted by the probability of emission (or scattering) and transmission to this pixel (Cajgfinger et al 2018).
The acceleration of all those approaches can reach one order of magnitude, although it depends on many
parameters and on the simulation configurations.
4.3. Positronium source
Positronium is a metastable electron–positron bound state, which is formed approximately up to 40% of the
cases in a patient’s body before the annihilation. It appears in two quantum modes: ortho- and para-positronium,
which have different physical properties, in particular the ortho-positronium lives three orders of magnitude
longer than para-positronium, around: 142 ns versus 0.125 ns, respectively. In the tissue, ortho-positronium
mean lifetime strongly depends on the size of intramolecular voids (free volumes between atoms), whereas its
formation probability depends on the voids concentration (Moskal and Stepień 2020). In a patient’s body the
formation probability and the mean lifetime are in function of the bio-fluids and bio-active molecules
concentration (Moskal et al 2019b). As it was shown in Moskal and Stepień (2020), one can reach the mean
lifetime precision of about 20 ps. To measure the positronium lifetime, one needs to use non-pure isotopes
emitting prompt gammas.
A set of helper classes was added in GATE for the simulations of the positronium decays. Positronium mean
lifetime tomography is one of the examples of a novel PET multiphoton imaging technique proposed recently
(Moskal et al 2019a). The available positronium decay models are: para-positronium two-photon decay, ortho-
positronium three-photon decay and the mixed model decay where users can adjust a relative frequency of two
possible positronium decays. The implemented model of ortho-positronium decay products angular
distribution is described in Kamińska et al (2016). All the model parameters are configurable by user with a
simple GATE macro. In addition, an emission of prompt gamma with a predefined emission energy can be
27
https://github.com/OpenGATE/GateTools
13Phys. Med. Biol. 66 (2021) 10TR03 D Sarrut et al
Figure 10. 3D rendering of a custom PET scanner and the MERMAID zebrafish phantom in GATE. Left: full view. Right: zoom to the
phantom, placed into a water tube. Here the gray structure represents the tessellated zebrafish volume, and the green and red dots
correspond to emission locations for the entire zebrafish and the heart, respectively. The green lines indicate several representative
photon trajectories.
added. Photon polarization settings are also supported at the macro level. This source enables advanced PET
imaging applications such as oxygen sensing for tumor hypoxia (Shibuya et al 2020).
4.4. STL geometry
Thanks to the Geant4 G4TessellatedSolid class, tessellated mesh geometries composed of triangle
primitives are now available in GATE. Users can import STL (stereolithography) files containing the coordinates
of vertices and faces of the meshed surface, and GATE generates the corresponding volume in the geometry. One
application of this new kind of geometry has been the modeling of the body contouring limited to cubic shapes
allows the gamma camera head to move as close as possible to the phantom/patient model thereby preventing
their collision in the GATE environment (Kayal et al 2020a, 2020b). Meshes for each segmented volume of
interest from the phantom/patient model were generated individually using Python scripts and imported in
GATE where individual volumes could be assigned with their respective materials from CT (Kayal et al
2021, 2020c). Figure 9 displays the patient mesh model with the auto-contouring gamma camera motion. Total
counts in modeled phantom SPECT images obtained with circular and body contouring gamma camera motion
with same acquisition parameters revealed a relative difference of around 2.5% and 12% for 177Lu and 131I
respectively thereby emphasizing the importance of modeling auto-contouring SPECT gamma camera motion
(with the use of STL volumes) especially for radionuclides with high septal penetration (for e.g. 131I). There could
be potential activity underestimation caused by the use of circular motion acquisition thereby impacting the
absorbed dose in the dosimetry chain.
STL geometries moreover allow for an easy description of complex phantoms, as an alternative to voxelized
phantoms. For instance, a STL-based model of a zebrafish was created from ex-vivo high-resolution micro-CT
scans (Zvolský et al 2019a). This phantom has been designed for the MERMAID project, which is aimed to
small-fish PET imaging (Zvolský et al 2019b). Figure 10 displays 3D renderings of a PET scanner design and the
zebrafish phantom including exemplary photon emissions. Separate STL files were used for different structures
(e.g. bones, heart, swim bladder, gills, etc). These meshes were used as both attenuation and emission phantom.
As GATE does not support the distribution of activity within a mesh, Geant4 volumes enclosing the tessellated
volumes of interest were created. The activity is distributed within the volume by an acceptance-rejection
method. Then, GATE confines the emission of radiation to the respective volume with the confine method of its
General Particle Source. It should be noted that the acceptance-rejection method can significantly slow down the
simulation when the surrounding volumes are much larger than the organs or structures of interest to which the
activity should be confined. Care should be thus put in selecting the appropriate size and position of the
enclosing volumes.
4.5. Link to third-party reconstruction software
Output from PET, SPECT or Compton camera simulation, either as list mode data or projections images can
then be used as input for reconstruction software (Gillam and Rafecas 2016). Among others, we can cite the
following software used to reconstruct 3D images from GATE simulations. STIR (Software for Tomographic
Image Reconstruction) (Thielemans et al 2012, Khateri et al 2019, Kang et al 2018) was among the first to
propose dedicated modules allowing to reconstruction GATE simulated data, both for PET and SPECT, with
MLEM and OSEM methods. More recently, the CASToR project (Merlin et al 2018) (Customizable and
Advanced Software for Tomographic Reconstruction) also proposed various reconstruction algorithms for PET
and SPECT, with dedicated tools to use GATE generated data. For SPECT images, the QSPECT software
(Loudos et al 2010, 2014, Spirou et al 2015) was also employed, in particular to investigate the effect of
14You can also read


