ADOPTED Budget VOLUME 1 - City Profile - City of San Diego
←
→
Page content transcription
If your browser does not render page correctly, please read the page content below

ADOPTED
 Budget
 FISCAL YEAR

                                                              VOLUME 1
                                                                   City Profile

MAYOR TODD GLORIA   HOUSING • PROTECT & ENRICH • INFRASTRUCTURE • SUSTAINABILITY • PROSPERITY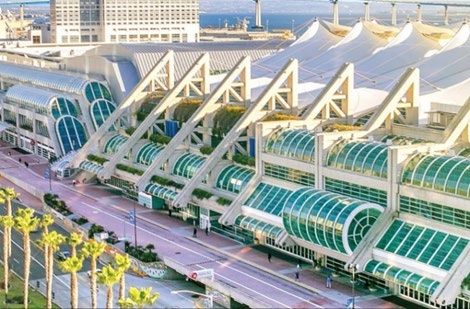
R v1G\

Page Intentionally Left Blank.
City Profile

City Profile
San Diego at a Glance
The City of San Diego, widely known as America’s Finest
City, is best known for its ideal climate, beautiful
beaches, and array of world-class attractions. As the
eighth largest city in the nation and the second largest
city in California, the City's total population was
estimated at 1,381,611 as of July 1, 2021. San Diego's
population has decreased by approximately 0.4
percent between the 2020 Census and the estimated
2021 population as of July 1, 2021 for an aggregate
decrease of 5,321. 1 2021 population estimates were
released on May 26, 2022. 2

San Diego covers 325 square miles of land area and an additional 47 square miles of water area for an
aggregate total of 372 square miles. 3 Due to the unique topography of the City, which includes numerous
beaches, mesas, mountains, and canyons, the climate can vary significantly over short geographical
distances resulting in microclimates throughout the region.

San Diego spans over 70 miles of pristine Pacific Ocean coastline offering a wide variety of beaches and
amenities. With its great weather, and miles of sandy beaches, San Diego is known worldwide as one of the
best tourist destinations and a great place for residents to relax year round

Center for Education & Research
San Diego is a center for education and research, with both public and private colleges and universities.
San Diego State University, Point Loma Nazarene University, the University of San Diego, and the University
of California San Diego (UC San Diego) are the most well-known higher education institutions in San Diego.
U.S. News & World Report recently released their rankings of the 2022 best national universities in the
United States. UC San Diego, University of San Diego, and San Diego State made the list ranking of 34,98,
and 148, respectively.
UC San Diego is world renowned and recognized as one of the top universities for research and
development (R&D) receiving over $1.54 billion in sponsored research funding for Fiscal Year 2021 (July
2020 – June 2021), which is a 6.0 percent increase over the previous year. 4 Research centers under the
umbrella of UC San Diego include the Scripps Institution of Oceanography (Scripps Oceanography), San
Diego Supercomputer Center, California Institute for Telecommunications and Information Technology
(Calit2), the newly opened Center for Energy Research, and Office of Innovation & Commercialization
Center. Scripps Oceanography is one of the largest and most renowned centers for ocean, earth, and
atmospheric science research in the world. San Diego State University also received an increased
investment in research with nearly $141.0 million in grant and research funding during that same time
frame. 5 San Diego State University plans to expand their academic and research programs, aided by their
eventual expansion into Mission Valley and adjacent land to the University.

1
  QuickFacts San Diego City. United States Census Bureau website. Retrieved July 2022.
2
  Schedule. United States Census Bureau website.
3
  2021 Census Gazetteer Files-Places. United States Census Bureau website. Retrieved March 2022.
4
  UCSD News. UCSD website. Retrieved March 2022.
5
  SDSU Newscenter. SDSU website. Retrieved March 2022.

                                                          - 15 -                                         City of San Diego
                                                                                          Fiscal Year 2023 Adopted Budget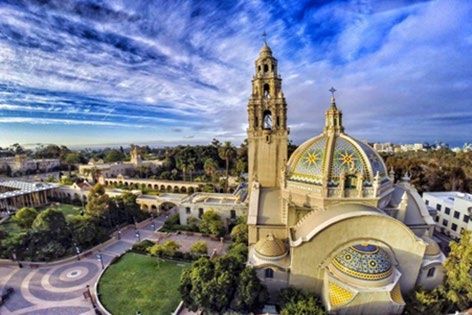
City Profile

Local Economy
San Diego policymakers, businesses and educators are working collaboratively to create a thriving
innovation ecosystem consisting of some of the world's smartest companies and a talented and loyal
workforce. The City’s proximity to Mexico and global recruitment capabilities give San Diego easy access to
international markets. Built upon a strong foundation in defense spending, the San Diego economy has
benefited from the increase in demand for international trade, high-tech manufacturing, research and
development, advantages of a blue economy and a dynamic tourism industry. San Diego’s economic base
has undergone a transformation in recent years to become more diversified, which helps hedge the risk of
impacts from one specific sector.
However, the defense and military industries continue to play a significant role in the San Diego economy.
The San Diego Military Advisory Council (SDMAC) issued a Military Economic Impact Study in October 2021
(SDMAC Study) estimating that in 2021, defense-related activities and spending generated approximately
$55.20 billion of Gross Regional Product (GRP) for San Diego County, or 25.0 percent of the region’s total
GRP. In 2021, the military was responsible for approximately 349,112 jobs in the region, or 23 percent of all
employment in the region. The SDMAC Study further estimates that $35.30 billion in federal defense funds
were allocated to San Diego County. This direct spending is estimated at a conservative 5.3 percent increase
over Fiscal Year 2020. 6

Figure 1 displays the County of San Diego Jobs by Industry Sector for 2021.

                      Figure 1: County of San Diego Jobs by Industry Sector
                                            County of San Diego
                                           Jobs by Industry Sector
                              Other
                                                            2021
                             Services   Information
            Construction
                               4%
                 6%
                Financial
                Activities                                                                Services
                   5%                                                                       17%
          Manufactu ring
              8%

                                                                                     Transportation
                      Health Services                     Leisu re and                 & Utilities
                            12%
                                                          Hospitality                     17%
                                                              11 %

         Source: State of California Economic Employment Development
Innovation
The San Diego region is known for having one of the largest concentrations of high-tech companies in the
United States, with companies focused on information and communication technology, biotech and life
sciences, clean-tech, and maritime technology. San Diego’s innovation economy is a center for scientific
breakthroughs and discoveries as a result of its research institutions and scientific research and
development. Research institutions as well as commercial research and development businesses are one

6
    Military Economic Impact Study 2021. SDMAC website. Retrieved March 2022.

City of San Diego                                          - 16 -
Fiscal Year 2023 Adopted Budget
City Profile

of the largest and most significant economic contributors to the region, bringing in more than $3.40 billion
in venture capital funding in 2019. 7
The City’s economic base is anchored by higher education and major scientific research institutions, which
provide a foundation to create new manufacturing products. The top exports from the San Diego Area are
computer and electronic parts, chemicals, machinery, transportation equipment, and other miscellaneous
manufacturing goods. The San Diego area was the 19th largest exporter among U.S. Metro areas with an
export value of $19.00 billion in 2020. 8
San Diego County’s life science industry directly employed more than 72,000 people in 2020, generating
$27.70 billion in GRP. Considering all multipliers, life sciences was responsible for nearly 178,000 jobs with
total earnings of $16.00 billion. Research and Manufacturing represented 45 percent of life sciences direct
employment, with Biotechnology following at about 18 percent of direct employment. 9

Tourism
In 2021, San Diego had approximately 23.8 million
visitors, who spent over $7.40 billion at thousands of
San Diego area businesses. 10 This industry typically
generates over $855.0 million annually in State and
local taxes. However, with the onset of the COVID-19
pandemic in March 2020, the San Diego tourism
industry experienced significant economic impacts. The
primary economic indicators of transient occupancy tax
include room rates, occupancy, and room demand
growth, all of which are projected to see growth in Fiscal
Year 2023, indicative of increased tourism in the region.
This assumption is supported by vaccinations
becoming widely available, a decline in COVID-19
infection rates, pent-up demand for leisure travel, and the gradual return of group and business travel. The
Fiscal Year 2023 Adopted Budget projects transient occupancy tax revenues to reach pre-pandemic levels.
While there has been improvement as the City moved through less restrictive tiers and as restrictions were
lifted entirely on June 15, 2021, the tourism industry is projected to exceed pre-pandemic levels in Fiscal
Year 2023. Additional details on the impacts and recovery related to tourism revenue is discussed in detail
in the General Fund Revenues Section of this Volume.

While San Diego is primarily known for its miles of beaches and amazing weather, San Diego is also home
to an abundance of attractions for visitors of all ages. These destinations include the world-renowned San
Diego Zoo, San Diego Zoo Safari Park, and Sea World. In addition, San Diego offers other activities for
visitors seeking cultural and recreational experiences. Balboa Park is a 1,200-acre urban park with 17
museums and cultural institutions, several performing arts venues, gardens, hikes, art galleries, and various
cultural attractions that bring millions of people to visit the park each year.

7
  2019 San Diego Innovation Report. Connect website. Retrieved March 2022.
8
  San Diego-Chula Vista-Carlsbad, CA Goods Exports. Department of Commerce. Retrieved March 2022.
9
  California Economic Impact Report. Biocom California Website. Retrieved March 2022.
10
   Annual Visitor Industry Summary. San Diego Tourism Authority website. Retrieved March 2022.

                                                         - 17 -                                       City of San Diego
                                                                                       Fiscal Year 2023 Adopted Budget
City Profile
The San Diego Convention Center is a 2.6 million square
foot convention center located on San Diego Bay and
next to San Diego’s historic Gaslamp Quarter. For 2021,
Convention Center events generated approximately
$210.0 million in direct attendee spending, making it
one of the biggest drivers in the City for sales, lodging,
and tourism revenue. 11 Every year, the convention
center hosts several large events and conventions, but
the most well-known is Comic Con International, which
is historically the largest economic generator for the
Convention Center and one of the largest for the City of
San Diego. Comic Con International has committed to
staying in San Diego through 2024. Comic Con International had its regular main event in July 2022. In 2019,
Comic Con attracted more than 135,000 attendees and generated a regional economic impact of
approximately $150.0 million. The San Diego Convention Center is estimating visitor spending to reach
$711.0 million in Fiscal Year 2023. 12 Although group events have been much slower to recover, ultimately,
large group events are anticipated to continue to improve and reach pre-pandemic levels as the public
health situation in the region improves.
Transportation
San Diego is well connected to the Southern California region by interstates, trains and light rail. The region
is served by the San Diego International Airport at Lindbergh Field. The San Diego International Airport
prior to 2020 broke traffic records for six consecutive years with 25.2 million passengers recorded for 2019,
however, since the inception of the COVID-19 pandemic, air travel has been significantly impacted by the
pandemic. The Tourism Economics' San Diego Forecast released in February 2022, anticipates progressive
increases in international inbound travel and corporate travel to normalize through calendar year 2022 as
travel policies are revised. Additionally, San Diego Air traffic was up 69 percent from the prior year
increasing to 15.6 million. 13 San Diego International Airport is focused on advancing the Airport
Development Plan to further support and expand air travel to and from San Diego.
San Diego, in cooperation with the San Diego Metropolitan Transit System, has established a light-rail
system that connects downtown with other outlying communities in the northern, eastern, and southern
portions of the county. Amtrak also provides intercity passenger rail service from downtown San Diego to
Los Angeles, and north to San Luis Obispo.
The Metropolitan Transit System's San Diego Trolley includes three lines serving many popular areas and
attractions throughout San Diego. The Mid-Coast Corridor Transit Project began in fall of 2016 and went
into service on November 21, 2021. 14 The trolley project extended Trolley service from the Santa Fe Depot
in Downtown San Diego to the University City community, next to the University of California San Diego.
Metropolitan Transit System also operates 94 bus routes, including eight high-frequency, limited-stop Rapid
bus service lines. The Metropolitan Transit System has freeway level transit stations to enhance reliability
and efficiency of a service that connects the Mid-City communities with Downtown San Diego and
Escondido. Additionally, the Metropolitan Transit System has limited South Bay rapid bus service to the
South Bay community, which connects the southern community to downtown San Diego. 15
11
Annual Visitor Industry Summary. San Diego Tourism Authority website. Retrieved March 2022.
12
Comic-Con is Back! San Diego Convention Center website. Retrieved July 2022.
13
San Diego Passenger Traffic Record. San Diego International Airport website. Retrieved March 2022
14
Mid-Coast Trolley Extension. SANDAG Website. Retrieved March 2022.
15
South Bay Rapid. Metropolitan Transit System website. Retrieved March 2022.
City of San Diego - 18 -
Fiscal Year 2023 Adopted BudgetCity Profile
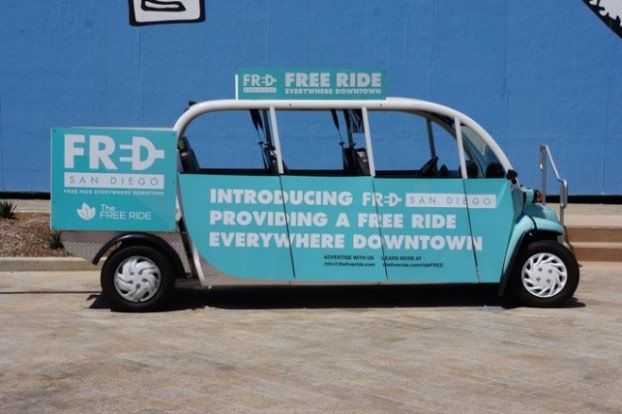
San Diego is providing greater access to efficient and
sustainable transit options. The "Free Ride Everywhere
Downtown", also known as FRED, is designed by Circuit
and exists to create more transportation options; and
facilitate trips within Downtown San Diego to residents
and visitors for free via electric vehicles. 16
The City continues to work on the Downtown Mobility Plan.
The plan calls for the installation of two-way cycle tracks on
major roads in downtown for use by cyclists and scooter
riders; and the creation of a safe passage from Balboa Park
to the San Diego Convention Center and other popular destinations. In downtown, Sixth Avenue and Beech
Street are being converted to two-way Class IV protected bike lanes. Additionally, the J Street protected bike
lane will be extended to 16th Street, and Park Boulevard, and C Street will receive protected bike lanes, as
part of the landmark Downtown Mobility Plan. Currently, the first two phases of the project have been
substantially completed with a third phase on its way. Some highlights of the completed work are
approximately 90 curb ramps, bike signal indicators and protected bike lanes on various streets, 1.1 miles
of slurry seal, and 0.6 miles of asphalt concrete overlay.
Demographic Statistics
Being the eighth largest city in the United States and the second largest in California, the City of San Diego
has 1.4 million residents comprised of an ethnically and culturally diverse population. Since 2020, the
population of the City has decreased by 5,321; San Diego reached a population peak of 1,425,976 in 2018
and is estimated at 1,381,611 as of July 1, 2021. Estimates for City populations as of July 1, 2022 are
scheduled for release in May 2023.
Influenced by its close proximity to an international border and the Pacific Rim, more than 40.0 percent of
the City’s population speaks a language other than English at home and more than 25.0 percent are
considered a foreign-born person. Immigration from various parts of the world has been and continues to
be a major contributor to San Diego’s ethnic and cultural diversity. Having the privilege of being a
multicultural melting pot positions the City’s labor force for success in the global economy.
San Diego’s strong history and reputation with the military and defense industry have built the nation’s
largest military community, which makes up nearly 10.0 percent of the population in the region. The San
Diego Association of Governments (SANDAG) forecasts the City’s population to be 1.59 million by 2035 and
1.63 million by 2050. 17
The following Figures 2 through 4 provide more detail about the City of San Diego's population
demographic including: population by Age, Educational Attainment, and Race Identification, respectively.
16
Civic San Diego. Downtown San Diego Partnership Team Launch Downtown Circulator Program. City of San Diego website.
Retrieved March 2018.
17
SANDAG Series 14 Regional Growth Forecast. SANDAG website. Retrieved March 2022.
- 19 - City of San Diego
Fiscal Year 2023 Adopted BudgetCity Profile
Figure 2: Population By 500,000
Age
Source: U.S. Census Bureau,
> V,
450,000
400,000
.,C: 350,000
2016 - 2020 American "O
.,
·;;; 300,000
Community Survey 5-Year c,::
._ 250,000
0
Estimates. .0
~ 200,000
E
::, 1 50,000
:z
1 00,000
5 0,000
Under5 5 to 1 9 20to 34 3 5 to 5 9 GO and ove r
Age Group
Figure 3: Educational
Attainment
Source: U.S. Census Bureau,
> Graduate/Profession al Degr ee
Bachelor 's Degree
2016 - 2020 American j
..'.:l
Community Survey 5-Year C:
0
Associate's Degree
·.;::;
Estimates. "'..,::, Some College, no degree
....
"O
High School Gr aduate (include
equivalency)
Less t han High School
0.0% S.0% 10.0% l S.0% 20.0% 2S.0% 30.0%
Percentage
Figure 4: Race
Identification
Source: U.S. Census Bureau,
> White
Asian
2016 - 2020 American
C:
.Q
Some Other Race Alone
lo
Community Survey 5-Year u
~
Estimates. C:
., Two or more races
'.E
.,u Black or African American
c,::"'
American Indian and Alaskan Native
Native Hawaiian and Other Pacific Islander
0.0% 10.0% 20.0% 30.0% 40.0% 50.0% 60.0% 70.0%
Percentage
City of San Diego - 20 -
Fiscal Year 2023 Adopted BudgetYou can also read