Adenosine 2A receptor and TIM3 suppress cytolytic killing of tumor cells via cytoskeletal polarization
←
→
Page content transcription
If your browser does not render page correctly, please read the page content below
ARTICLE
                  https://doi.org/10.1038/s42003-021-02972-8                  OPEN

                  Adenosine 2A receptor and TIM3 suppress
                  cytolytic killing of tumor cells via cytoskeletal
                  polarization
                  Grace L. Edmunds1, Carissa C. W. Wong1, Rachel Ambler1, Emily J. Milodowski2, Hanin Alamir1,
                  Stephen J. Cross 3, Gabriella Galea 1, Christoph Wülfing 1,4 ✉ & David J. Morgan 1,4 ✉

                  Tumors generate an immune-suppressive environment that prevents effective killing of tumor
                  cells by CD8+ cytotoxic T cells (CTL). It remains largely unclear upon which cell type and at
1234567890():,;

                  which stage of the anti-tumor response mediators of suppression act. We have combined an
                  in vivo tumor model with a matching in vitro reconstruction of the tumor microenvironment
                  based on tumor spheroids to identify suppressors of anti-tumor immunity that directly act on
                  interaction between CTL and tumor cells and to determine mechanisms of action. An ade-
                  nosine 2A receptor antagonist, as enhanced by blockade of TIM3, slowed tumor growth
                  in vivo. Engagement of the adenosine 2A receptor and TIM3 reduced tumor cell killing in
                  spheroids, impaired CTL cytoskeletal polarization ex vivo and in vitro and inhibited CTL
                  infiltration into tumors and spheroids. With this role in CTL killing, blocking A2AR and TIM3
                  may complement therapies that enhance T cell priming, e.g. anti-PD-1 and anti-CTLA-4.

                  1 Schoolof Cellular and Molecular Medicine, University of Bristol, Bristol BS8 1TD, UK. 2 Bristol Veterinary School, University of Bristol, Bristol BS40 5DU, UK.
                  3 Wolfson BioImaging Facility, University of Bristol, Bristol BS8 1TD, UK. 4These authors jointly supervised this work: Christoph Wülfing and David J. Morgan.
                  ✉email: Christoph.Wuelfing@bristol.ac.uk; D.J.Morgan@bristol.ac.uk

                  COMMUNICATIONS BIOLOGY | (2022)5:9 | https://doi.org/10.1038/s42003-021-02972-8 | www.nature.com/commsbio                                                      1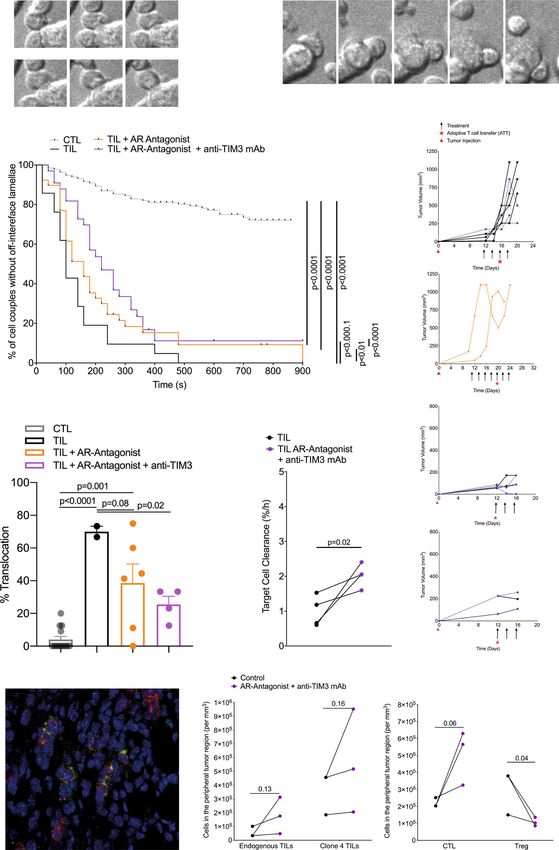
ARTICLE                                                              COMMUNICATIONS BIOLOGY | https://doi.org/10.1038/s42003-021-02972-8

C
        D8+ cytotoxic T cells (CTL) have the ability to directly kill       all detectable20. A2AR blockade or T cell-specific deletion
        tumor target cells. Such killing requires effective priming         enhances anti-tumor immunity in many models, often with
        of tumor antigen specific CD8+ T cells within the draining           enhanced CTL tumor infiltration21–24. The localized generation
lymph nodes; differentiation into CTL; effective tumor infiltration          of adenosine and its role in tumor infiltration make adenosine
and execution of the cytolytic effector function within the tumor           an attractive target as a regulator of tumor immunity with a
microenvironment. However, solid tumors often generate an                   direct focus on the tumor microenvironment.
immune-suppressive environment with multiple often redundant                   Expression of the inhibitory receptor TIM3 increases with
immune-suppressive elements that prevent effective tumor cell               repeated T cell stimulation25 reaching particularly high levels in
killing. For the development of widely applicable curative cancer           tumors. High TIM3 expression in tumors is related to poor
immunotherapies, multiple reagents with defined mechanisms of                overall survival26. Blocking TIM3 can enhance anti-tumor
action that can be flexibly combined are required, at least some of          immunity, in particular in combination with anti-PD-1 or
which need to restore CTL killing within the tumor1. Here we                chemotherapy27. While TIM3 is highly expressed on CD8+ TIL,
have characterized two such reagents.                                       TIM3 also regulates myeloid cell function, is highly expressed on
   Inhibitory receptors, in particular CTLA-4, PD-1, TIGIT,                 CD4+ Tregs in tumors and TIM3 signaling can display features of
TIM3, and LAG3, impair the anti-tumor immune response2,3.                   costimulation, such as activation of Akt/mTOR28,29. Even though
Blocking CTLA-4 and PD-1 is a cornerstone of current immu-                  the mechanism of action of TIM3 thus remains unresolved, its
notherapy and has yielded great therapeutic success in many                 preferential expression on CD8+ TIL makes it an attractive
cancer types4. However, efficacy is limited to a subset of patients          candidate for a direct regulator of the interaction between CTL
and few tumor types, and autoimmune side effects can be                     and their tumor target cells.
substantial. Mechanisms of action of PD-1 blockade are still                   Here we aim to determine whether effectors of tumor-mediated
being debated. Initially, it was widely assumed that blocking PD-           immune suppression can directly regulate the killing of tumor
1 would reactive tumor-infiltrating CTL (TIL) that had acquired              target cells by CTL. We complement an in vivo tumor model with
a suppressed state characterized by enhanced PD-1 expression.               a matching in vitro reconstruction of the tumor microenviron-
However, PD-1 and also CTLA-4 are expressed not only on CTL                 ment based on the interaction of tumor spheroids with CTL in
but also on other T cell subtypes, other immune cell types, and             the absence of any other cell types7,30,31: Murine renal carcinoma
even on tumor cells. Deletion of PD-1 in myeloid cells can                  cells expressing the hemagglutinin (HA) protein from influenza
enhance anti-tumor immunity more effectively than deletion in               virus A/PR/8 as neo-tumor-specific antigen (RencaHA) are
T cells5. In basal or squamous cell carcinoma patients, PD-1                effectively recognized by the immune system in vivo and generate
blockade does not reactivate tumor-resident CTL but leads to                an immune-suppressive tumor microenvironment. Recognition
infiltration of new CTL clones6. We have shown that treating                 of Renca tumors can be enhanced with the adoptive transfer of
mice with anti-PD-1 enhances anti-tumor immunity but treat-                 CL4 T cell receptor transgenic CTL recognizing an HA-derived
ing TIL directly ex vivo does not enhance their function7, fur-             peptide. In vitro, RencaHA cells cultured in three-dimensional
ther arguing for an effect independent of the direct CTL tumor              spheroids effectively interact with CL4 CTL such that the sup-
cell interaction. Ligands of CTLA-4 are expressed on antigen-               pressed phenotype acquired in this in vitro interaction closely
presenting cells in T cell priming but not commonly on tumor                matches that acquired by adoptively transferred CL4 CTL
cells. Therefore, CTLA-4 blockade is more likely to enhance T               in vivo7. A key element of the mechanism of the impaired killing
cell priming rather than reactivate TIL. Potential depletion of             ability of tumor-suppressed CTL is the reduced ability of CTL to
regulatory T cells mediated by the anti-CTLA-4 Fc region, even              execute the cytoskeletal polarization steps required for effective
though controversial, can also be expected to affect priming8–11            target cell killing7.
and illustrates the wider functional consequences of Fc receptor               Blocking A2AR partially reduced RencaHA tumor growth
engagement by antibodies against inhibitory receptors12. The                in vivo. Upon A2AR blockade TIM3 was highly upregulated
effects of PD-1 and CTLA-4 blockade on T cell priming may be                amongst CD8+ TIL. Combing in vivo blockade of A2AR with that
critical in the development of autoimmune side effects by                   of TIM3 further reduced tumor growth in the context of the
allowing self-reactive T cells to activate. PD-1 and CTLA-4                 adoptive transfer of CL4 T cells. This combined treatment par-
blockade are most effective in patients that already have tumors            tially restored the ability of CTL to polarize towards their tumor
with a substantial immune infiltrate rich in CD8+ T cells13,                 target cells and enhanced tumor infiltration of CTL. In vitro,
limiting the applicability of PD-1 and CTLA-4 blockade across               overexpression of TIM3 by CL4 CTL and treatment with an A2AR
many cancer types. Thus, means to enhance anti-tumor                        agonist inhibited killing of tumor cells in tumor spheroids and the
immunity that focuses more strongly on (re)activation of CTL                A2AR agonist also reduced spheroid infiltration by CTL. An A2AR
and/or enhancing tumor infiltration rather than on the priming               agonist suppressed cytoskeletal polarization of CTL during both
of new T cell clones are of substantial interest in the develop-            migration and coupling to tumor target cells. Interference with
ment of a diverse combinatorial tool kit for curative cancer                cytoskeletal polarization thus is a potential mechanism by which
immunotherapy.                                                              A2AR and TIM3 may directly suppress the killing of tumor cells
   Key soluble mediators of tumor-mediated immune suppres-                  by CTL.
sion are adenosine and prostaglandin E2 (PGE2). Both use an
increase in intracellular cyclic AMP (cAMP) as a key signaling
mechanism and may, therefore, have overlapping functions14,15.              Results
PGE2 strongly regulates dendritic cell biology and thus T cell              An experimental approach to identify direct suppressors of
priming16. Adenosine is generated by hydrolysis of extracellular            CTL killing of tumor target cells. Enhancing the ability of CTL to
ATP by the ectoenzymes CD39 and CD7317 the expression of                    kill tumor target cells within the tumor microenvironment (TME)
which is increased in hypoxic and immunosuppressive tissue                  is of immense therapeutic interest. To identify immunosuppressive
environments18. Adenosine concentrations are therefore greatly              factors that act directly on CTL within the TME, we combined
enhanced in the tumor microenvironment14,19. Adenosine sig-                 in vivo mouse studies with matched direct investigation of the
nals through a family of four adenosine receptors14,15. The                 interaction of CTL with tumor spheroids in vitro (Fig. 1)7,30,31:
adenosine 2A receptor (A2AR) is highly expressed in T cells,                Renca renal carcinoma cells expressing influenza A/PR/8/H1N1
whereas mRNA for the other three isoforms is barely or not at               hemagglutinin (HA) induce an endogenous anti-tumor immune

2                         COMMUNICATIONS BIOLOGY | (2022)5:9 | https://doi.org/10.1038/s42003-021-02972-8 | www.nature.com/commsbio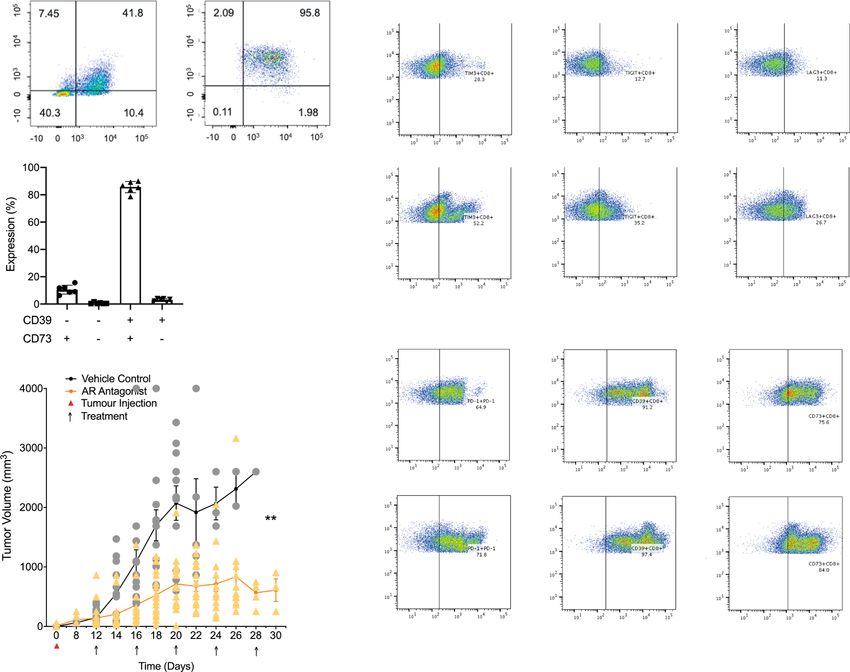
COMMUNICATIONS BIOLOGY | https://doi.org/10.1038/s42003-021-02972-8                                                                    ARTICLE

Fig. 1 Schematic representation of the experimental system. The different experimental strategies used are illustrated on the left with a list of
corresponding experiments and figures shown for each on the right.

response and an immune-suppressive TME when grown sub-                         intraperitoneally with 10 mg/kg of the A2AR antagonist ZM
cutaneously in mice. The T cell receptor (TCR) of T cells from CL4             241385 every 4 days (Fig. 1)32,33. Comparison with other
TCR transgenic mice recognizes the HA peptide 518–526 (IYST-                   emulsified compounds of a similar molecular weight suggests
VASSL) as restricted by H-2Kd. Upon adoptive transfer into                     that such treatment led to a peak blood concentration of ZM
RencaHA tumor-bearing mice, CL4 CTL infiltrates the tumor and                   241385 in the low µM range with a half-life of about 1 h34. At that
acquires a suppressed phenotype7. Incubation of in vitro primed                peak concentration, ZM 241385 inhibits both A2AR and A2BR35.
CL4 CTL with RencaHA tumor cells grown as three-dimensional                    However, A2AR mRNA expression in T cells is several-fold higher
spheroids induces a suppressed CTL phenotype that shares key                   than that of A2BR; A2AR-deficient lymphocytes do not elevate
features with tumor-infiltrating CL4 T cells7. Thus, we could                   cAMP in response to adenosine any more20 and ZM 241385
characterize tumor-associated immunosuppression of CD8+                        displays >50-fold selectivity for A2AR over A2BR as detailed in the
T cells in parallel in the in vivo tumor model to establish phy-               methods section. For the remainder of the manuscript we,
siological relevance and in the in vitro spheroids to establish direct         therefore, refer to ZM 241385 as an A2AR antagonist. Under
effects on the interaction of CTL with tumor cells in the absence of           control conditions, tumors grew from 150 ± 25 mm3 at day 12,
other immune cells.                                                            the start of treatment, to 2075 ± 290 mm3 within 8 days with two
                                                                               mice sacrificed early as their tumors exceeded maximum
                                                                               allowable tumor volume. ZM 241385 treatment resulted in a
The adenosine 2A receptor suppresses anti-tumor immunity.                      reduction in tumor growth from 140 ± 35 mm3 to only
High concentrations of adenosine occur within many solid tumors.               715 ± 85 mm3 over 8 days with no mice needing to be sacrificed
CD4+FoxP3+ regulatory T cells (Tregs) express the adenosine-                   (p < 0.01) (Fig. 2b). These data establish a partial role of A2AR in
generating ectoenzymes CD39 and CD73 as an important means of                  suppressing anti-tumor immunity in the RencaHA model.
in situ adenosine generation. Within TIL from RencaHA tumor-
bearing mice 86 ± 2% of CD25+FoxP3+CD4+ T cells expressed
both CD39 and CD73 (Fig. 2a). CD25+CD4+ TIL from RencaHA                       TIM3 expression is enhanced on CTL upon in vivo A2AR
tumor-bearing mice suppressed in vitro proliferation of naïve CL4              blockade. The only partial nature of the suppression of tumor
T cells in a manner dependent on the adenosine 2A receptor                     growth upon A2AR blockade suggests that other elements of
(A2AR) (Supplementary Fig. 1a). This in vitro generation of func-              tumor-mediated immune suppression may synergize with A2AR
tionally relevant amounts of adenosine by CD25+FoxP3+CD4+                      engagement or are even upregulated to compensate for A2AR
TIL suggests that these cells can also generate elevated adenosine             blockade. We, therefore, determined the expression of inhibitory
concentrations in the RencaHA TME.                                             receptors: TIM3, TIGIT, LAG3, PD-1, and adenosine-producing
   To determine whether A2AR suppresses anti-tumor immunity                    ectoenzymes: CD39 and CD73 by both CD8+ and CD4+ TIL
in the RencaHA model, we treated RencaHA tumor-bearing mice                    from ZM 241385-treated and control tumors.

COMMUNICATIONS BIOLOGY | (2022)5:9 | https://doi.org/10.1038/s42003-021-02972-8 | www.nature.com/commsbio                                           3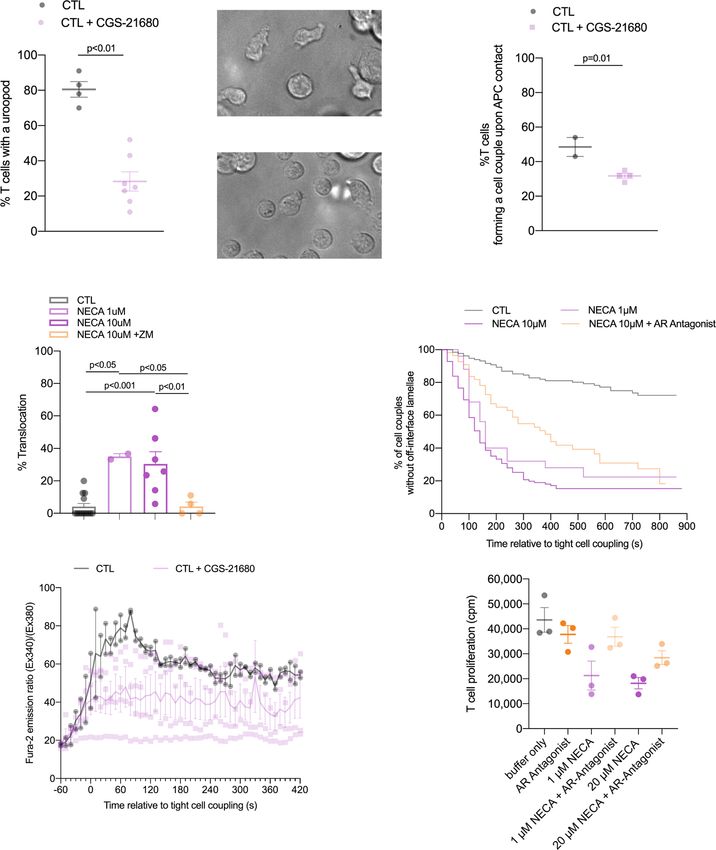
ARTICLE COMMUNICATIONS BIOLOGY | https://doi.org/10.1038/s42003-021-02972-8
a c TIM3 TIGIT LAG3
vehicle only
CD25
CD73
CD8β
Foxp3 CD39
ZM 241385
PD-1 CD39 CD73
vehicle only
b
CD8β
ZM 241385
d Label Positively Expressed P-value
PCA − Biplot
106 Drivers of PC1
121 8 CD8: any except CD39 1.6E-13
46 CD8+CD73+LAG3+PD-1+TIGIT+TIM3+ 2.8E-15
47 CD8+CD73+LAG3+PD-1+TIGIT+ 6.4E-17
5 71 CD8+PD-1+TIGIT+ 4.6E-11
84 CD4+: any except CD39 7.1E-12
123 CD4+CD73+LAG3+PD-1+TiIGIT+ 1.1E-14
124 CD4+CD73+LAG3+PD-1+TIGIT-TIM3+ 5.2E-17
78 132 CD4+CD73+PD-1+TIGIT-TIM3+ 5.4E-11
2 138 CD4+LAG3+PD-1+TIGIT+TIM3+ 4.9E-14
146 CD4+PD-1+TIGIT+TIM3+ 6.0E-13
Dim2 (16.5%)
Tx 148 CD4+PD-1+TIGIT-TIM3+ 1.6E-11
0 150 CD4+TIGIT+TIM3+ 8.7E-21
Control
46
123 ZM Opposers of PC 1
8 138 47 2 CD8: CD39+ with any other 1.6E-13
124
148 27 CD8+CD39+CD73+TIGIT+ 0.002
150
71 146
43 CD8+CD39+TIGIT+ 0.015
132 84
78 CD4: CD39+ with any other 7.1E-12
102 CD4+CD39+CD73+TIGIT+TIM3+ 0.0005
137 CD4+CD73+ 0.0005
−5
Drivers of PC2
137
102 106 CD4+CD39+LAG3+PD-1+TIGIT+TIM3+ 9.8E-14
27 121 CD4+CD39+ 6.4E-13
43
Opposers of PC2
27 CD8+CD39+CD73+TIGIT+ 6.3E-9
43 CD8+CD39+TIGIT+ 1.4E-10
0 10 20 102 CD4+CD39+CD73+TIGIT+TIM3+ 1.0E-7
Dim1 (24.7%)
137 CD4+CD73+ 1.2E-7
To identify combinations of inhibitory receptor expression PC1 were therefore positively associated with A2AR antagonism
altered upon A2AR blockade, we used a principal component of TIL. TIM3 expression was upregulated in combination with
analysis. Input data were the percentage of T cells expressing other inhibitory receptors by A2AR antagonist treatment and
inhibitory receptors in all combinations and tumor size (Fig. 2c, contributed to PC1 with p < 0.001. PD-1 and TIGIT expression
d, Supplementary Fig. 1b). Principal component (PC) 1 effectively were also strongly associated with PC1, albeit TIGIT both
distinguished TIL from ZM 241385-treated and control mice amongst drivers and opposers. Thus, upregulation of the
(95% confidence ellipses are shown). Variables that contribute to expression of PD-1 and TIM3 is most strongly associated with
4 COMMUNICATIONS BIOLOGY | (2022)5:9 | https://doi.org/10.1038/s42003-021-02972-8 | www.nature.com/commsbio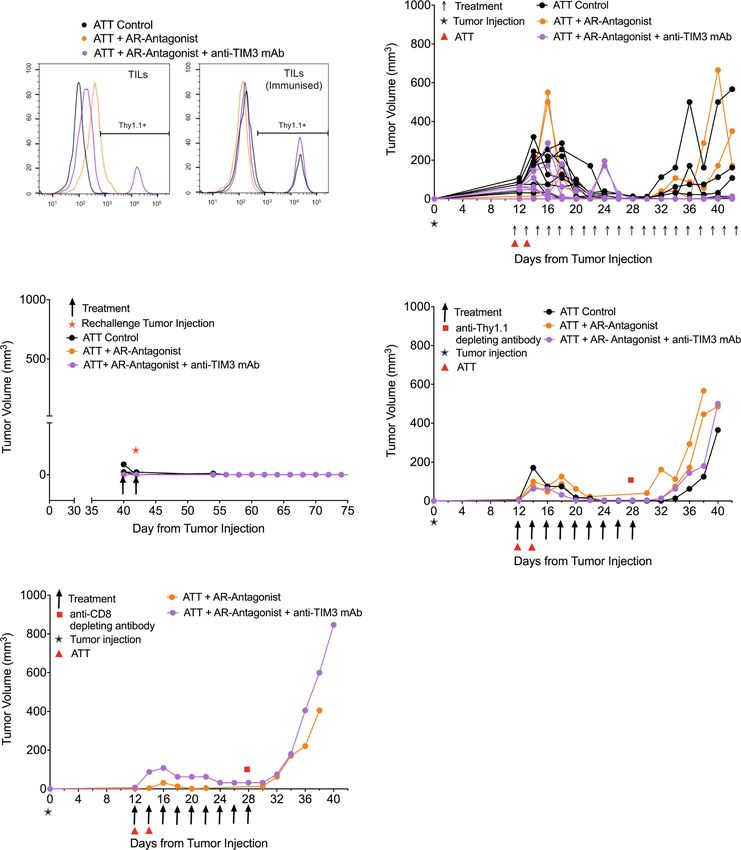
COMMUNICATIONS BIOLOGY | https://doi.org/10.1038/s42003-021-02972-8                                                                     ARTICLE

Fig. 2 An A2AR antagonist delays in vivo tumor growth and triggers compensatory upregulation of T cell inhibitory receptors. a TIL from RencaHA
tumor-bearing BALB/c mice was stained with anti-CD25, anti-FoxP3, anti-CD39, and anti-CD73 mAb. On the left and in the middle, representative flow
cytometry data are shown. On the right, percentage TIL expressing CD39 and CD73 are given as mean ± SEM for N = 6 experiments. b Mean RencaHA
tumor volume is given ± SEM in BALB/c mice after s.c. injection of 1 × 10⁶ RencaHA tumor cells on day 0 and i.p. injection with ZM 241385 when tumors
had reached 5 mm diameter in any one direction (day 12–14) and further treatments administered every other day as indicated (linear mixed model to
perform repeated measures ANOVA. **p < 0.01). N = 26 treated mice and 20 control mice over four separate experiments. c CD45+ cells from the
RencaHA tumor-bearing mice treated with ZM 241385 or vehicle control in b were stained using mAbs against CD8, CD4, CD39, CD73, TIM3, TIGIT,
LAG3, and PD-1. Representative flow cytometry data are shown. The gating strategy for the identification of CD8+ TIL is given in Supplementary Fig. 1b.
d The outcome of a principal component analysis is given with input data of percentage expression of markers in c in each combination of the eight
markers, representing 308 variables, and tumor volume as an additional variable. Each triangle (ZM 241385-treated) or circle (control-treated) represents
an individual tumor-bearing mouse. Large symbols represent the average position of treated and control mice along PC1 with ellipses showing 95%
confidence intervals. The 24 variables making the greatest contribution to principal component (PC) 1 and 2 are overlaid as numbered vectors and are
listed in the table. Entire FACS data are available as detailed in the data availability statement. Source data are provided in Supplementary Data 1.

A2AR blockade. As TIM3 is more likely to directly affect the                   TIM3 mAb resulted in a marked reduction in tumor growth
interaction of CTL with their tumor cell targets as discussed in               relative to mice given either CL4 T-cells alone or CL4 CTL plus
the introduction, we selected TIM3 blockade as an adjunct                      ZM 241385 (Fig. 3c) suggesting that TIM3 enhances suppression
treatment to improve responses to A2AR-antagonism. Expression                  of anti-RencaHA tumor immunity by A2AR already in this early
of various combinations of inhibitory receptors by CD4+ TIL was                phase of tumor growth.
also associated with A2AR antagonist treatment, as not further                    In the ‘response’ phase, between days 20 and 26, most tumors
pursued here because of our focus on the direct interaction                    regressed in all treatment groups. Comparing this regression to
between CD8+ CTL and tumor target cells.                                       the continued RencaHA tumor growth in the absence of CL4
   PC2 separated TIL by the volume of the tumor they are derived               CTL adoptive transfer (Figs. 2b, 3a), the regression can be
from, with larger tumors associating positively with PC2. This                 attributed to the transferred CL4 CTL. Mice in which tumors
highlights the importance of accounting for tumor volume when                  regressed were categorized as ‘responders’. The percentage of
assessing immune profiles. CD39 expression strongly drove PC2                   responder mice did not differ between the treatment groups
while opposing PC1. This indicates that with increasing size                   (Fig. 3d). We then defined ‘relapse’ as tumors reaching a
control tumors relied more on adenosine for immune suppres-                    volume ≥ the starting volume. When analyzing all mice, relapse
sion as opposed by A2AR antagonism. Only in the largest tumors,                was slightly delayed in mice treated with ZM 241385 and anti-
>1,000 mm3, did inhibitory receptor expression in TIL start to                 TIM3 mAb without reaching statistical significance (Fig. 3e).
increase as an additional suppressive mechanism (Supplementary                 When analyzing relapse only in responders, relapse frequencies
Fig. 1c). Conversely, amongst A2AR-blocked tumors, TIL                         differed substantially with treatment. Upon adoptive transfer
inhibitory receptor expression was already high in smaller                     of CL4 CTL alone, 8/17 tumors relapsed within 26 days of
tumors, providing an alternate means of suppression in the                     regression. Upon treatment with adoptive transfer of CL4 CTL
absence of A2AR (Supplementary Fig. 1c). Together these data                   and ZM 241385, tumor relapse occurred in 8/10 responder
suggest that RencaHA tumors rely strongly on A2AR for immune                   mice. However, when anti-TIM3 mAb was used in combination
suppression with compensatory upregulation of inhibitory                       with ZM 241385 plus adoptive transfer of CL4 CTL, only 3/12
receptor expression upon A2AR blockade.                                        mice underwent relapse after regression (p < 0.05 compared
                                                                               to treatment with CL4 adoptive transfer plus ZM 241385).
TIM3 enhances suppression of CD8+ T cell-dependent anti-                       Thus, blocking A2AR together with TIM3 decreased RencaHA
tumor immunity by A2AR. To investigate immunosuppressive                       tumor relapse.
synergy between A2AR and TIM3, groups of BALB/c mice bearing                      To elucidate mechanisms of the prevention of tumor relapse,
12-day old RencaHA tumors were treated with the A2AR                           we determined T cell persistence. After the initial response phase
antagonist ZM 241385 plus or minus the anti-TIM3 blocking                      adoptively transferred Thy1.1+ CL4 CTL were only detected in
mAb RMT3-23 (Fig. 1). For precise temporal synchronization                     mice from the ZM 241385 plus anti-TIM3 mAb group. They
and a standardized number of anti-tumor CTL, we used i.v.                      could also be expanded by a booster immunization with the HA
double adoptive T cell transfer (ATT) of 5 × 10⁶ CL4 TCR                       peptide in mice receiving only CL4 CTL (Fig. 4a, Supplementary
transgenic CTL on days 12 and 14. We observed three phases of                  Fig. 2a). However, Thy1.1+ CL4 CTL were not detected in the
tumor growth upon treatment, an initial ‘growth’ phase of 6 days,              group treated with ZM 241385 alone, with or without a booster
a ‘response’ phase of 8 days, and a subsequent open-ended                      immunization, consistent with the high relapse rate of 8/10. To
‘relapse’ phase (Fig. 3a). As an overall outcome measure, we                   determine the role of persistent CD8+ T cells in tumor immunity,
determined a ratio of the final tumor volume after growth,                      we depleted them. In mice with complete and durable tumor
response, and relapse to initial tumor volume at the start of                  remission lasting >8 days, only five out of 19 mice experienced
treatment. Adoptive transfer of CL4 CTL plus both ZM 241385                    relapsed (Fig. 4b). In addition, responder mice were resistant to
and anti-TIM3 mAb gave a significant (p < 0.05) reduction in the                tumor growth following rechallenge with tumor cells (Fig. 4c). In
average final to initial tumor volume ratio compared with mice                  contrast, treatment with anti-Thy1.1 depleting mAb at 28 days
receiving adoptive CL4 T cell transfer plus ZM 241385 only.                    induced tumor re-growth in 4/4 mice (Fig. 4d). Treatment with
TIM3 thus enhanced suppression of anti-RencaHA tumor                           anti-CD8β depleting mAb resulted in tumor re-growth in 2/2
immunity by A2AR (Fig. 3b).                                                    mice (Fig. 4e, Supplementary Fig. 2b) (p < 0.01 of combined
   To determine at which stage of tumor growth treatment with                  depletion data versus control). Together, these data establish that
ZM 241385 and anti-TIM3 mAb exerted its effect, we analyzed                    response and suppression of relapse depend on the continued
the three phases of tumor growth separately. Initial tumor growth              presence of tumor-reactive CTL.
in all mice peaked between day 14–18. The combination of                          Thus far, our in vivo data establish that combined treatment with
adoptive transfer of CL4 CTL with both ZM 241385 and anti-                     ZM 241385 and anti-TIM3 mAb enhances anti-tumor immunity

COMMUNICATIONS BIOLOGY | (2022)5:9 | https://doi.org/10.1038/s42003-021-02972-8 | www.nature.com/commsbio                                              5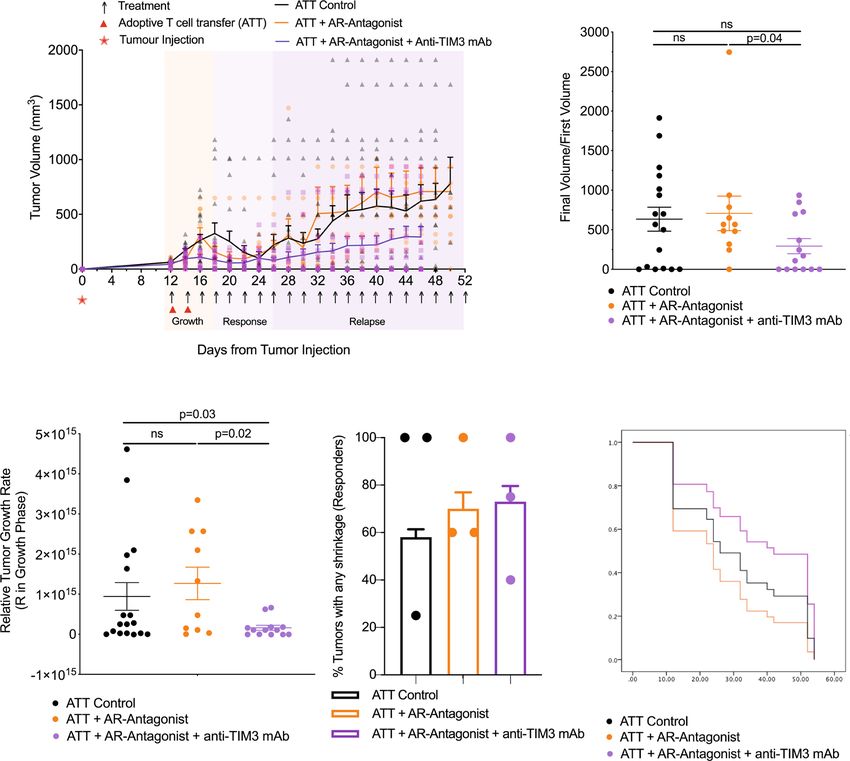
ARTICLE                                                                  COMMUNICATIONS BIOLOGY | https://doi.org/10.1038/s42003-021-02972-8

             a                                                                                 b

             c                                                d                                      e

                                                                                                         Proportion without replase
                                                                                                                                      Time from tumor injection (d)

Fig. 3 A2AR antagonist and anti-TIM3 mAb synergistically suppress RencaHA tumor growth. a RencaHA tumor-bearing BALB/c mice were injected i.v.
twice with 5 × 10⁶ purified CL4 CTL on days 12 and 14 and treated with A2AR-antagonist, anti-TIM3 mAb, or vehicle + isotype-control antibody, as shown.
Tumor growth is displayed as mean tumor volumes + SEM with N = 42 mice over three independent experiments, with at least 11 mice per group. b The
ratio of final to initial (day 12) tumor volume of tumors in a is given with the mean ± SEM (independent two-sample t-test). c R-values representing the
growth rate of tumors in a, between 12 and 16 days, are given with the mean ± SEM (independent two-sample t-test). d Proportion of tumors across all
experimental replicates in a which were regressed are given as bars ±SEM with proportion in individual experimental replicates as dots. Neither analysis of
pooled data using Fisher’s exact Boschloo test nor of experimental replicates using 1-way ANOVA yield significant differences. e Progression free survival
of mice in a is given. Cox Proportional Hazards Regression analysis. Treatment did not significantly predict progression free survival: (p = 0.24 ATT control;
p = 0.40 ATT + A2AR-Antagonist; p = 0.30 ATT + A2AR-Antagonist + Anti-TIM3 mAb). Hazard ratio of progression versus Control was as follows:
ATT + A2AR-Antagonist = 0.36 (0.61 ± 3.38), ATT + A2AR-Antagonist + Anti-TIM3 mAb = −0.53 (0.21 ± 1.63). Source data are provided in
Supplementary Data 2.

in a T cell-dependent fashion. The mechanism underpinning the                   (Fig. 5a). Less than 30% of in vitro primed control CL4 CTL
immune-enhancing effect of such treatment in the initial anti-                  display such lamellae even after 15 min of cell contact; whereas,
tumor response is the focus of the remainder of this manuscript.                all TIL from control-treated tumors do so within 7 min (Fig. 5b).
                                                                                Following treatment of mice with the A2AR antagonist ZM
                                                                                241385 plus blocking anti-TIM3 mAb off-interface lamellae
A2AR and TIM3 suppress the cellular polarization of CTL and                     formed later, with the median time of first off-interface lamellae
tumor infiltration. Mechanisms of A2AR and TIM3 in suppres-                      formation delayed from 100 s to 220 s. 11% of cell couples did
sion of anti-tumor immunity are of interest. For effective tumor                not show any off-interface lamellae at all (Fig. 5b). Another
infiltration and tumor cell killing CTL need to undergo a series of              hallmark of defective TIL cytoskeletal polarization is T cell
cytoskeletal polarization steps. The inability to effectively execute           translocation over the tumor cell surface away from the site of
such steps characterizes tumor-infiltrating CTL7. To determine if                initial coupling (Fig. 5c). While almost completely absent in
A2AR and TIM3 regulate effective TIL polarization in the tumor                  in vitro primed control CTL, 71 ± 9% of TIL displayed such
microenvironment, we isolated TIL from RencaHA tumors and                       translocation (Fig. 5d, e). This frequency was significantly
imaged their subsequent interaction with KdHA peptide pulsed                    (p < 0.001) reduced to 37 ± 9% and 23 ± 7% upon tumor treat-
Renca cells ex vivo. One hallmark of defective cytoskeletal TIL                 ment with ZM 241385 alone or in combination with anti-TIM3
polarization is CTL lamellae directed away from the cellular                    mAb, respectively. Data from these restoration experiments
interface with the tumor target cell to destabilize the cell couple             establish that A2AR, as enhanced by TIM3, contributes to the

6                            COMMUNICATIONS BIOLOGY | (2022)5:9 | https://doi.org/10.1038/s42003-021-02972-8 | www.nature.com/commsbio
COMMUNICATIONS BIOLOGY | https://doi.org/10.1038/s42003-021-02972-8 ARTICLE
a b
Normalized cell count
Thy1.1
c d
e
Fig. 4 A2AR antagonist plus anti-TIM3 mAb diminish tumor relapse in a T cell-dependent fashion. Mouse numbers across the different parts of the
experiments are detailed in Supplementary Fig. 2a. a RencaHA tumor-bearing BALB/c were injected i.v. with two doses of 5 × 10⁶ Thy1.1+ CL4 CTL (ATT)
plus either vehicle and isotype control, A2AR-antagonist (ZM 241385) alone or A2AR antagonist + anti-TIM3 mAb as shown. The percentage of Thy1.1+
CL4 TIL between days 25 and 48 is given as representative data from N = 25 mice over three independent experiments. Mice were either immunized with
HA peptide 5 days prior to TIL harvest (N = 5) to induce expansion of Thy1.1 + CL4 T cells or immunized with empty vehicle control (N = 19); one
representative graph is shown for each group. b–e Tumor growth curves from individual mice treated in Fig. 3a, which had experienced complete and
durable tumor remission. b untreated and c rechallenged with tumor cells at day 40; d depleted of Thy1.1+ T cells using anti-Thy1.1 depleting mAb at
28 days; e depleted of all CD8+ T cells using anti-CD8β depleting mAb at 28 days with depletion efficiency shown in Supplementary Fig. 2b. Source data
are provided in Supplementary Data 3.
defective cytoskeletal polarization of TIL. Consistent with the As an additional process requiring cytoskeletal activity, we
importance of such CTL cytoskeletal polarization for cytolysis, examined the infiltration of endogenous CD8+ T cells and CL4
treatment of tumors with the A2AR antagonist ZM 241385 plus CTL into Renca tumors in vivo. Such infiltration was focused on
blocking anti-TIM3 mAb significantly (p = 0.02) enhanced peripheral tumor regions and was enhanced upon treatment with
ex vivo CL4 TIL killing (Fig. 5f, g). We have also seen the the A2AR antagonist ZM 241385 plus blocking anti-TIM3 mAb
restoration of CTL cytoskeletal polarization and killing upon (Fig. 5h, i). In contrast, CD4+ Treg infiltration was diminished
treatment of RencaHA tumor-bearing mice with anti-PD-17. It is (Fig. 5i). An enhanced ratio of CD8+ CTL to CD4+ Tregs in the
now of interest whether or not A2AR and TIM3, in contrast to tumor thus constitutes an additional potential mechanistic
PD-17, directly regulate the interaction between CTL and their contribution of reduced tumor growth in mice upon blockade
tumor target cells. of the A2AR and TIM3.
COMMUNICATIONS BIOLOGY | (2022)5:9 | https://doi.org/10.1038/s42003-021-02972-8 | www.nature.com/commsbio 7ARTICLE COMMUNICATIONS BIOLOGY | https://doi.org/10.1038/s42003-021-02972-8
a c
0:00 0:20 0:40
1:00 1:20 1:40
b e
d f g
h i
A2AR and TIM3 directly inhibit the killing of tumor target cells not diminish spheroid infiltration by CL4 CTL (Fig. 6a). How-
by CL4 CTL in spheroids. To determine whether A2AR and ever, it diminished the ability of CL4 CTL to kill Renca target cells
TIM3 directly regulate the interaction of suppressed CTL with inside the spheroids as determined with DRAQ7 staining
their tumor target cells, we employed the in vitro reconstruction (Fig. 6b). Confirming TIM3-dependence, diminished Renca
of CL4 CTL suppression in our Renca spheroid/CL4 CTL only tumor cell killing could be reversed with the anti-TIM3 blocking
system (Fig. 1). To determine the roles of TIM3, we overexpressed mAb RMT3-23 (Fig. 6b). To determine the roles of A2AR in
a TIM3-GFP fusion protein in CL4 CTL. Such overexpression did tumor cell killing by CTL, we treated CL4 CTL/Renca spheroid
8 COMMUNICATIONS BIOLOGY | (2022)5:9 | https://doi.org/10.1038/s42003-021-02972-8 | www.nature.com/commsbioCOMMUNICATIONS BIOLOGY | https://doi.org/10.1038/s42003-021-02972-8 ARTICLE
Fig. 5 A2AR plus TIM3 suppress CTL polarization, killing, and infiltration in the TME. a–e Ex vivo cytoskeletal polarization of CL4 TIL from RencaHA
tumor-bearing BALB/c mice upon ATT of CL4 T cells and treatment with combinations of A2AR antagonist and anti-TIM3 mAb (N = 5 control, N = 3 both
treatments, N = 2 A2AR antagonist alone) in comparison to in vitro CL4 CTL is given. Mouse numbers across the different parts of the experiments are
detailed in Supplementary Fig. 2a. a Representative image sequence in 20 s steps of a CL4 CTL with off-interface lamellae as labeled with black arrows.
Time 0:00 is arbitrary. Scale bar = 5 µm. Entire image sequence in Supplementary Movie 1 with a second time series in Supplementary Movie 2. b Time
until the formation of the first off-interface lamella is given. Kaplan–Meier survival analysis (Log Rank) N > 30 cell couples per condition over four
experiments. c Representative image sequence in 1 min steps of a CL4 CTL with a translocation, i.e. CTL movement of >1 interface diameter from the initial
location of the immune synapse (red line). Time 0:00 is the time of tight cell coupling. Scale bar =5 µm. Entire image sequence in Supplementary Movie 3
with a second time series in Supplementary Movie 4. d The frequency of cell couples with translocation is given ± SEM. 1-way ANOVA. N = 21–132 cell
couples per condition over ≥2 experiments. Alternate analysis of pooled data of percent translocation by proportion’s z-test yields p < 0.0001 for all
comparisons between CTL/TIL and treated TIL samples. e Growth curves of the tumors used for analyses a–d are shown. f RencaHA tumor-bearing BALB/c
mice were treated with A2AR antagonist and anti-TIM3 mAb from day 12. ATT of CL4 T cells was given on day 12. The killing of KdHA-pulsed Renca mCherry
tumor cells by day 16 ex vivo CL4 TIL is given at an E:T ratio of 3:2. Each point = 1 tumor, N = 2 experiments. Size-matched tumors analyzed on the same day
are paired for comparison using a t-test. g Growth of the tumors used for killing analysis in f are shown as two separate experiments. h, i Half of the size-
matched tumors from mice in e and g were stained. h A representative image with CD8 staining in red and Thy1.1 staining in green. scale bar = 50 µm. i The
numbers of (left panel) endogenous Thy1.2+CD8+ TIL and adoptively transferred Thy1.1+ Clone 4 TIL or (right panel) total CD8+ TIL and FOXP3+
regulatory T cells in ten peripheral and ten central tumor areas are given. N = 2 control tumors and three treated tumors analyzed over two experiments.
Size-matched tumors fixed on the same day are paired for analysis using a t-test. Source data are provided in Supplementary Data 4.
co-cultures with the A2AR agonist CGS-21680 at 1 µM36 36 ± 9% and 29 ± 4%, respectively (p < 0.001) (Fig. 7c). This
(Fig. 6c–e). Such treatment led to a significant (p < 0.05) reduction enhancement was reversed by parallel treatment with ZM 241385
of CL4 CTL infiltration into the spheroids to about half of the level at 1.25 µM. NECA and ZM 241385 at the concentrations used
of infiltration seen with the vehicle only control (Fig. 6c, e), engage both A2AR and A2BR35. However, as A2AR mRNA
consistent with previously described enhancement of CTL infil- expression in T cells is several-fold higher than that of A2BR and
tration into tumors upon A2AR antagonist treatment24 and in A2AR-deficient lymphocytes don’t elevate cAMP in response to
A2AR-deficient mice22. In CGS-21680 treated spheroids, Renca adenosine any more20, the induction of CL4 T cell translocation
cell death was drastically diminished reaching only 16% of control and the reversion thereof are most likely mediated by A2AR.
at the 12 h time point (p < 0.005) (Fig. 6d, e). As the effect of CGS- Similarly, off-interface lamellae became more frequent upon CL4
21680 on killing is substantially greater than the effect on infil- CTL treatment with NECA and formed more rapidly, as both
tration, reduced spheroid infiltration can only partially account for partially reversed by parallel treatment with ZM 241385 (Fig. 7d).
reduced tumor cell death upon treatment with the A2AR agonist. Together these data establish that engagement of A2AR on CTL
Therefore, A2AR likely also impairs the execution of tumor cell suppresses cytoskeletal polarization at multiple stages of CTL
killing. In combination, the spheroid data establish that A2AR and function, migration, cell couple formation and the maintenance
TIM3 directly suppress the ability of CL4 T cells to kill tumor of a fully polarized cell couple. These data corroborate a cytos-
target cells with an additional inhibitory effect of A2AR in reducing keletal mechanism for A2AR-mediated suppression of TIL func-
CTL infiltration. tion. They also constitute an interesting contrast to PD-1, as
investigated in the same experimental system7. As CTL con-
Adenosine impairs CTL cytoskeletal polarization. Restoration stitutively express PD-1 and Renca cells PD-L1, we used anti-PD-
of cytoskeletal polarization and increased tumor infiltration were 1 to investigate the role of PD-1 in cytoskeletal polarization.
potential mechanisms of immune enhancement in vivo in TIL Rather than restoring CL4 CTL and ex vivo TIL cytoskeletal
from tumors treated with the A2AR antagonist ZM 241385 polarization as expected for blocking an inhibitory interaction,
together with anti-TIM3 mAb. To determine the direct roles of anti-PD-1 increased the frequency of occurrence of off-interface
A2AR in cytoskeletal polarization and CTL effector function, we lamellae and the translocation phenotype7. In addition, calcium
investigated CL4 CTL function in vitro (Fig. 1). Migratory T cells signaling was impaired not enhanced7. The inhibition of cytos-
extend a leading lamella and form a uropod at the posterior end. keletal polarization in the direct interaction of CTL with their
CL4 CTL treatment with the A2AR agonist CGS-21680 at 1 µM target cells by A2AR thus is in contrast to the stimulatory role of
reduced the percentage of CL4 T cells with a uropod from PD-1.
80 ± 4% in control-treated CL4 CTL to 25 ± 5% (p < 0.001) Cytoskeletal polarization also contributes to CTL signaling and
(Fig. 7a), indicative of suppression of the migratory phenotype. effector function other than migration and killing. We therefore
These data are consistent with the suppression of CL4 CTL investigated CTL calcium signaling and naïve T cell proliferation.
spheroid infiltration upon treatment with CGS-21680 (Fig. 6c). The elevation of the cytoplasmic calcium concentration in CL4
Formation of a tight cell couple of a CTL with a tumor cell is the CTL upon interaction with KdHA peptide pulsed Renca tumor
first step of killing and requires the effective extension of lamellae target cells was partially inhibited by treatment with 1 µM CGS-
towards the target cell as a cytoskeletal polarization step. Upon 21680 (Fig. 7e). Proliferation of naïve CL4 T cells upon
treatment with CGS-21680 the frequency of CL4 CTL forming a stimulation with anti-CD3/CD28 was partially inhibited by
tight cell couple upon contact with RencaHA target cells was 1 µM or 20 µM NECA, as reversed with parallel treatment with
significantly (p < 0.01) reduced from 49 ± 6% upon control the A2AR antagonist ZM 241385 at 1.25 µM without reaching
treatment to 32 ± 7% (Fig. 7b). In CTL tumor cell couples, T cell statistical significance (Fig. 7f). An only moderate effect of A2AR
translocation over the tumor target cell surface and off-interface on T cell proliferation has been previously reported19. A
lamellae are defining cytoskeletal features of suppressed TIL. determination of whether these defects are secondary to impaired
Treatment of CL4 CTL with 1 µM or 10 µM of the pan-adenosine cytoskeletal polarization or independent thereof is beyond the
receptor agonist NECA enhanced the percentage of CL4 CTL that scope of this manuscript. Such defects, albeit moderate in size,
translocated over the tumor target cell surface from 4 ± 2% to may contribute to the immune-suppressive function of A2AR.
COMMUNICATIONS BIOLOGY | (2022)5:9 | https://doi.org/10.1038/s42003-021-02972-8 | www.nature.com/commsbio 9ARTICLE COMMUNICATIONS BIOLOGY | https://doi.org/10.1038/s42003-021-02972-8
a b
4 6 8 10 12
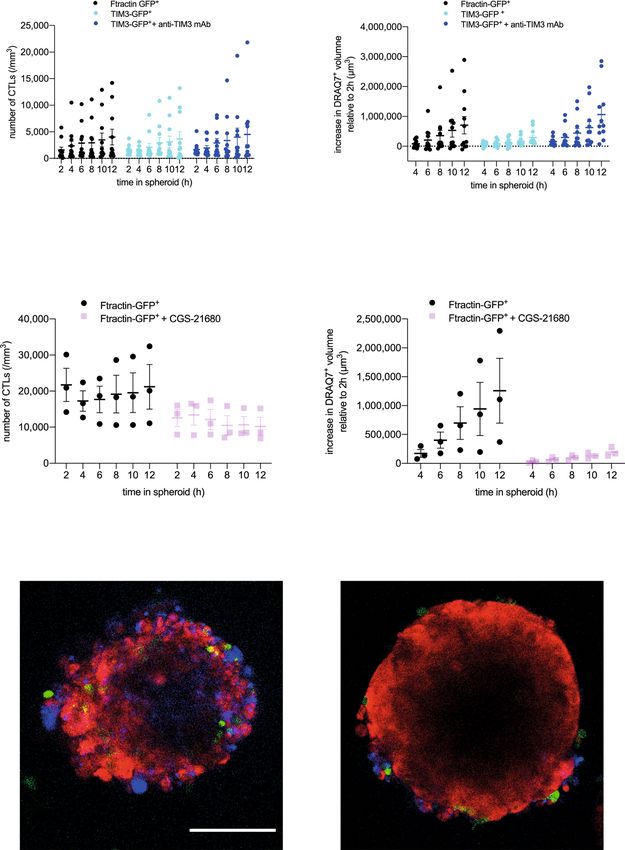
Ftractin vs TIM3COMMUNICATIONS BIOLOGY | https://doi.org/10.1038/s42003-021-02972-8 ARTICLE Fig. 6 A2AR and TIM3 suppress infiltration and killing of tumor spheroids by CTL. a, b CTL retrovirally transduced to express TIM3-GFP or F-tractin-GFP as control were cocultured with RencaHA tdTomato spheroids incubated with KdHA peptide for 12 h ± 10 µg/ml anti-TIM3 mAb (clone RMT3-23) with images acquired every 2 h. Each data point is an independent experiment (N = 11) with five or six spheroids analyzed per independent experiment. a SIL densities are shown with the mean ± SEM. b Spheroid death, as measured by the increase in DRAQ7+ spheroid volume, is shown for the same experiments as in a. c, d CL4 CTL transduced to express F-tractin-GFP were cocultured with RencaHA tdTomato spheroids ±1 µM CGS-21680. Each data point is an independent experiment (N = 3) with three spheroids analyzed per independent experiment. c CL4 T cell densities are shown as mean ± SEM. d Spheroid death, as measured by the increase in DRAQ7+ spheroid volume, is shown for the same experiments as in c. All data were analyzed by 2-Way ANOVA, matched by independent repeat and time point. e Representative images of RencaHA tdTomato spheroids (red) with F-tractin-GFP-expressing CL4 CTL (green) as stained for cell death with DRAQ7 (blue) ± 1 µM CGS-21680 as indicated. scale bar = 100 µm with the same scale for both images. Entire imaging data are available as detailed in the data availability statement. Source data are provided in Supplementary Data 5. cytoskeletal polarization to diminished killing. However, while relapsed/refractory solid tumors (Eli Lilly) and Sabatolimab diminished killing is a plausible explanation for the in vivo (MGB453) in combination with anti-PD-1 in advanced solid effects of TIM3 and A2AR, only by direct in vivo manipulation tumors (Novartis)46,47. Currently, there are at least four A2AR of cytoskeletal polarization, in future experiments, one can antagonists which are in Phase II trials, NIR-178 (Novartis) with prove that such impaired polarization limits tumor immunity. anti-PD-1 in multiple solid tumors and diffuse large B-cell lym- The engagement of a TCR by its physiological cognate MHC/ phoma, PBF-509 (Novartis) in non-small cell lung carcinoma peptide ligand is critical for the investigation of cytoskeletal with anti-PD-1, NCT02754141 (Astra Zeneca) with anti-PD-L1 regulation38. To allow such TCR engagement, the experiments and anti-CD73 in prostate cancer and an A2A/A2B antagonist here were conducted in a murine system. Previous work on AB928 (Arcus Biosciences) with chemotherapy in pancreatic adenosine and TIM3 suggests that findings are likely to be cancer48. Our work may provide an incentive to include the directly applicable in humans. For example, the preclinical investigation of CTL polarization as an integral part of such trials. efficacy of A2AR antagonists which are now licensed for control Despite the promise of targeting TIM3 and AAR in early of Parkinson’s disease was initially established in mice39,40. clinical trials, it is still unclear whether or not blocking A2AR and/ Elevated expression of TIM3 on Th1 cells is observed in both or TIM3 will lead to fewer autoimmune side effects. Adenosine, multiple sclerosis and its established mouse model of experi- A2AR and TIM3 not only suppress T cell function but also that of mental autoimmune encephalitis and is required for the sup- myeloid cells49,50. However, effects of adenosine in myeloid cells pression of autoimmunity41. Moreover, the blocking anti-TIM3 may be mediated by another adenosine receptor, A2BR51. A2AR antibody used here targets the same phosphatidylserine- expression in T cells also contributes to thymic development and binding site of TIM3 as an antibody currently in clinical in the maintenance of a quiescent state among naïve T cells52. trial41. However, while human anti-TIM3 antibodies pursued Autoimmunity upon melanoma rejection in A2AR-deficient mice therapeutically are largely Fc receptor-silent27, the rat IgG2a has been observed19. Nevertheless, approval of the A2AR subclass of the anti-TIM3 antibody RMT3-23 used here does antagonist Istradefylline for the treatment of Parkinson’s effectively engage Fcγ receptors and can thus trigger corre- Disease53 and several early phase clinical trials of the A2AR sponding effector functions. Thus, these caveats need to be antagonist CPI-444 in cancer indicate that autoimmune side considered when translating our findings into therapeutic effects of A2AR blockade can be minimal. development. CTLA-4 and PD-1 have the greatest efficacy in tumors that Nevertheless, the focus on a direct effect of checkpoint block- possess large numbers of infiltrated CD8+ TIL, which are pre- ade regimens on CTL responses is important as a complement to dominantly suppressed by inhibitory receptor expression13. How- current inhibitory receptor blockade therapies. CTLA-4 and PD-1 ever, such ‘hot’ tumors represent only a minority of all cancer types, blockade improve the anti-tumor immune response amongst prominently melanomas. In contrast, cold tumors lack an immune patients with melanoma, NSCLC, and hematological cancers13,42, infiltrate almost entirely. In altered immunosuppressed and altered- however, frequently with substantial adverse immunological excluded tumors cancer-specific CTL priming and infiltration do effects. PD-1 and CTLA-4 are expressed during T cell differ- occur but tumor-mediated immune suppression, rather than relying entiation and by CTL throughout the body. Moreover, they are predominantly on inhibitory receptors, employs alternate sup- expressed by other cell types, such as myeloid cells and regulatory pressors such as adenosine and prostaglandin E2, Tregs, and inhi- T cells, respectively. Action on myeloid cell types and the gen- bitory cytokines such as IL-10 and TGF-β13. Moreover, infiltration eration of new T cell clones at priming, potentially including of CTL into tumors can often be partial, reaching only the per- autoreactive ones, maybe a principal mechanism of PD-1 and ipheral stromal regions of the tumor mass. Therapeutic approaches CTLA-4 blockade with only secondary effects on CTL killing43,44: to increase tumor infiltration by CTL are therefore important in In basal and squamous cell carcinoma patients, anti-PD-1 does extending immunotherapy to cold and altered phenotype cancers. not lead to the activation of existing anti-tumor T cell clones but CTL tumor infiltration is enhanced in A2AR-deficient mice, mice to tumor enrichment of new ones6. In a mouse melanoma model with selective A2AaR deletion in T cells and upon A2AR agonist deletion of PD-1 in T cells does not enhance anti-tumor immu- treatment, albeit in experiments using hot mouse tumor nity; however, deletion of PD-1 in myeloid cells does5. We models22–24. In various mouse models, CD73 activity on non- showed that blocking PD-1 in the in vitro interaction between hematopoietic cells limited tumor infiltration of T cells54. Increased CTL and tumor cells actually impaired, rather than improved, tumor infiltration of CD8+ CTL upon A2AR blockade may occur killing and the necessary cytoskeletal polarization steps7. The because A2AR regulates the endothelium55. In addition, CTL- direct role of A2AR and TIM3 in regulating CTL—tumor cell intrinsic mechanisms of enhanced tumor infiltration are likely. We interaction thus generates a promising contrast to PD-1 and showed that A2AR engagement could efficiently block CL4 CTL CTLA-4. Accordingly, A2AR antagonists and anti-TIM3 are infiltration of spheroids (Fig. 6c). A2AR engagement directly sup- already explored in early-stage clinical trials, often in combina- presses CD8+ T cell migration through inhibition of the KCa3.1 ion tion with anti-PD-127,45. Anti-TIM3 mAb which has recently channel56. Adenosine may also regulate the infiltration of other in completed Phase I trials include LY3321367 in advanced immune cell types, as blockade of CD73 leads to increased dendritic COMMUNICATIONS BIOLOGY | (2022)5:9 | https://doi.org/10.1038/s42003-021-02972-8 | www.nature.com/commsbio 11
ARTICLE                                                                       COMMUNICATIONS BIOLOGY | https://doi.org/10.1038/s42003-021-02972-8

              a                                         buffer only                                b

                                                                          T
                                                              T

                                                                          T           T
                                                          T

                                                        CGS-21680

                                                                      T           T
                                                                              T       T
                                                                  T   T

                                                                              T       T
                                                         T

              c                                                                       d

              e                                                                                f

Fig. 7 A2AR suppresses the cytoskeletal polarization of CTL. a Percentage of in vitro CL4 CTL with a uropod ± 1 µM CGS-21680 ± SEM. N = 4 independent
experiments, 220/648 T cells analyzed. Representative images of CL4 T cells (labeled with ‘T’) in a field with Renca APC treated ± 1 µM CGS-21680. Arrows
indicate uropods. Scale bar = 5 µm. b Frequency of CL4 T cells that form a tight cell couple upon contact with a Renca APC incubated with 2 µg/ml KdHA
peptide ± SEM. N = 2 independent experiments, 68/234 T cells analyzed. c, d Imaging of the interaction between in vitro CL4 CTL with KdHA-pulsed Renca
tumor cell targets treated with NECA ±1.25 μM A2aR antagonist ZM 241385. c Percentage of cell couples with translocation (1-way ANOVA) ±SEM. N = 28-
132 cell couples per condition over ≥2 experiments. Alternate analysis of pooled data by proportion’s z-test yields p < 0.001 for all comparisons between NECA
only-treated and control or ZM 241385-treated samples. d Time until the formation of first off-interface lamella (Kaplan–Meier survival analysis (Log Rank)).
P < 0.01 all comparisons. e In vitro CL4 CTL interacted with RencaHA cells incubated with 2 µg/ml KdHA peptide ± 1 µM CGS-21680. The ratio of Fura-2
emissions at 510 nm upon excitation at 340 nm over 380 nm is given relative to time of tight cell coupling as the mean ± SEM. N = 2 independent experiments,
13/42 T cells analyzed. f CL4 T cells were primed in vitro using anti-CD3/CD28 mAb. NECA ± 1.25 µM ZM 241385 were added at 0 h and 3H-thymidine for the
last 8 h of cell culture. Proliferation was quantified by 3H-thymidine incorporation (cpm) and is given as the mean ± SEM (N = 3 experiments). Source data are
provided in Supplementary Data 6 (all but the calcium data) and Supplementary Data 7 (calcium data).

cell infiltration in the context of radiotherapy of poorly immuno-                     between different elements of tumor-mediated immune suppres-
genic tumors50.                                                                       sion has been described before, e.g. in the upregulation of A2AR
   Blockade of A2AR led to compensatory upregulation of inhibi-                       expression upon PD-1 blockade58. Curiously, blocking A2AR dur-
tory receptor expression as previously noted15,57. Compensation                       ing vaccination leads to diminished inhibitory receptor expression

12                           COMMUNICATIONS BIOLOGY | (2022)5:9 | https://doi.org/10.1038/s42003-021-02972-8 | www.nature.com/commsbio
COMMUNICATIONS BIOLOGY | https://doi.org/10.1038/s42003-021-02972-8 ARTICLE
on T cells21. In a model of colon cancer, A2AR blockade does not LAG3 PeCy7 C9B7W eBioscience 1:200 discontinued
alter PD-1 expression on CD8+ TIL but reduced it on T cells in the PD1 BV785 29 F.1A12 BioLegend 1:200 RRID:AB_2563680
TCRβ AF647 H57-597 BioLegend 1:200 RRID:AB_493346
tumor-draining lymph nodes21. Effects of A2AR blockade on Thy1.1 FITC OX-7 BD Bioscience 1:100 RRID:AB_395588
inhibitory receptor expression thus may be context dependent. Thy1.1 PerCP-Cy5.5 OX-7 BioLegend 1:100 RRID:AB_961438
A key mechanism of A2AR and TIM3 in regulating CTL CEACAM1 APC CC1 BioLegend 1:100 RRID:AB_2632612
function is the suppression of cytoskeletal polarization in T cell For blocking and T cell priming
migration and target cell killing. We can only speculate on TIM3 no azide (for in vitro/in vivo blockade) RMT3-23 BioXcell In Vivo mAb
in vivo: 100 μg/mouse in vitro: 10 μg/ml RRID:AB_10949464
underlying signaling mechanisms. In principle, two scenarios are Isotype control for anti-TIM3 Rat IgG2a 2A3 no azide (for in vivo/in vitro
conceivable. A2AR and/or TIM3 could trigger signaling pathways blockade) BioXcell In Vivo mAb in vivo: 100 μg/mouse in vitro: 10 μg/ml
that directly regulate cytoskeletal dynamics. Alternatively, these RRID:AB_1107769
receptors could modulate general proximal T cell signaling that is CD8β no azide (for in vivo depletion) 53-5.8 BioXcell InVivoMAb 100 μg/
mouse RRID:AB_2687706
known to control cytoskeletal dynamics. Consistent with direct Thy1.1 no azide (for in vivo depletion) 19E12 BioXcell InVivoMAb 250 μg/
cytoskeletal regulation, A2AR signaling through cAMP/protein mouse RRID:AB_2687700
kinase A results in inhibition of RhoA and Cdc42 in leukocytes CD3ε no azide (for in vitro priming) 145-2C11 BioXcell InVivoMAb 10 μg/ml
during cell-cell adhesion59. In cardiomyocytes, adenosine receptor RRID:AB_1107634
CD28 no azide (for in vitro priming) 37.51 BioXcell InVivoMAb 1 μg/ml
agonists prevent RhoA activation and cofilin-mediated actin RRID:AB_1107624
polymerization60. Alternatively, A2AR binds α-actinin61. Such For immunohistochemistry:
binding could lead to the sequestration of α-actinin whose FcBlock no azide (for blockade of Fc receptors) 2.4G2 BD Biosciences 1:50
recruitment to the T cell/APC interface is required for effective T RRID:AB_2870673
CD8α no azide 53-6.7 BioLegend 1:500 RRID:AB_312741
cell polarization62. Consistent with modulation of general prox- Rabbit H + L AF488 Life Technologies 1:1000 RRID:AB_143165
imal T cell signaling, A2AR and TIM3 could converge on the Rabbit H + L AF405 Life Technologies 1:1000 RRID:AB_221605
tyrosine kinase Lck. Elevated cAMP levels in response to A2AR Rat IgG2a,κ BioLegend 1:500 RRID:AB_326523
engagement can enhance Csk activity15,63, leading to inhibitory Rat IgG H + L AF594 ThermoFisher 1:2000 RRID:AB_141374
phosphorylation of Lck. When not engaged by ligand, TIM3 binds FOXP3 no azide FJK-16S ThermoFisher 1:100 RRID:AB_467575
FOXP3 APC FJK-16S ThermoFisher 1:40 RRID:AB_469457
BAT3, a molecule that maintains a reservoir of Lck at the immune Thy1.1 FITC OX-7 BD Bioscience 1:100 RRID:AB_395588
synapse and thus lowers the threshold for TCR signaling. TIM3 Isotype control for Thy1.1 Mouse IgG1,κ FITC BD Bioscience 1:100
binding to Galectin-9 or CEACAM-1 releases BAT3, disabling Lck RRID:AB_395505
pre-localization at the immunological synapse64. Also consistent CD19 (dump) BV510 6D5 BioLegend 1:100 RRID:AB_2562136
TCRβ SB645 H57-597 ThermoFisher 1:200 RRID:AB_2723704
with TIM3-mediated regulation of general proximal T cell sig- CD4 PE-Cy5.5 RM4-5 ThermoFisher 1:3000 RRID:AB_1121830
naling, Y256 and Y263 of the TIM3 cytoplasmic domain are CD8β PE-Cy5 H35-17.2 ThermoFisher 1:3000 RRID:AB_657770
phosphorylated in response to T cell activation, can associated CD25 VioBright-FITC 7D4 Miltenyi 1:200 RRID:AB_2784091
with the Src family kinase Fyn and the p85 subunit of phospha- CD73 BV605 TY/11.8 BioLegend 1:100 RRID:AB_2561528
CD39 PerCP-eFluor710 24DMS1 ThermoFisher 1:100 RRID:AB_10717953
tidylinositol 3-kinase and lead to elevated tyrosine phosphoryla-
tion of phospholipase C γ165. Phospholipase C γ1-dependent
Cell culture. Murine Renal Carcinoma cell line (RRID:CVCL_2174) and Phoenix
generation of diacylglycerol is a key regulator of multiple steps in retrovirus-producing cell line (RRID:CVCL_H717) were maintained as previously
cytoskeletal polarization66. While we have consistently related described7.
A2AR and TIM3 engagement to impaired cytoskeletal polarization To generate in vitro CL4 CTL, CL4 mouse spleens from 6-12-week-old male or
here, future work will be required to establish the signaling female mice were macerated. Red blood cells were lysed using ACK Lysis buffer
mechanisms that underpin this relationship. (Gibco, ThermoFisher, Gloucester UK), and the remaining splenocytes were
resuspended in complete medium, RPMI-1640 with 10% FBS and 50 µM
In summary, our work supports blocking of A2AR and TIM3 as 2-mercaptoethanol. 5 × 10⁶ cells were seeded into each flat bottomed 24 well tissue
an attractive complement to PD-1 and CTLA-4 blockade in anti- culture plate with 1 μg/ml of KdHA peptide (IYSTVASSL[518-526]) from influenza
tumor immunotherapy. A2AR and TIM3 blockade directly virus A/PR/8/H1N1, for 24 h at 37 °C. After 24 h, cells were washed five times in
enhanced the ability of CTL to polarize towards and kill tumor RPMI (Gibco) and reseeded into 24 well plates at 5 × 10⁶ cells per well in 2 ml
complete medium containing 50 units/ml of recombinant human IL-2 (National
target cells in tumors and tumor spheroids and may thus reac- Institutes of Health/NCI BRB Preclinical Repository). Retroviral transduction was
tivate tumor-resident suppressed CTL. In addition, regulation of performed if required as previously described7. CL4 T cells were then passaged
tumor and spheroid infiltration by A2AR promises therapeutic every 12–24 h using fresh IL-2 containing complete medium. Where indicated, 1 or
potential in cold and altered immunity tumors. 10 µM NECA (Sigma), 1.25 µM ZM 241385 (Santa Cruz), or 1 µM CGS-21680
(Tocris) were added to cell culture. DMSO was used as vehicle control. ZM 241385
properties, including selectivity for adenosine receptors, are detailed at https://
Materials and methods www.abcam.com/zm-241385-a2a-antagonist-ab120218.html.
Mice. Thy1.2+/+ BALB/c, (Charles River, Oxford, UK) and Thy1.1+/+ CL4 TCR For 3H-thymidine proliferation assays67, Clone 4 T cells were primed using
transgenic mice [Research Resource Identifier (RRID): IMSR_JAX:005307] were anti-CD3/CD28 mAb stimulation or with mature agonist-peptide pulsed dendritic
maintained at the University of Bristol Animal Services Unit. All mouse experi- cells in a flat bottomed 96 well plate and cultured for the desired time at 37 °C.
ments were compliant with UK Home Office Guidelines under PPL 30/3024 to 3H-thymidine (Amersham Life Science, London, UK) was added for the final 8 h of
DJM as reviewed by the University of Bristol AWERB (Animal welfare and ethical cell culture at 1.45 mBq/ml. To harvest, the entire plate was frozen at −20 °C for at
review body) committee. least 24 h and subsequently defrosted to produce cell lysis. 3H-thymidine
incorporation was measured using a 96 well Tomtec harvester and a Microbeta
scintillation counter (PerkinElmer).
Antibodies. Antibodies used are described in the order: antigen, fluorescent label, Extraction of T cells from tumor tissue was carried out using magnetic-activated
clone, supplier, dilution, RRID:
cell sorting (Miltenyi) and flow cytometry7.
For flow cytometry:
FcBlock no azide (for blockade of Fc receptors) 2.4G2 BD Biosciences 1:50
RRID:AB_2870673 Tumor growth and treatment experiments. Six-week-old Thy1.2+/+ BALB/c
CD8α FITC 53-6.7 BD Bioscience 1:100 RRID:AB_394569 mice were injected subcutaneously, in the dorsal neck region, with 1 × 10⁶
CD8β PeCy7 YTS156.7.7 BioLegend 1:200 RRID:AB_2562777 RencaHA tumor cells in 100 μl PBS. Tumor measurements and treatment com-
CD4 AF700 CK1.5 BioLegend 1:100 RRID:AB_493698 menced at day 12, when tumors of ~5 × 5 mm diameter were palpable. For adoptive
CD39 PerCP-Cy5.5 24DMS1 eBioscience 1:100 discontinued transfer experiments, tumor-bearing mice were injected i.v. at day 12, with 5 × 10⁶
CD73 BV605 TY/11.8 BioLegend 1:100 RRID:AB_2561528 day 5 CL4 CTL (see above). For in vivo immunotherapy, control mice received
TIM3 PE B8.2C12 BioLegend 1:100 RRID:AB_1626177 100 μl vehicle (15% vol/vol DMSO, 15% vol/vol Cremophore EL, 70% vol/vol
TIM3 BV605 RMT3-23 BioLegend 1:100 RRID:AB_2616907 PBS) ± 100 μg/mouse isotype control (Rat IgG2a, 2A3, BioXcell InVivoMAb)68.
TIGIT APC 1G9 BioLegend 1:100 RRID:AB_10962572 Treated mice received combinations of 10 mg/kg ZM 241385 injected
COMMUNICATIONS BIOLOGY | (2022)5:9 | https://doi.org/10.1038/s42003-021-02972-8 | www.nature.com/commsbio 13You can also read