Adelaide Landing EAW APPENDIX Traffic Impact Analysis for - City of Hugo
←
→
Page content transcription
If your browser does not render page correctly, please read the page content below
EAW APPENDIX
Traffic Impact Analysis for

Adelaide Landing

A Premier Residential Development
Located North of 130th Street North
And East of US 61
Hugo, Minnesota

Prepared for:                         Prepared by:
The Excelsior Group, LLC              Westwood Professional Services
1660 Highway 100 South                7699 Anagram Drive
Suite 400                             Eden Prairie, MN 55344
Saint Louis Park, MN 55416            (952) 937-5150
(612) 353-3307
Adelaide Landing Residential Development                                                       1/31/2017
Traffic Impact Analysis

                                    Traffic Impact Analysis for
                            Adelaide Landing
                                            Hugo, MN

                                      January 31, 2017

                   I hereby certify that this plan, specification, or report was prepared by
                   me or under my direct supervision and that I am a duly Licensed
                   Professional Engineer under the laws of the State of Minnesota.

                   Print Name: _____________Stephen J. Manhart___________

                   Signature: ________________________________________

                   Date: __01/31/2017___        License # _____22428________

                                                      ii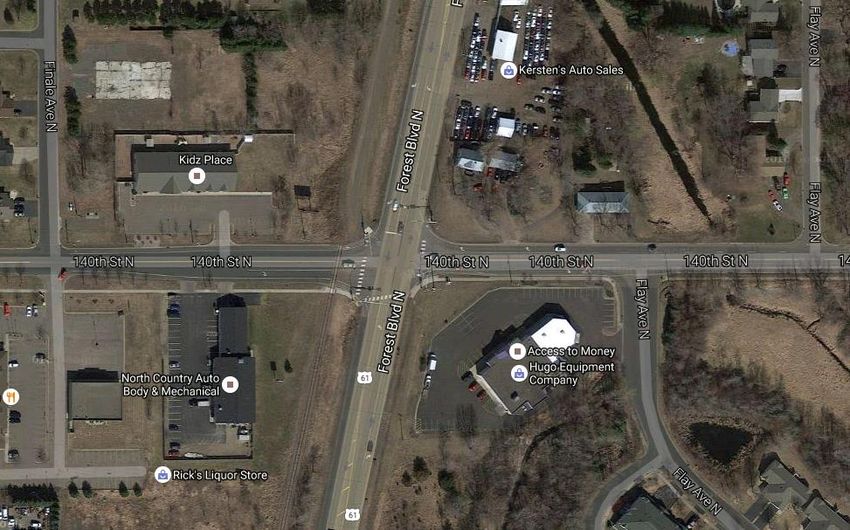
Adelaide Landing Residential Development 1/31/2017
Traffic Impact Analysis
Project Number: R0008463.00
Date: 1/31/2017
CONTENTS
Certification Page ........................................................................................................................................ ii
List of Figures ........................................................................................................................................... iii
List of Tables ........................................................................................................................................... iv
List of Appendices ........................................................................................................................................ iv
INTRODUCITON ............................................................................................................................... 1
EXISTING CONDITIONS .................................................................................................................... 3
FUTURE YEAR FORECASTS............................................................................................................. 19
DEVELOPMENT IMPACTS .............................................................................................................. 28
MITIGATION PLAN......................................................................................................................... 39
APPENDIX ................................................................................................................................... 45
FIGURES
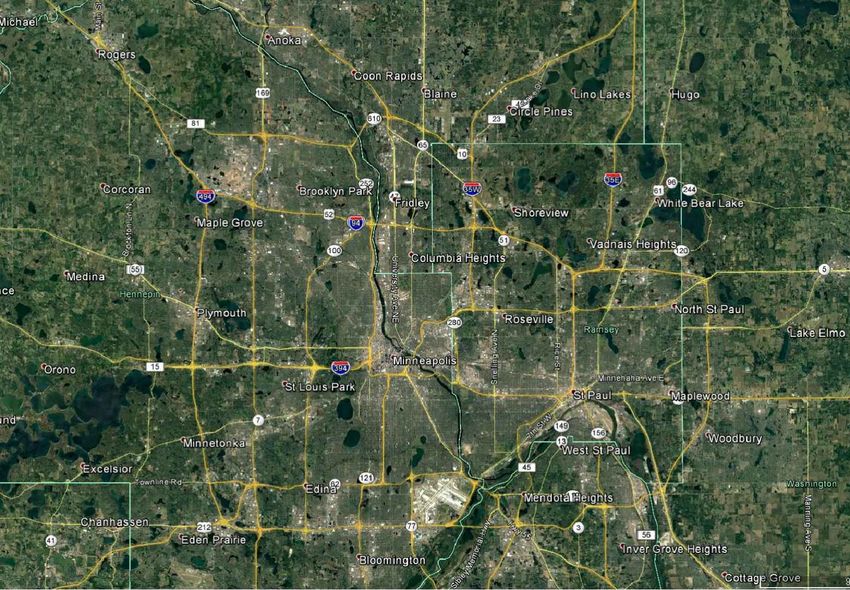
Figure 1: Site Location .................................................................................................................................. 2
Figure 2: Existing Traffic Volumes .............................................................................................................. 13
Figure 3: 2022 No Build Traffic................................................................................................................... 20
Figure 4: 2040 No Build Traffic Volumes.................................................................................................... 22
Figure 5: Trip Distribution .......................................................................................................................... 30
Figure 6: Trip Assignment .......................................................................................................................... 31
Figure 7: 2022 Build Traffic Volumes ......................................................................................................... 32
Figure 8: 2040 Build Traffic Volumes ......................................................................................................... 35
Figure 9: Proposed Geometry .................................................................................................................... 42
iii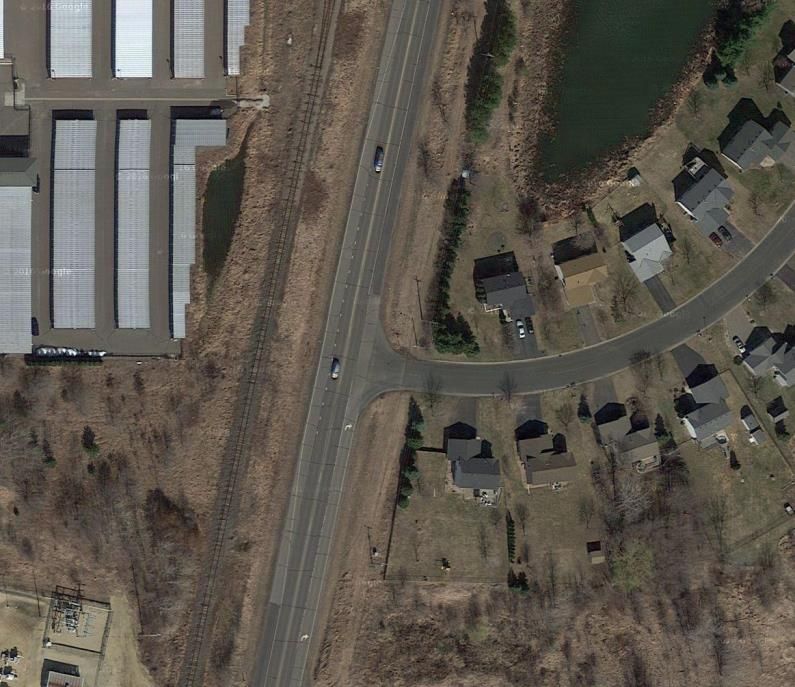
Adelaide Landing Residential Development                                                                               1/31/2017
 Traffic Impact Analysis

                                                            TABLES

Table 1: Comparison of Turning Movement Counts along TH 61 at 130th Street North ........................... 14
Table 2: Level of Service vs. Control Delay – Signalized and Unsignalized Intersections .......................... 16
Table 3: Existing Level of Service & Critical Queue Lengths ...................................................................... 18
Table 4: 2022 No-Build Level of Service & Critical Queue Lengths ........................................................... 21
Table 5: 2040 No-Build Level of Service & Critical Queue Lengths ............................................................ 23
Table 6: 2040 No-Build Level of Service & Critical Queue Lengths – 4 Lanes on TH 61............................. 25
Table 7: Adelaide Landing Development Phasing ...................................................................................... 28
Table 8: Adelaide Landing Trip Generation Potential ............................................................................... 28
Table 9: 2022 Build Level of Service & Critical Queue Lengths .................................................................. 33
Table 10: 2040 Build Level of Service & Critical Queue Lengths ................................................................ 36
Table 11: 2040 Build Level of Service & Critical Queue Lengths – 4 Lanes on TH 61 ................................ 41

                                           TECHNICAL APPENDICES

Technical Appendix I: Crash Analysis

Technical Appendix II: MnDOT LRRB Turn Lane Design Checklist

Technical Appendix III: Synchro/SimTraffic Performance and Queuing Output

                                                                  iv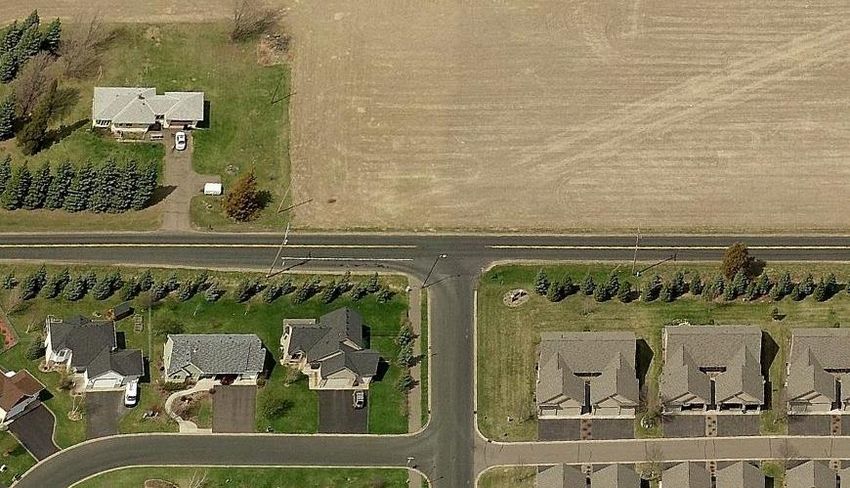
Adelaide Landing Residential Development 1/31/2017
Traffic Impact Analysis
INTRODUCITON
The following is a traffic impact analysis for a 217.5-acre premier residential development
called Adelaide Landing, proposed north of 130th Street North and east of US Trunk Highway 61
(TH 61) in the city of Hugo, Washington County, Minnesota (see Figure 1). The Excelsior Group
(Client) is proposing to construct 324 residential units on the site. Of that number, 91 lots are
proposed to comprise villa homes, 51 lots are proposed to comprise detached townhomes and
the remainder (182 lots) are proposed to comprise single-family homes. A small neighborhood
park is proposed at a midpoint of the housing.
The street system is proposed to be curvilinear with one main neighborhood collector running
north-south through the development with various local streets intersecting the north-south
street and serving small pockets of housing. While the development will propose no new direct
access intersections onto TH 61, the concept sketch plan for the site includes a connection to
existing 137th Street North that proceeds through another residential development and
intersects TH 61. Further, the Adelaide Landing Development proposes three intersections with
130th Street North at the south end of the site, which in turn provide direct access to TH 61.
Other development streets will connect with the existing residential street system to the north
and northeast of Adelaide Landing.
This analysis looked at the traffic operation of the study area during three time periods:
Existing condition (2016),
One year after full development (2025), and
Twenty-year timeframe (to 2040).
The following intersections will be assessed in this analysis:
TH 61 & 130th Street N 130th Street N & 129th Drive N (Mid
TH 61 & 134th Street N Site Access Street)
TH 61 & 137th Street N 130th Street N & East Site Access
Street
TH 61 & 140th Street N
140th Street N & Flay Avenue
130th Street N & West Site Access
Street/Flay Road
This analysis will address the potential for “cut-through” concerns, as well as pedestrian access
and crossings. Findings from this study will be compared with the results from previous studies
in the area, including the TH 61 Corridor Access Management Plan, the TH 61 at 130th Street
ICE Report and the City of Hugo Comprehensive Plan. A mitigation plan will be prepared that
will address the proposed development plan now and in the future.
1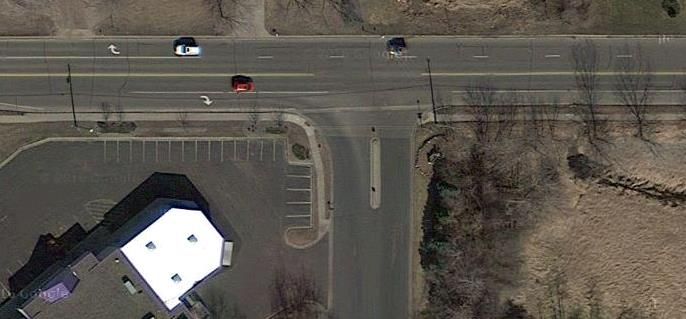
140th St
                                                                       Fl
                                                                         ay
                                                                              Av
                                                                                 e

                                                    137th St

                                                  134th St
                                        t Blvd)
                                     (Fores
                                   TH 61

              130th St
                                                             Flay Rd

Phone   (952) 937-5150   7699 Anagram Drive
Fax     (952) 937-5822   Eden Prairie, MN 55344
        (888) 937-5150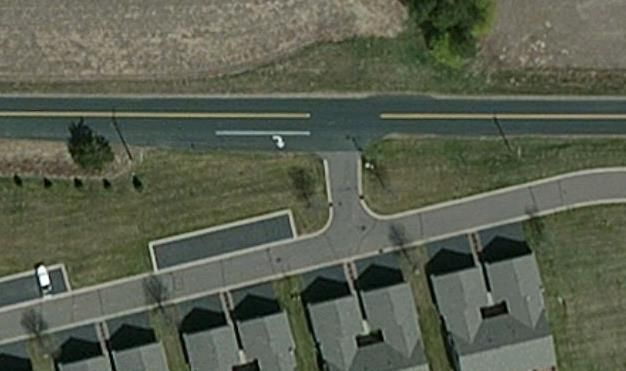
Adelaide Landing Residential Development 1/31/2017
Traffic Impact Analysis
EXISTING CONDITIONS
Westwood analyzed year 2016 roadway geometrics, traffic control and traffic operations for
the existing roadways and intersections in the study area.
Observations
The following discussion provides descriptions of existing conditions at each study intersection.
(NOTE: Crash data by type appears in the Appendix):
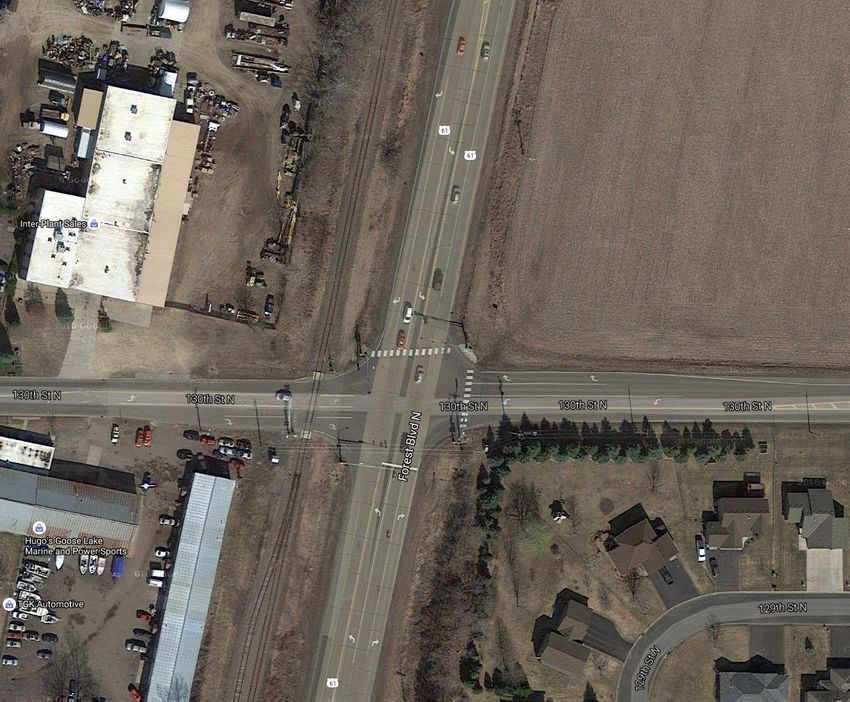
1. TH 61 & 130th Street N
a. Number of Through Lanes:
One through lane in each direction
b. Auxiliary Lanes and Effective Turn Bay Lengths:
Eastbound left turn lane – 230 ft.
Eastbound right turn lane – 130 ft.
3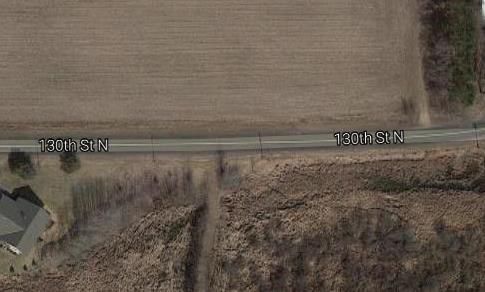
Adelaide Landing Residential Development 1/31/2017
Traffic Impact Analysis
Westbound left turn lane – 250 ft.
Westbound right turn lane – 145 ft.
Northbound left turn lane – 235 ft.
Northbound right turn lane – 250 ft.
Southbound left turn lane – 260 ft.
Southbound right turn lane – 300 ft.
c. Sight Lines:
Eastbound limited sight lines to the south as vehicles approach
intersection due to railroad crossing and parked vehicles; clear sight line
beyond tracks
Eastbound limited sight lines to the north as vehicles approach
intersection due to railroad crossing and vegetation; clear sight line
beyond tracks
Westbound limited sight lines to the south as vehicles approach
intersection due to pine trees along property lines, but sight but sight
exceeds AASHTO standards at crosswalk
Westbound sight lines to the north are unlimited
Northbound limited sight lines to the east as vehicles approach
intersection due to pine trees along property lines, but sight exceeds
AASHTO standards at stop bar
Northbound limited sight lines to the west as vehicles approach
intersection due to railroad crossing and parked vehicles but sight but
sight exceeds AASHTO standards at stop bar
Southbound limited sight lines to the west as vehicles approach
intersection due to railroad crossing and parked vehicles but sight but
sight exceeds AASHTO standards at crosswalk
Southbound sight lines to the east are unlimited
d. Crash History:
Intersection has recorded fourteen (14) crashes in the last five years, per
MnMCAT. (Collision Diagram appears in the Appendix.)
e. Traffic Control:
Intersection is signalized with protected-permissive phasing for left
turns. MnDOT’s current cycle lengths are 160 seconds in the a.m. peak
hour and 150 seconds in the p.m. peak hour. Pedestrian signals and
4Adelaide Landing Residential Development 1/31/2017
Traffic Impact Analysis
crosswalks appear across the north and east legs of the intersection.
There is signalized railroad crossing on the west leg of the intersection
approximately 50 feet to the west of the southbound lanes of TH 61.
Speed limit along TH 61 is 55 mph. Speed limit along 130 th Street west of
TH 61 is statutory 30 mph. The posted speed limit on 130th Street east of
TH 61 is 50 mph.
2. TH 61 & 134th Street N
a. Number of Through Lanes:
One through lane in each direction
b. Auxiliary Lanes and Effective Turn Bay Lengths:
Westbound – no designated turn lanes; street width of 32’ could
accommodate one WB left, one WB right and one EB through lane
Northbound right turn lane – 250 ft.
Southbound left turn/bypass lane – 250 ft.
c. Sight Lines:
Westbound limited sight lines to the north as vehicles approach the
intersection due to pine trees along property lines, but sight exceed
AASHTO standards at stop sign
5Adelaide Landing Residential Development 1/31/2017
Traffic Impact Analysis
Westbound limited sight lines to the south as vehicles approach the
intersection due to pine trees and fence along property lines, but sight
exceed AASHTO standards at stop sign
Northbound limited sight lines to the east as vehicles approach the
intersection due to pine trees and fence but sight exceed AASHTO
standards at approach to intersection
Southbound limited sight lines to the east as vehicles approach the
intersection due to pine trees but sight exceed AASHTO standards at
approach to intersection
d. Crash History:
Intersection has recorded three (3) crashes in the last five years, per
MnMCAT. (Collision Diagram appears in the Appendix.)
e. Traffic Control:
Intersection is side street stop controlled. Speed limit along TH 61 is 55
mph. Speed limit along 134th Street is statutory 30 mph.
3. TH 61 & 137th Street N
a. Number of Through Lanes:
One through lane in each direction
b. Auxiliary Lanes and Effective Turn Bay Lengths:
Westbound – no designated turn lanes; street width of 33’ could
accommodate one WB left, one WB right and one EB through lane
Northbound right turn lane – 210 ft.
6Adelaide Landing Residential Development 1/31/2017
Traffic Impact Analysis
Southbound left turn/bypass lane – 165 ft.
c. Sight Lines:
Westbound limited sight lines to the north as vehicles approach the
intersection due to trees along property lines, but sight exceed AASHTO
standards at stop sign
Westbound generally unlimited sight lines to the south
Northbound generally unlimited sight lines to the east
Southbound limited sight lines to the east as vehicles approach the
intersection due to railroad crossing and parked vehicles but sight
exceed AASHTO standards at approach to intersection
d. Crash History:
Intersection has recorded no (0) crashes in the last five years, per
MnMCAT.
e. Traffic Control:
Intersection is side street stop controlled. Speed limit along TH 61 is 55
mph. Speed limit along 137th Street is statutory 30 mph.
4. TH 61 & 140th Street N
7Adelaide Landing Residential Development 1/31/2017
Traffic Impact Analysis
a. Number of Through Lanes:
One through lane in each direction
b. Auxiliary Lanes and Effective Turn Bay Lengths:
Eastbound right turn lane – 175 ft.
Westbound right turn lane – 225 ft.
Northbound left turn lane – 180 ft.; right turn lane – 260 ft.
Southbound left turn lane – 250 ft.; right turn lane – 240 ft.
c. Sight Lines:
Eastbound generally unlimited sight lines to the north and south
Westbound generally unlimited sight lines to the north and south
Northbound generally unlimited sight lines to the east and west
Southbound generally unlimited sight lines to the east and west
d. Crash History:
Intersection has recorded twenty (20) crashes in the last five years, per
MnMCAT. (Collision Diagram appears in the Appendix.)
e. Traffic Control:
Intersection is signal controlled with protected/permitted phasing in the
northbound and southbound directions. MnDOT’s current cycle lengths
are 160 seconds in the a.m. peak hour and 150 seconds in the p.m. peak
hour. Speed limit along 130th Street is posted at 50 mph. Speed limit
along Flay Road is statutory 30 mph.
8Adelaide Landing Residential Development 1/31/2017
Traffic Impact Analysis
5. 130th Street N & Flay Road (proposed West Site Access Street)
a. Number of Through Lanes:
One through lane in each direction
b. Auxiliary Lanes and Effective Turn Bay Lengths:
Eastbound right turn lane – 100 ft.
Westbound turn lane – none
Northbound turn lane – none
c. Sight Lines:
Eastbound sight lines limited to the south by pine trees
Westbound sight lines limited to the south by pine trees
Northbound sight lines limited to the east and west by pine trees
d. Crash History:
Intersection has recorded no (0) crashes in the last five years, per
MnMCAT.
e. Traffic Control:
Intersection is stop sign controlled for northbound traffic. Speed limit
along 130th Street is posted 50 mph east of TH 61. Flay Avenue is
statutory 30 mph.
9Adelaide Landing Residential Development 1/31/2017
Traffic Impact Analysis
6. 130th Street N & 129th Drive N (Mid Site Access Street)
a. Number of Through Lanes:
One through lane in each direction
b. Auxiliary Lanes and Effective Turn Bay Lengths:
Eastbound right turn lane – 70 ft.
Westbound turn lane – none
Northbound turn lane – none
c. Sight Lines:
Eastbound sight lines relatively unlimited, although the street approach
to 130th is rather short and there is a tree to the south of 130th
Westbound sight lines relatively unlimited, although the street approach
to 130th is rather short and there is a tree to the south of 130th
Northbound sight lines generally unlimited to the east, but limited to the
west by low hanging tree branches beyond the eastbound right turn
lane.
d. Crash History:
Intersection has recorded no (0) crashes in the last five years, per
MnMCAT.
10Adelaide Landing Residential Development 1/31/2017
Traffic Impact Analysis
e. Traffic Control:
Intersection is stop sign controlled for northbound traffic. Speed limit
along 130th Street is posted 50 mph east of TH 61. 29th Drive N is
statutory 30 mph.
7. 140th Street N & Flay Avenue
a. Number of Through Lanes:
One through lane eastbound and northbound; two through lanes
westbound
b. Auxiliary Lanes and Effective Turn Bay Lengths:
Eastbound right turn lane – 160 ft.
Westbound turn lane – none marked, although approach has two
through lanes
Northbound turn lane – none marked, although approach is 24 feet wide
c. Sight Lines:
Eastbound sight lines are generally unlimited
Westbound sight lines limited to the south by trees
Northbound sight lines limited to the east by trees
d. Crash History:
Intersection has recorded one (1) crash in the last five years, per
MnMCAT. (Collision Diagram appears in the Appendix.)
11Adelaide Landing Residential Development 1/31/2017
Traffic Impact Analysis
e. Traffic Control:
Intersection is stop sign controlled for northbound traffic. Speed limit
along 130th Street is posted 50 mph east of TH 61. Flay Avenue is
statutory 30 mph.
8. 130th Street N & East Site Access Street
a. Number of Through Lanes:
One through lane in each direction
No intersection exists at this time
b. Auxiliary Lanes and Effective Turn Bay Lengths:
Westbound turn lane – none
Northbound turn lane – none
c. Sight Lines:
Not applicable at this time in either direction
d. Crash History:
Location has recorded no (0) crashes in the last five years, per MnMCAT.
e. Traffic Control:
Speed limit along 130th Street is posted 50 mph east of TH 61.
12XXXX
2,5
00
0
13,50
2,350
Phone   (952) 937-5150   7699 Anagram Drive
Fax     (952) 937-5822   Eden Prairie, MN 55344
        (888) 937-5150
Adelaide Landing Residential Development 1/31/2017
Traffic Impact Analysis
Data Collection
Westwood collected weekday a.m. and p.m. peak period turning movement counts at the
existing intersections identified above. These peak period turning movement volumes
appear on Figure 2. These counts were taken on August 2-3, 2016.
It has been reported that I-35E was under construction when these counts were taken.
Thus, a check was made to determine whether traffic volumes on TH 61 are higher than
typical volumes. A review of historical counts has shown a resulting change in patterns
shows variations in a.m. and p.m. peak hour movements along north bound and
southbound TH 61 (see Table 1).
Table 1: Comparison of Turning Movement Counts along TH 61 at 130th Street North
– 2011, 2012 and 2016
A.M. PEAK HOUR NB Left NB Thru NB Right SB Left SB Thru SB Right TOTAL
2/2/2011 69 178 25 11 796 58 1137
11/7/2012 70 206 20 10 816 69 1191
8/2-3/2016 14 287 21 78 735 78 1213
P.M. PEAK HOUR NB Left NB Thru NB Right SB Left SB Thru SB Right TOTAL
2/2/2011 111 823 96 15 381 18 1444
11/7/2012 79 717 95 29 410 26 1356
8/2-3/2016 37 759 69 235 568 74 1742
(Source: MnDOT Metro Intersection Count Website, and Westwood Professional Services)
The 2016 counts appear greater than those recorded in previous years. The difference in
volumes between 2011 and 2016 is a 1.3% annual growth rate for the a.m. peak hour.
Conversely, during the p.m. peak hours, the annual growth rate is 3.8% over the same time
period. This is despite the p.m. peak volume dropping in 2012.
14Adelaide Landing Residential Development 1/31/2017
Traffic Impact Analysis
Intersection Capacity Analysis
Traffic operations for the peak hour conditions within the study area were analyzed using
the industry-standard Synchro/SimTraffic Version 9 software package, which uses the data
and methodology contained in the 2010 Highway Capacity Manual, published by the
Transportation Research Board. The software model was calibrated to replicate existing
conditions as accurately as possible before being used to assess future conditions.
The operating conditions of transportation facilities, such as traffic signals, stop-controlled
intersections and roundabouts, are evaluated based on the relationship of the theoretical
capacity of a facility to the actual traffic volumes on that facility. Various factors affect
capacity, including travel speed, roadway geometry, grade, number and width of travel
lanes, and intersection control. The current standards for evaluating capacity and operating
conditions are contained in the 2010 Highway Capacity Manual (HCM). The procedures
describe operating conditions in terms of a Level of Service (LOS). Facilities are given letter
designations from A, representing the best operating conditions, to F, representing the
worst. Generally, Level of Service D (LOS-D) represents the threshold for acceptable overall
intersection operating conditions during a peak hour.
At intersections, Levels of Service are assigned differently for signalized or unsignalized
intersections (which include Two-Way Stop Control [TWSC], All-way Stop Control [AWSC]
and roundabouts). For signalized intersections, Level of Service is calculated by taking the
total Intersection Delay and converting it to a letter grade as shown in the right side of
Table 2. For an unsignalized intersection, Level of Service is calculated by taking the
Intersection Delay and converting it to a letter grade, as shown in the left side of Table 2.
While similar, the signalized control delay totals are higher than that of unsignalized
intersections. In any condition, when the LOS by Volume to Capacity Ratio exceeds 1.0, the
LOS is always F.
Under the 2010 HCM, common movements are included into lane groups. Control Delay is
then determined for each lane group and Levels of Service are based on this Control Delay.
For each lane group, Control Delay is quantified by number of seconds. Control Delay is
defined as the difference between the travel time that would have occurred in the absence
of the intersection control, and the travel time that results because of the presence of the
intersection control. Levels of Service are then based on the control delay per vehicle.
15Adelaide Landing Residential Development 1/31/2017
Traffic Impact Analysis
Table 2: Level of Service vs. Control Delay - Signalized and Unsignalized Intersections (TWSC,
AWSC & Roundabouts)
TWSC, AWSC & Roundabouts Signalized Intersections
Control Delay per Control Delay per
LOS by Volume to LOS by Volume to
Vehicle Vehicle
Capacity Ratio (≤ 1)* Capacity Ratio (≤ 1)*
(Seconds) (Seconds)
A ≤10 A ≤10
B >10 and ≤15 B >10 and ≤20
C >15 and ≤25 C >20 and ≤35
D >25 and ≤35 D >35 and ≤55
E >35 and ≤50 E >55 and ≤80
F >50 F >80
Per the 2010 Highway Capacity Manual, published by the Transportation Research Board.
* NOTE: When LOS by Volume to Capacity Ratio >1.00, LOS is F.
The acceptable Level of Service threshold for a particular movement at an intersection
depends on both the priority assigned to that movement and its traffic volume. In general,
the higher the priority and the higher the traffic volume, the more stringent the acceptable
threshold will be. For example, the acceptable threshold for a high-priority/high-volume
rural movement might be C, while LOS F on a low-priority/low-volume urban movement
might be appropriate.
For two-way stop-controlled intersections, a key measure of operational effectiveness is the
side street LOS. Since the mainline does not have to stop, the majority of delay is attributed
to the side-street/minor approaches. Long delays and poor LOS can sometimes result on
the side street, even if the overall intersection is functioning well, making it a valuable
design criterion. As the side-street/minor approach delay approaches and exceeds 60
seconds per vehicle, drivers may divert to another route or become impatient and accept
gaps in the mainline traffic that are less than acceptable/safe gaps resulting in the potential
for traffic safety concerns. Therefore, depending on priority and traffic volume, acceptable
side-street LOS can range from D to F. Side streets can operate at LOS F without the
intersection warranting a change in traffic control.
A final fundamental component of operational analyses is a study of vehicular queuing, as
defined the line of vehicles waiting to pass through an intersection. An intersection can
operate with an acceptable Level of Service, but if queues from the intersection extend back
to block entrances to turn lanes or accesses to adjacent land uses, unsafe operating
conditions could result.
In reporting Levels of Service, the information from the signalized intersection analysis
comes directly from the Synchro 9 and SimTraffic 9 reports (found in the Appendix).
16Adelaide Landing Residential Development 1/31/2017
Traffic Impact Analysis
Intersection Levels of Service are reported based on the Control Delay calculated for the
overall intersection and for each critical movement as determined by SimTraffic 9, and as
adjusted for driver behavior.
For queuing, SimTraffic reports found in the Appendix list the Mean Queue, the 95th
Percentile and the Maximum Queue Lengths that are generated after five runs. In this
report, the 95th Percentile Queue Length is used to discern adequate lengths of turn lanes.
The 95th Percentile Queue Length refers to that length of queue that has only a five-
percent probability of being exceeded during an analysis period. This is the standard factor
used to determine optimal turn lane lengths. These 95th Percentile Queue Lengths are also
found in the Appendix.
Table 3 illustrates the existing a.m. and p.m. peak hour levels of service at the study
intersections. Intersection levels of service are recorded on the left side of the table, while
lane group levels of service for critical approaches are reported on the right site of the
table. In addition, 95th percentile queue lengths for these critical approaches are also
reported. Existing MnDOT signal timings were used in modeling traffic operation.
None of the study area intersections presents unacceptable overall operational or
performance issues in the existing condition.
17Adelaide Landing Residential Development 1/31/2017
Traffic Impact Analysis
Table 3: Existing Level of Service & Critical Queue Lengths
Available
Intersection Overall Lane Group Delay 95th Percetile
Intersection Lane Group LOS Stacking
Control Delay (sec) Intersection LOS Approach (sec) Queue Length (ft)
Distance
A.M. P.M. A.M. P.M. A.M. P.M. A.M. P.M. (ft.) A.M. P.M.
TH 61 & 140th Street N 17.7 30.9 B C EB Left 59.7 68.9 E E 455 111 236
EB Thru 64.9 88.6 E F 455 111 236
EB Right 18.0 8.1 B A 175 55 45
WB Left 71.1 46.2 E D 315 133 87
WB Thru 13.4 41.5 B D 315 133 87
WB Right 6.7 31.9 A C 225 73 183
NB Left 11.2 20.0 B B 180 25 237
NB Thru 6.0 25.4 A C 1000 101 506
NB Right 1.0 8.0 A A 260 11 269
SB Left 14.8 75.1 B E 250 62 348
SB Thru 18.8 13.1 B B 675 383 308
SB Right 5.1 4.2 A A 240 183 29
140th Street N & Flay Ave 0.6 1.0 A A EB Thru 0.6 0.9 A A 313 n.a n.a.
EB Right 0.5 0.9 A A 160 n.a n.a.
WB Left n.a. 8.1 n.a. A 220 n.a. 10
WB Thru 0.2 0.2 A A 220 n.a 10
NB Left 6.1 7.5 A A 100 30 37
NB Right 2.1 2.7 n.a. A 100 11 17
TH 61 & 137th Street N 4.4 2.9 A A WB Left 18.4 9.5 C A 240 33 29
WB Right 3.4 7.5 A A 240 33 29
NB Thru 1.3 2.6 A A 1645 n.a. n.a.
NB Right n.a. 0.4 n.a. A 210 n.a. n.a.
SB Left 8.4 6.4 A B 165 13 25
SB Thru 4.4 3.1 A A 1475 n.a. n.a.
TH 61 & 134th Street N 2.0 3.4 A A WB Left 7.5 8.0 A A 150 23 11
WB Right 1.7 2.3 A A 150 23 11
NB Thru 2.1 4.6 A A 2000 n.a. n.a.
NB Right 6.0 2.2 A A 250 n.a. n.a.
SB Left 1.9 7.6 A A 250 n.a. 13
SB Thru 2.0 1.4 A A 1645 n.a. n.a.
TH 61 & 130th Street N 21.5 14.0 C B EB Left 61.0 72.1 E E 230 44 96
EB Thru 53.5 173.3 D F 500 15 53
EB Right 18.8 11.8 B B 130 98 79
WB Left 57.5 81.8 E F 250 135 75
WB Thru 58.5 229.5 E F 1215 73 38
WB Right 4.3 15.2 A B 145 44 36
NB Left 17.6 11.0 B B 235 56 54
NB Thru 6.3 8.4 A A 2600 75 210
NB Right 1.5 3.3 A A 250 13 14
SB Left 19.8 18.3 B B 260 35 98
SB Thru 22.7 8.9 C A 2000 460 165
SB Right 7.3 3.3 A A 300 212 5
130th Street N & Flay Rd. 2.3 1.9 A A EB Thru 0.3 1.9 A A 1215 n.a n.a
EB Right 1.0 1.2 A A 100 n.a n.a
WB Left 0.8 0.5 A A 760 n.a. n.a
WB Thru 0.5 0.4 A A 760 n.a n.a
NB Left 4.9 4.7 A A 170 n.a 48
NB Right n.a. 2.5 n.a. A 170 49 48
130th Street N & 129TH Drive N 0.2 0.5 A A EB Thru 0.0 0.4 A A 760 n.a. n.a.
EB Right 0.0 0.2 A A 70 n.a. n.a.
WB Thru 0.3 0.0 A A 3220 n.a. n.a.
NB Left 3.5 3.5 A A 60 10 23
NB Right n.a. 3.2 n.a. A 60 10 23
130th Street N & Future East Access 0.1 0.6 A A EB Thru 0.0 0.3 A A n.a. n.a. n.a.
WB Thru 0.2 0.0 A A n.a. n.a. n.a.
(Source: Westwood Professional Services)
18Adelaide Landing Residential Development 1/31/2017
Traffic Impact Analysis
FUTURE YEAR FORECASTS
Westwood worked with the City’s traffic engineer to identify future years for analysis. The
Adelaide Landing development has a five-year phasing schedule. Therefore, assuming
construction of the first phase would occur in 2017, build-out could occur in 2021. It was
determined that the study years would be one year after full development (2022) and the
twenty year timeframe (2040, as specified by the City’s traffic engineer).
Westwood also reviewed the findings from the TH 61 Corridor Access Management Plan,
The TH 61 at 130th Street Intersection Control Evaluation (ICE) Report, and the City of Hugo’s
2030 Comprehensive Plan.
None of these utilized specific growth factors to determine background traffic. MnDOT
State Aid, however, provides twenty-year traffic projection factors that provide a means to
calculate annual growth rates.1 For Washington County, the traffic projection factor is listed
as 1.3. Based on annualizing the twenty-year growth projection, this results in a 1.3%
annual growth rate. This factor (which matches the a.m. peak hour growth rate discussed
earlier) will be used to calculate the background growth for both 2022 and 2040 No-Build
traffic scenarios.
There are no known intersection improvements planned in the study area outside of the
Adelaide Landing development.
2022 No-Build Scenario
Figure 3 illustrates the 2022 No-Build traffic projection for a.m. and p.m. peak hours. Using
these volume projections, Westwood calculated levels of service for the 2022 No-Build
scenario. These appear on Table 4.
In this scenario, no geometric or lane arrangement changes were assumed. The existing
MnDOT signal timings were not adjusted or optimized. Nevertheless, eastbound and
northbound movements along TH 61 record levels of service below acceptable levels. In
addition, queue lengths exceed available turn lane storage lengths at the southbound left
turn lanes along TH 61 at 140th Street.
2040 No-Build Scenario
Figure 4 illustrates the 2040 No-Build traffic projection for a.m. and p.m. peak hours. Using
these volume projections, Westwood calculated levels of service for the 2040 No-Build
scenario. Again, existing MnDOT signal timings were used and not optimized for the future
condition. These appear on Table 5.
1
Traffic Projection Factors, Minnesota Department of Transportation State Aid, Saint Paul, MN, Fall 2015
19Phone (952) 937-5150 7699 Anagram Drive
Fax (952) 937-5822 Eden Prairie, MN 55344
(888) 937-5150Adelaide Landing Residential Development 1/31/2017
Traffic Impact Analysis
Table 4: 2022 No-Build Level of Service & Critical Queue Lengths
Available
Intersection Overall Intersection Lane Group Delay 95th Percetile
Intersection Lane Group LOS Stacking
Control Delay (sec) LOS Approach (sec) Queue Length (ft)
Distance
A.M. P.M. A.M. P.M. A.M. P.M. A.M. P.M. (ft.) A.M. P.M.
TH 61 & 140th Street N 17.3 33.7 B C EB Left 61.1 84.6 E F 455 110 258
EB Thru 98.9 76.4 F E 455 110 258
EB Right 11.7 10.2 B B 175 51 45
WB Left 67.4 64.8 E E 315 125 125
WB Thru 25.6 68.6 C E 315 125 125
WB Right 8.2 34.8 A B 225 96 177
NB Left 8.0 25.4 A C 180 21 143
NB Thru 5.6 27.0 A C 1000 101 567
NB Right 2.0 11.9 A B 260 17 232
SB Left 13.2 83.9 B F 250 56 342
SB Thru 19.3 13.8 B B 675 425 308
SB Right 5.0 4.8 A A 240 226 32
140th Street N & Flay Ave 0.9 1.1 A A EB Thru 0.6 0.9 A A 313 n.a n.a.
EB Right 0.6 0.9 A A 160 n.a n.a.
WB Left n.a. 1.9 n.a. A 220 n.a n.a.
WB Thru 0.2 0.2 A A 220 n.a n.a.
NB Left 6.6 7.7 A A 100 49 45
NB Right 1.6 4.1 A A 100 7 20
TH 61 & 137th Street N 4.2 3.5 A A WB Left 75.4 39.5 F D 240 32 36
WB Right 4.3 7.7 A A 240 32 36
NB Thru 1.3 3.2 A A 1645 n.a. n.a.
NB Right n.a. 1.0 n.a. A 210 n.a. n.a.
SB Left 4.7 9.8 A A 165 8 20
SB Thru 5.3 3.6 A A 1475 n.a. n.a.
TH 61 & 134th Street N 2.1 3.8 A A WB Left 11.3 11.4 B B 150 28 13
WB Right 1.6 6.1 A A 150 28 13
NB Thru 1.9 5.4 A A 2000 n.a. n.a.
NB Right 3.0 4.2 n.a. A 250 n.a. n.a.
SB Left 0.5 4.7 n.a. A 250 n.a. 15
SB Thru 2.0 1.7 A A 1645 n.a. n.a.
TH 61 & 130th Street N 24.7 16.7 C B EB Left 55.3 65.2 E E 260 66 101
EB Thru 84.6 63.6 F E 500 10 66
EB Right 29.6 15.0 C B 130 135 97
WB Left 59.1 67.6 E E 250 200 104
WB Thru 42.0 275.4 D D 1215 52 110
WB Right 5.1 10.4 A B 145 44 39
NB Left 21.4 18.0 C B 235 74 81
NB Thru 5.3 11.6 A B 2600 92 254
NB Right 2.2 4.9 A A 250 21 27
SB Left 18.2 18.4 B B 260 28 74
SB Thru 26.3 11.0 C B 2000 607 199
SB Right 11.3 3.9 A A 300 326 11
130th Street N & Flay Rd. 2.4 2.1 A A EB Thru 0.7 1.6 A A 1215 n.a n.a
EB Right 0.5 0.9 A A 100 n.a n.a
WB Left 0.6 0.6 A A 760 n.a. 9
WB Thru 0.5 0.6 A A 760 n.a 9
NB Left 5.0 5.3 A A 170 n.a 48
NB Right 4.5 2.8 A A 170 54 48
130th Street N & 129TH Drive N 0.2 0.4 A A EB Thru 2.0 0.4 A A 760 n.a. n.a.
EB Right 0.0 0.0 A A 70 n.a. n.a.
WB Thru 0.2 0.3 A A 3220 n.a. n.a.
NB Left n.a. 3.6 n.a. A 60 n.a. 23
NB Right n.a. 2.3 n.a. A 60 n.a. 23
130th Street N & Future East Access 0.1 0.6 A A EB Thru 0.2 0.5 A A n.a. n.a. n.a.
WB Thru 0.1 0.2 A A n.a. n.a. n.a.
(Source: Westwood Professional Services)
21Phone (952) 937-5150 7699 Anagram Drive
Fax (952) 937-5822 Eden Prairie, MN 55344
(888) 937-5150Adelaide Landing Residential Development 1/31/2017
Traffic Impact Analysis
Table 5: 2040 No-Build Level of Service & Critical Queue Lengths
Available
Intersection Overall Intersection Lane Group Delay 95th Percetile
Intersection Lane Group LOS Stacking
Control Delay (sec) LOS Approach (sec) Queue Length (ft)
Distance
A.M. P.M. A.M. P.M. A.M. P.M. A.M. P.M. (ft.) A.M. P.M.
TH 61 & 140th Street N 32.4 135.3 C F EB Left 77.5 599.0 E F 455 144 1282
EB Thru 34.4 592.8 C F 455 144 1282
EB Right 35.3 384.1 C F 175 71 321
WB Left 62.3 44.1 E D 315 183 77
WB Thru 21.7 24.4 C D 315 183 77
WB Right 10.2 50.3 B D 225 118 259
NB Left 37.2 52.2 D F 180 35 275
NB Thru 10.8 52.2 B F 1000 187 1336
NB Right 1.7 34.0 A E 260 15 379
SB Left 35.7 371.8 D F 250 447 396
SB Thru 40.9 135.5 D E 675 1018 1375
SB Right 23.2 118.6 C D 240 367 185
140th Street N & Flay Ave 0.9 1.4 A A EB Thru 0.6 0.8 A A 313 n.a n.a.
EB Right 0.6 0.9 n.a. A 160 n.a n.a.
WB Left n.a. 5.1 n.a. A 220 n.a 10
WB Thru 0.3 0.2 A A 220 n.a 10
NB Left 7.0 9.1 A A 100 40 49
NB Right 3.6 4.5 A A 100 13 21
TH 61 & 137th Street N 7.0 6.5 A A WB Left 43.2 35.0 E D 240 40 35
WB Right 8.0 36.9 A E 240 40 35
NB Thru 1.8 6.3 A A 1645 n.a. 41
NB Right n.a. 2.2 n.a. A 210 n.a. n.a.
SB Left 9.1 31.0 A D 165 8 30
SB Thru 8.6 5.8 A A 1475 n.a. n.a.
TH 61 & 134th Street N 3.7 6.3 A A WB Left 25.7 3.2 D A 150 30 11
WB Right 1.7 3.7 n.a. A 150 30 11
NB Thru 3.2 8.1 A A 2000 n.a. n.a.
NB Right 2.1 7.2 A A 250 n.a. n.a.
SB Left n.a. 16.0 n.a. C 250 n.a. 23
SB Thru 3.5 1.8 A A 1645 n.a. n.a.
TH 61 & 130th Street N 50.5 30.6 D C EB Left 53.6 69.0 D D 260 51 87
EB Thru 77.8 284.3 E F 500 223 100
EB Right 82.0 14.5 F B 130 173 89
WB Left 67.2 65.6 E E 250 229 106
WB Thru 51.6 86.1 D F 1215 80 42
WB Right 6.1 38.5 A D 145 45 55
NB Left 86.9 33.0 F C 235 130 225
NB Thru 10.9 32.9 A C 2600 151 1111
NB Right 1.8 24.0 A C 250 11 237
SB Left 45.7 41.1 D D 260 258 93
SB Thru 57.5 8.3 E A 2000 1030 125
SB Right 38.9 4.4 D A 300 215 7
130th Street N & Flay Rd. 2.3 2.2 A A EB Thru 0.2 1.7 A A 1215 n.a n.a
EB Right 0.7 0.9 A A 100 n.a n.a
WB Left 0.3 1.4 A A 760 n.a. 12
WB Thru 0.5 0.3 A A 760 n.a 12
NB Left 5.3 5.1 A A 170 59 54
NB Right 4.6 2.6 A A 170 59 54
130th Street N & 129TH Drive N 0.1 0.5 A A EB Thru 0.0 0.5 A A 760 n.a. n.a.
EB Right 0.0 0.1 A A 70 n.a. n.a.
WB Thru 0.2 0.0 A A 3220 n.a. n.a.
NB Left n.a. 3.1 n.a. A 60 n.a. 23
NB Right n.a. 2.3 n.a. A 60 n.a. 23
130th Street N & Future East Access 0.1 0.5 A A EB Thru 0.0 0.6 A A n.a. n.a. n.a.
WB Thru 0.1 0.0 A A n.a. n.a. n.a.
(Source: Westwood Professional Services)
23Adelaide Landing Residential Development 1/31/2017
Traffic Impact Analysis
In this scenario, no geometric or lane arrangement changes were assumed. As with the
2022 No-Build condition, eastbound and northbound movements along TH 61 record levels
of service below acceptable levels. In addition, some side-street movements at TH 61 &
130th Street North begin to experience levels of service below acceptable limits.
Conversely, there are improvements in levels of service at some locations. This is a
situation that occurs in Synchro/SimTraffic computer runs on occasion. Due to the variable
seeding of the five runs, there are times that the level of service actually records improved
operation.
The traffic growth to year 2040 exceeds the carrying capacity of a single through lane in
each direction along TH 61. Further, at the signalized intersections, the green time for TH
61 traffic must be so long to adequately handle through traffic that the side street queues
build as they wait for their short green cycles. This is evidenced as queue lengths exceed
available storage at certain locations (e.g., TH 61 at 130th Street, WB right turn, NB and SB
left turns; TH 61 at 140th Street, WB left turn, NB left turn, NB right turn).
To mitigate these issues, Westwood tested the impact of increasing TH 61 to four lanes (two
lanes in each direction, plus reconstructing 130th Street to collector standards (see Table 6).
The resulting levels of service fall to generally acceptable levels.
This eventuality has been foreseen in the City of Hugo 2030 Comprehensive Plan2, as well as
the US 61 in Hugo – Corridor Access Management Plan Memorandum of Understanding
(MOU)3.
The 2030 Comprehensive Plan stated, “…With the number of access locations, together with
the traffic volume levels, this roadway is approaching the need for expansion to a four-lane
facility. In addition to the mainline congestion, queuing at existing signalized and
unsignalized intersections provides a source of localized congestion on the City street
system.” This side-street congestion is evident in the 2022 and 2040 No-Build scenarios.
The TH 61 MOU stated that the Corridor Access Management Plan shall occur over time,
and that several ongoing factors should be implemented in Hugo, including:
Preserving right-of-way for the ultimate four-lane section as land is replatted for
development trough dedication or outlots.
MnDOT will continue to review the needs on US 61 as part of the agency’s long
range planning process. When funding and priority are met, the highway
2
2030 Comprehensive Plan, City of Hugo, Minnesota, Adopted March 15, 2010
3
Final MOU for US 61 in Hugo; Corridor Access Management Plan, Minnesota Department of Transportation,
05/19/20108.
24Adelaide Landing Residential Development 1/31/2017
Traffic Impact Analysis
Table 6: 2040 No-Build Level of Service & Critical Queue Lengths – 4 Lanes on TH 61
Available
Intersection Overall Intersection Lane Group Delay 95th Percetile
Intersection Lane Group LOS Stacking
Control Delay (sec) LOS Approach (sec) Queue Length (ft)
Distance
A.M. P.M. A.M. P.M. A.M. P.M. A.M. P.M. (ft.) A.M. P.M.
TH 61 & 140th Street N 15.0 21.9 B C EB Left 35.0 76.7 D E 455 36 262
EB Thru 45.5 38.5 D D 455 36 39
EB Right 8.0 5.5 A A 175 36 40
WB Left 28.7 33.1 C C 315 79 76
WB Thru 18.1 30.8 B C 315 79 42
WB Right 4.9 18.6 A B 225 48 170
NB Left 10.2 16.5 B B 180 13 134
NB Thru 6.9 25.4 A C 1000 38 330
NB Right 1.0 10.4 A B 260 3 157
SB Left 9.2 26.4 A C 250 35 237
SB Thru 6.1 8.3 A A 675 67 120
SB Right 2.6 2.5 A D 240 7 18
140th Street N & Flay Ave 0.8 1.2 A A EB Thru 0.9 1.0 A A 313 n.a n.a.
EB Right 0.9 1.2 A A 160 n.a n.a.
WB Left 2.0 4.2 A B 220 n.a n.a.
WB Thru 0.2 0.4 A A 220 n.a n.a.
NB Left 9.9 9.4 A A 100 35 44
NB Right 3.3 5.4 A A 100 n.a 16
TH 61 & 137th Street N 2.4 2.7 A A WB Left 21.2 30.5 n.a. D 240 32 43
WB Right 1.8 11.9 A B 240 32 43
NB Thru 1.1 2.2 A A 1645 n.a. n.a.
NB Right n.a. 1.0 n.a. A 210 n.a. n.a.
SB Left 2.2 11.4 A B 165 n.a. 28
SB Thru 2.9 3.0 A A 1475 n.a. n.a.
TH 61 & 134th Street N 1.7 3.5 A A WB Left 0.0 46.1 A E 150 17 12
WB Right 1.9 7.2 A A 150 17 12
NB Thru 2.6 5.2 A A 2000 n.a. n.a.
NB Right n.a. 4.2 n.a. A 250 n.a. n.a.
SB Left n.a. 5.8 n.a. A 250 n.a. 17
SB Thru 1.3 1.1 A A 1645 n.a. n.a.
TH 61 & 130th Street N 11.4 12.6 B B EB Left 14.0 33.9 B C 260 38 77
EB Thru 53.6 31.6 D C 500 30 49
EB Right 18.0 8.5 B A 130 123 77
WB Left 13.5 41.1 B D 250 56 85
WB Thru 23.7 41.0 C D 1215 38 26
WB Right 4.1 7.6 A A 145 51 40
NB Left 14.2 14.5 B B 235 63 78
NB Thru 6.7 10.5 A B 2600 77 166
NB Right 2.7 3.5 A A 250 8 16
SB Left 9.4 18.0 A B 260 33 81
SB Thru 12.4 11.7 B B 2000 175 150
SB Right 3.3 3.0 A A 300 14 8
130th Street N & Flay Rd 2.3 2.5 A A EB Thru 1.4 2.4 A A 1215 n.a n.a
EB Right 0.4 1.2 A A 100 n.a n.a
WB Left 0.3 3.2 A A 760 n.a. 15
WB Thru 1.3 0.4 A A 760 n.a 15
NB Left 5.2 5.5 A A 170 28 45
NB Right 4.5 2.8 A A 170 28 45
130th Street N & 129TH Drive N 0.2 0.5 A A EB Thru 0.0 0.5 A A 760 n.a. n.a.
EB Right 0.3 0.0 A A 70 n.a. n.a.
WB Thru 0.3 0.0 A A 3220 n.a. n.a.
NB Left n.a. 3.9 n.a. A 150 n.a. 14
NB Right n.a. 3.4 n.a. A 100 n.a. 14
130th Street N & Future East Access 0.2 0.2 A A EB Thru 0.0 0.3 A A n.a. n.a. n.a.
WB Thru 0.3 0.0 A A n.a. n.a. n.a.
(Source: Westwood Professional Services)
25Adelaide Landing Residential Development 1/31/2017
Traffic Impact Analysis
concept will be added to MnDOT Metro’s fiscally constrained 20-year
Transportation System Plan
MnDOT’s State Highway Investment Plan: 2014-20334 describes identified and prioritized
projects versus the twenty-year funding outlook. No project along this segment of TH 61 is
identified in the twenty-year plan. An appendix of this plan, however, includes a Project List
of Unmet Needs, which identifies US 61 among several routes in the Twin Cities Metro Area
that is a traffic congestion bottleneck. While not explicitly stating this portion of TH 61, the
list states that these projects, if funded, offer a, “…High return on investment capacity
enhancements and spot improvements (e.g., interchange reconstruction, auxiliary lanes and
other improvements”.
Further, the 2016 Capital Improvement Program for the City of Hugo identifies
reconstruction of 130th Street between TH 61 and Goodview to Collector Standards as being
a Priority 2 project.5
Pedestrian Access & Crossing Considerations
The area surrounding the proposed Adelaide Landing has been identified in the City of Hugo
Comprehensive Plan as having existing or proposed sidewalks and trails.
There exist sidewalks along 140th Street east of TH 61 and along Fray Avenue south
to the Adelaide Landing development.
There is a planned City Trail along 130th Street from TH 61 westward to Goodview.
This trail will connect with a proposed trail northward and southward along
Goodview.
There is a planned Regional Trail along the west side of TH 61 between 130 th Street
and 140th Street. This regional trail will provide regional pedestrian and bicycle
access to areas north and south of the development.
A snowmobile trail also existing on the west side of TH 61 through Hugo and
beyond.
A trail system is proposed in the Adelaide Landing development connecting lots on the
north end of the development to those on the south end and connecting to the proposed
park in the middle of the development. The trail system will meander between ponds and
behind residential lots to provide pedestrian access and connectivity throughout the
neighborhood.
4
20-Year State Highway Investment Plan: 2014-2033, Minnesota Department of Transportation, December 2013.
5
2016 Capital Improvement Program Proposed Street Improvement Locations Map, City of Hugo, MN, June 22,
2016.
26Adelaide Landing Residential Development 1/31/2017
Traffic Impact Analysis
Due to the heavy vehicular traffic volumes along TH 61, it is recommended that pedestrian
crossings remain only at signalized intersections. Of the study area intersections, both TH
61 at 130th and 140th Streets are signalized. Both intersections have marked crosswalks and
pedestrian indications that serve people walking or biking across TH 61.
Without signalization at TH 61 and 134th Street or at 137th Street, pedestrians and bicyclists
would have difficulty finding adequate gaps to cross TH 61 during a.m. or p.m. peak hours.
Therefore, pedestrians and bicyclists from these streets would likely choose to cross TH 61
at 130th Street or 140th Street.
27Adelaide Landing Residential Development 1/31/2017
Traffic Impact Analysis
DEVELOPMENT IMPACTS
Trip Generation
The Adelaide Landing development is proposed to include 324 lots of residential
development, to be constructed in phases over five years. Table 7 lists the proposed
breakout of the development during these phases.
Table 7: Adelaide Landing Development Proposed Phasing
50’ Lot 65’ Lot 70’ Lot 85’ Lot
Phase Villas TOTAL
Width Width Width Width
I 20 16 19 55
II 17 16 17 25 75
III 22 21 25 68
IV 17 14 30 20 81
V 15 30 45
Total 91 51 33 60 89 324
(Source: Westwood Professional Services)
Westwood divided the subdivision into travelsheds based on proximity to access points.
Westwood then utilized the equations from the Institute of Transportation Engineers’ Trip
Generation Manual, Ninth Edition, as opposed to rates to estimate the potential trips to and
from the development travelsheds.6 (In the case of this residential development, ITE best
practices recommends the use of equations over rates.) Table 8 shows the overall trip
generation potential.
Table 8: Adelaide Landing Trip Generation Potential
ITE Weekday AM peak PM Peak
Type Land Use Code Size Enter Exit Enter Exit Enter Exit
Residential Single Family Housing 210 324 units 1,549 1,549 59 177 191 112
1,549 1,549 59 177 191 112
3,098 236 303
(Source: ITE Trip Generation Manual, Ninth Edition 2012)
No trip reductions were taken for internal or pass-by trips.
Rates and equations under ITE Code 230 for “Residential Condominium/Townhouse” were
not used in to calculate trip generation for the villas because the ITE Trip Generation
Manual stipulates that the units “have at least one other owned unit within the same
building structure.” The villas identified here are detached units. Therefore, to be
conservative, all units were included in ITE Code 201 for “Single Family Residential”.
6
Trip Generation Manual, Ninth Edition, Institute of Transportation Engineers, Washington, DC, 2012
28Adelaide Landing Residential Development 1/31/2017
Traffic Impact Analysis
Trip Distribution and Assignment
Westwood determined the trip distribution based on the existing peak hour volumes
gathered in August 2016 and presented in Figure 2. Percentages were calculated of trips
entering and exiting the study area based. Figure 5 illustrates the trip distributions by peak
period. Figure 6 illustrates the assignment of peak hour trips generated by this
development onto the study area.
2022 Build Scenario
To model the effect of the Adelaide Landing development on study area traffic, the trip
assignment traffic was added to the no-build traffic – both for the 2022 and 2040 scenarios.
In each scenario, existing MnDOT signal timing were utilized.
Figure 7 shows the resulting traffic forecast for the 2022 Build condition. There are six main
access locations into and out of the development:
130th Street North & Flay Road (west site access street)
130th Street North & 129th Drive North (mid site access street)
130th Street North & the east site access street (yet unnamed)
134th Street North & TH 61 (via adjacent subdivision)
137th Street North & TH 61 (via adjacent subdivision)
140th Street North & Flay Avenue
There are also two main intersections providing indirect access to the development
included in the analysis:
TH 61 & 130th Street North
TH 61 & 140th Street North
Table 9 lists the traffic operation and queuing that will result from the 2022 Build scenario.
In the 2022 Build condition, all intersections performed at LOS-C or better in the a.m. peak
hour. The intersection of TH 61 & 130th Street, however, did not operate acceptably during
the p.m. peak hour due to heavy north/south demand and very limited east/west green
time.
On a movement-by-movement scale, several lane groups recorded LOS-E or -F, suggesting
they were at or exceeding capacity:
TH 61 & 140th Street North -- levels of service at this intersection may be improved with
signal timing changes.
The shared eastbound left/through lane group.
The southbound left turn movement.
295)
XX%
41%
46 (3
AM (PM)
5%
5 (6)
13
17 %
(8)
Assume 10-15
peak hour "cut-
through" trips
between TH 61 &
existing
subdivision to the
east of Adelaide
Landing via 130th
Street
2%
2 (2)
6%
6 (6)
1)
2 (2)
31%
2%
22 (4
Phone   (952) 937-5150   7699 Anagram Drive
Fax     (952) 937-5822   Eden Prairie, MN 55344
(888) 937-5150Phone (952) 937-5150 7699 Anagram Drive
Fax (952) 937-5822 Eden Prairie, MN 55344
(888) 937-5150Phone (952) 937-5150 7699 Anagram Drive
Fax (952) 937-5822 Eden Prairie, MN 55344
(888) 937-5150Adelaide Landing Residential Development 1/31/2017
Traffic Impact Analysis
Table 9: 2022 Build Level of Service & Critical Queue Lengths
Available
Intersection Overall Intersection Lane Group Delay 95th Percetile
Intersection Lane Group LOS Stacking
Control Delay (sec) LOS Approach (sec) Queue Length (ft)
Distance
A.M. P.M. A.M. P.M. A.M. P.M. A.M. P.M. (ft.) A.M. P.M.
TH 61 & 140th Street N 19.9 47.8 B D EB Left 61.9 96.7 E F 455 126 362
EB Thru 63.7 118.8 E F 455 126 362
EB Right 15.5 18.9 B B 175 56 184
WB Left 77.6 45.9 E D 315 176 119
WB Thru 94.1 20.4 F C 315 176 119
WB Right 9.4 33.5 A C 225 140 180
NB Left 29.0 23.3 C C 180 30 137
NB Thru 10.0 24.2 A C 1000 183 610
NB Right 1.5 10.7 A B 260 12 187
SB Left 17.6 131.8 B F 250 68 429
SB Thru 20.0 45.3 B D 675 416 1137
SB Right 5.0 29.1 A C 240 131 262
140th Street N & Flay Ave 0.9 1.1 A A EB Thru 0.5 1.0 A A 313 n.a n.a.
EB Right 0.4 1.0 A A 160 n.a n.a.
WB Left 2.0 2.4 A A 220 n.a 15
WB Thru 0.3 0.3 A A 220 n.a 15
NB Left 6.3 7.3 A A 100 40 38
NB Right 3.1 4.7 A A 100 9 16
TH 61 & 137th Street N 5.7 5.3 A A WB Left 17.8 51.0 C F 240 72 60
WB Right 8.5 16.9 A C 240 72 60
NB Thru 1.4 3.7 A A 1645 n.a. n.a.
NB Right 0.9 1.3 A A 210 n.a. n.a.
SB Left 7.8 12.3 A B 165 9 28
SB Thru 7.0 5.7 A A 1475 n.a. n.a.
TH 61 & 134th Street N 2.8 6.6 A A WB Left 26.5 80.0 D F 150 33 11
WB Right 3.9 4.9 A A 150 33 11
NB Thru 2.2 9.7 A A 2000 n.a. n.a.
NB Right 3.6 9.3 A A 250 n.a. n.a.
SB Left 2.5 2.7 A A 250 n.a. n.a.
SB Thru n.a. 1.7 n.a. A 1645 n.a. n.a.
TH 61 & 130th Street N 30.2 108.5 C F EB Left 60.0 707.4 E F 260 55 250
EB Thru 261.4 1053.9 F F 500 67 1753
EB Right 35.3 793.2 C F 130 121 141
WB Left 116.4 68.5 F E 250 307 154
WB Thru 160.8 58.2 F E 1215 340 36
WB Right 8.6 35.4 A D 145 54 76
NB Left 29.4 31.1 C C 235 53 285
NB Thru 7.0 41.8 A D 2600 127 750
NB Right 1.1 19.8 A B 250 13 380
SB Left 11.2 58.0 B E 260 123 284
SB Thru 15.3 27.3 B C 2000 329 429
SB Right 5.6 7.6 A A 300 19 117
130th Street N & Flay Rd. 2.4 2.8 A A EB Left 1.7 3.0 A A 260 15 18
EB Thru 0.4 2.9 A A 400 n.a n.a.
EB Right 0.2 1.5 A A 100 n.a n.a
WB Left 0.5 1.3 A A 760 n.a. 8
WB Thru 0.7 0.6 A A 760 n.a n.a.
WB Right n.a. 0.1 n.a. A 250 n.a,
NB Left 6.0 7.5 A A 170 50 55
NB Thru n.a. 14.1 A B 170 50 55
NB Right 4.1 4.1 A A 270 50 55
SB Left n.a. 5.5 n.a. A 320 52
SB Thru 5.0 7.6 A A 500 44 52
SB Right 3.5 3.1 A A 100 44 52
130th Street N & 129TH Drive N 0.8 1.3 A A EB Left 0.5 1.6 A A 760 9 9
EB Thru 0.2 1 A A 760 n.a. n.a.
EB Right 0.0 n.a. A n.a. 70 n.a. n.a.
WB Thru 0.3 0.3 A A 1430 n.a. n.a.
WB Right 0.5 0.0 A A 250 n.a.
NB Left 3.7 3.4 A A 150 10 14
NB Right n.a. 2.3 n.a. A 270 n.a. 14
SB Right 2.8 2.4 A A 150 47 53
130th Street N & Future East Access 0.6 0.6 A A EB Left 1.8 1.1 A A 1430 n.a. n.a.
EB Thru 0.1 0.8 A A 1430 n.a. n.a.
WB Thru 0.2 0.3 A A 800 n.a. n.a.
WB Right 0.1 0.0 A A 800 n.a. n.a.
SB Left 4.8 n.a. A n.a. 826 39 n.a.
SB Right 2.5 3.2 A A 100 39 31
(Source: Westwood Professional Services)
33Adelaide Landing Residential Development 1/31/2017
Traffic Impact Analysis
TH 61 & 137th Street North
The low volume westbound left turn movement recorded LOS-E most likely due to
minimal adequate gaps in TH 61 traffic to complete the turn, resulting in longer
vehicular delay.
TH 61 & 134th Street North
Likewise, the westbound low volume left turn movement recorded LOS-E most likely
due to minimal adequate gaps in TH 61 traffic to complete the turn.
TH 61 & 130th Street North-- levels of service at this intersection may be improved with
signal timing changes.
2040 Build Scenario
Figure 8 shows the resulting traffic forecast for the 2040 Build condition. No other access
points were presumed to be added between 2022 and 2040.
Table 10 lists the traffic operation and queuing that will result from the 2040 Build scenario.
In the 2040 Build condition, two intersections performed below LOS-D.
TH 61 & 130th Street North
Recorded LOS-E during both a.m. and p.m. peak hours. On a movement-by-
movement basis, the westbound approach performed at LOS-F in the a.m. peak
hour, while eastbound, westbound and northbound movements recorded LOS-E or
lower during the p.m. peak hour.
TH 61 & 140th Street North
Recorded LOS-F for overall intersection performance in the p.m. peak hour.
Recorded LOS-F in the eastbound and northbound approached during the p.m. peak
hour.
Recorded LOS-F in the southbound left turn approach.
Recorded excessive queuing in the eastbound approach during the p.m. peak hour.
TH 61 & 137th Street North
The westbound approach recorded LOS-F in the p.m. peak hour, most likely due to
minimal adequate gaps in TH 61 traffic to complete the turn.
Queuing along northbound TH 61 extends through several intersections in the p.m.
peak hour
34Phone (952) 937-5150 7699 Anagram Drive
Fax (952) 937-5822 Eden Prairie, MN 55344
(888) 937-5150Adelaide Landing Residential Development 1/31/2017
Traffic Impact Analysis
Table 10: 2040 Build Level of Service & Critical Queue Lengths
Available
Intersection Overall Intersection Lane Group Delay 95th Percetile
Intersection Lane Group LOS Stacking
Control Delay (sec) LOS Approach (sec) Queue Length (ft)
Distance
A.M. P.M. A.M. P.M. A.M. P.M. A.M. P.M. (ft.) A.M. P.M.
TH 61 & 140th Street N 23.4 100.7 C F EB Left 66.2 481.1 E F 455 142 1321
EB Thru 142.3 490.5 F F 455 142 1321
EB Right 47.8 323.0 D F 175 97 358
WB Left 62.9 52.3 E D 315 178 150
WB Thru 28.0 36.5 C D 315 178 150
WB Right 9.9 44.6 A D 225 105 271
NB Left 36.9 31.2 D C 180 38 144
NB Thru 5.8 21.2 A C 1000 112 497
NB Right 1.4 8.2 A A 260 11 269
SB Left 24.7 228.5 C F 250 300 455
SB Thru 27.0 83.3 C F 675 589 1445
SB Right 10.7 66.9 B E 240 260 260
140th Street N & Flay Ave 1.1 1.4 A A EB Thru 0.6 1.0 A A 313 n.a n.a.
EB Right 0.7 1.0 A A 160 n.a n.a.
WB Left 2.3 2.6 A A 220 11 n.a.
WB Thru 0.3 0.3 A A 220 11 n.a.
NB Left 7.2 10.6 A B 100 33 50
NB Right 2.1 4.3 A A 100 15 25
TH 61 & 137th Street N 8.0 6.4 A A WB Left 40.1 75.0 E F 240 79 88
WB Right 10.7 37.3 B E 240 79 88
NB Thru 1.8 4.1 A A 1645 n.a. n.a.
NB Right 1.0 1.5 A A 210 n.a. n.a.
SB Left 10.7 24.8 B C 165 24 41
SB Thru 9.5 6.2 A A 1475 n.a. n.a.
TH 61 & 134th Street N 3.4 6.9 A A WB Left 40.1 42.1 E E 150 21 31
WB Right 1.9 3.0 A A 150 21 31
NB Thru 2.8 9.8 A A 2000 n.a. n.a.
NB Right 4.6 7.7 A A 250 n.a. n.a.
SB Left 0.1 22.7 A C 250 n.a. 15
SB Thru 3.2 2.1 A A 1645 n.a. n.a.
TH 61 & 130th Street N 59.3 77.1 E E EB Left 50.4 109.2 D F 260 67 80
EB Thru 63.5 263.3 E F 500 166 602
EB Right 65.1 92.1 E F 130 169 106
WB Left 486.7 70.3 F E 250 280 154
WB Thru 579.6 84.9 F F 1215 1625 76
WB Right 339.1 32.5 F D 145 104 97
NB Left 52.8 101.1 D F 235 95 300
NB Thru 10.0 100.3 A F 2600 161 1291
NB Right 1.8 80.1 A F 250 21 346
SB Left 31.3 49.4 C D 260 54 338
SB Thru 37.6 30.9 D C 2000 783 491
SB Right 21.1 13.1 C B 300 246 11
130th Street N & Flay Rd 51.7 2.6 F A EB Left 1.6 2.5 A A n.a. 13 29
EB Thru 1.1 2.5 A A 1215 n.a. n.a.
EB Right 0.6 1.6 A A 100 n.a. n.a.
WB Left 3.7 2.5 A A n.a. n.a. 12
WB Thru 23.8 0.6 C A 760 179 n.a.
WB Right n.a. 0.0 n.a. A n.a. 179 n.a.
NB Left 132.8 6.4 F A 100 286 47
NB Thru 131.8 6.4 F A 100 286 47
NB Right 85.6 3.6 F A 100 286 47
SB Thru 9.8 6.3 n.a. A 250 138 46
SB Right 99.4 3.0 F A 70 138 46
130th Street N & 129TH Drive N 1.0 1.1 A A EB Left 0.7 1.3 A A n.a. n.a. 17
EB Thru 0.2 0.8 A A 1430 n.a. n.a.
EB Right n.a. 0.0 n.a. A n.a. n.a. n.a.
WB Thru 0.3 0.4 A A 1430 n.a. n.a.
NB Left 5.7 3.6 A A 150 10 18
NB Right n.a. 5.2 n.a. A 150 10 18
SB Left 6.5 3.9 A A 904 53 10
SB Right 2.8 2.7 A A 150 53 47
130th Street N & Future East Access 0.6 0.7 A A EB Left 1.0 1.4 A A 1430 8 n.a.
EB Thru 0.1 0.5 A A 1430 8 n.a.
WB Thru 0.1 0.0 A A 800 n.a. n.a.
WB Right n.a. 0.0 n.a. A 800 n.a. n.a.
SB Left 6.5 n.a. A n.a. 488 43 n.a.
SB Right 2.8 2.2 A A 100 43 32
(Source: Westwood Professional Services)
36You can also read