Adaptive unsupervised learning with enhanced feature representation for intra-tumor partitioning and survival prediction for glioblastoma
←
→
Page content transcription
If your browser does not render page correctly, please read the page content below
Adaptive unsupervised learning with enhanced
                                                feature representation for intra-tumor
                                                partitioning and survival prediction for
                                                              glioblastoma

                                         Yifan Li1 , Chao Li?2 , Yiran Wei2 , Stephen Price2 , Carola-Bibiane Schönlieb3 ,
arXiv:2108.09423v1 [cs.LG] 21 Aug 2021

                                                                         and Xi Chen1,4
                                                   1
                                                     Department of Computer Science, University of Bath, Bath, UK.
                                                   2
                                                     {Division of Neurosurgery, Department of Clinical Neurosciences,
                                                    3
                                                      Department of Applied Mathematics and Theoretical Physics,
                                                  4
                                                    Department of Physics}, University of Cambridge, Cambridge, UK.
                                             yl3548@bath.ac.uk, cl647@cam.ac.uk, yw500@cam.ac.uk, sjp58@cam.ac.uk,
                                                     cbs31@cam.ac.uk, xc841@bath.ac.uk/xc253@mrao.cam.ac.uk

                                                 Abstract. Glioblastoma is profoundly heterogeneous in regional mi-
                                                 crostructure and vasculature. Characterizing the spatial heterogeneity
                                                 of glioblastoma could lead to more precise treatment. With unsuper-
                                                 vised learning techniques, glioblastoma MRI-derived radiomic features
                                                 have been widely utilized for tumor sub-region segmentation and sur-
                                                 vival prediction. However, the reliability of algorithm outcomes is often
                                                 challenged by both ambiguous intermediate process and instability in-
                                                 troduced by the randomness of clustering algorithms, especially for data
                                                 from heterogeneous patients.
                                                 In this paper, we propose an adaptive unsupervised learning approach
                                                 for efficient MRI intra-tumor partitioning and glioblastoma survival pre-
                                                 diction. A novel and problem-specific Feature-enhanced Auto-Encoder
                                                 (FAE) is developed to enhance the representation of pairwise clinical
                                                 modalities and therefore improve clustering stability of unsupervised
                                                 learning algorithms such as K-means. Moreover, the entire process is
                                                 modelled by the Bayesian optimization (BO) technique with a custom
                                                 loss function that the hyper-parameters can be adaptively optimized in
                                                 a reasonably few steps. The results demonstrate that the proposed ap-
                                                 proach can produce robust and clinically relevant MRI sub-regions and
                                                 statistically significant survival predictions.

                                                 Keywords: Glioblastoma · MRI · auto-encoder · K-means clustering ·
                                                 Bayesian optimization · survival prediction

                                         1     Introduction
                                         Glioblastoma is one of the most aggressive adult brain tumors characterized
                                         by heterogeneous tissue microstructure and vasculature. Previous research has
                                         ?
                                             Equal contribution.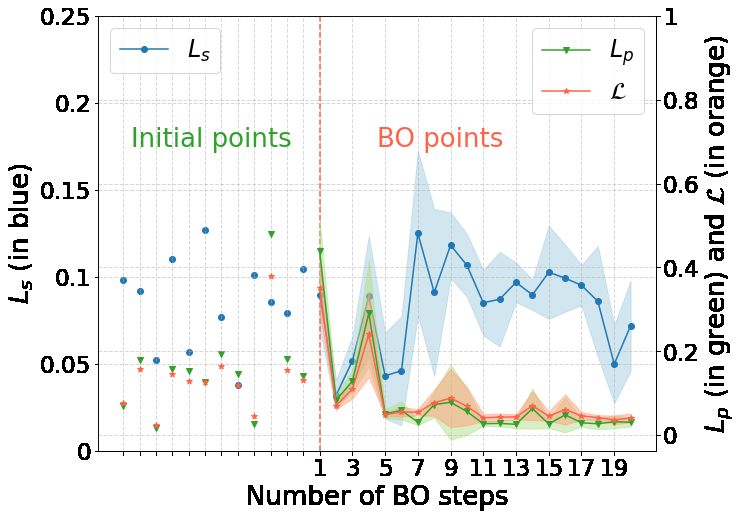
2       Yifan Li et al.

shown that multiple sub-regions (also known as tumor habitats) co-exist within
the tumor, which gives rise to the disparities in tumor composition among pa-
tients and may lead to different patient treatment response [7,8]. Therefore, this
intra-tumoral heterogeneity has significantly challenged the precise treatment of
patients. Clinicians desire a more accurate identification of intra-tumoral inva-
sive sub-regions for targeted therapy.
    Magnetic resonance imaging (MRI) is a non-invasive technique for tumor
diagnosis and monitoring. MRI radiomic features [17] provide quantitative in-
formation for both tumor partition and survival prediction [5, 6]. Mounting ev-
idence supports the usefulness of the radiomic approach in tumor characteri-
zation, evidenced by the Brain Tumor Image Segmentation (BraTS) challenge,
which provides a large dataset of structural MRI sequences, i.e., T1-weighted,
T2-weighted, post-contrast T1-weighted (T1C), and fluid attenuation inversion
recovery (FLAIR). Although providing high tissue contrast, these weighted MRI
sequences are limited by their non-specificity in reflecting tumor biology, where
physiological MRIs, e.g., perfusion MRI (pMRI) and diffusion MRI (dMRI),
could complement. Specifically, pMRI measures vascularity within the tumor,
while dMRI estimates the brain tissue microstructure. Incorporating these com-
plementary multi-modal MRI has emerged as a promising approach for more
accurate tumor characterization and sub-region segmentation for clinical deci-
sion support.
    Unsupervised learning methods have been widely leveraged to identify the
intra-tumoral sub-regions based on multi-modal MRI [3, 13, 15, 19, 22, 23]. Stan-
dard unsupervised learning methods, e.g., K-means, require a pre-defined class
number, which lacks concrete determination criteria, affecting the robustness of
sub-region identification. For instance, some researchers used pre-defined class
numbers according to empirical experience before clustering [3, 13]. Some other
work [11, 23] introduced clustering metrics, e.g., the Calinski-Harabasz (CH) in-
dex, which quantifies the quality of clustering outcomes to estimate the ideal
class number. However, the CH index is sensitive to data scale [11, 23], limit-
ing its generalization ability across datasets. Some other clustering techniques,
e.g., agglomerative clustering, do not require a pre-defined class number and
instead require manual classification. A sensitivity hyper-parameter, however, is
often needed a priori. The clustering results can be unstable during iterations
and across datasets. Due to the above limitations, the generalization ability of
clustering methods has been a significant challenge in clinical applications, par-
ticularly when dealing with heterogeneous clinical data.
    Further, the relevance of clustering results is often assessed using patient sur-
vival in clinical studies [1, 4, 9, 13]. However, existing research seldom addressed
the potential influence of instability posed by the unsupervised clustering algo-
rithms. Joint hyper-parameter optimization considering both clustering stability
and survival relevance is desirable in tumor sub-region partitioning.
    In this paper, we propose a variant of auto-encoder (AE), termed Feature-
enhanced Auto-Encoder (FAE), to identify robust latent feature space con-
stituted by the multiple input MRI modalities and thus alleviate the impact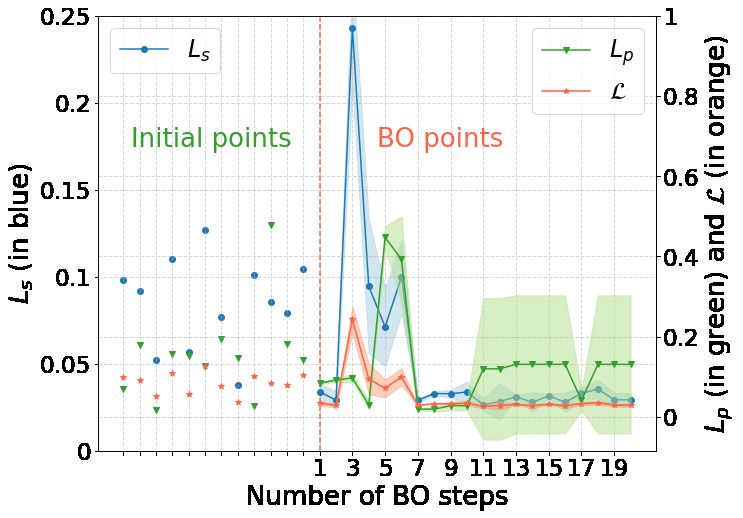
Adaptive learning with enhanced representation for glioblastoma      3

brought by the heterogeneous clinical data. Additionally, we present a Bayesian
optimization (BO) framework [18] to undertake the joint optimization task in
conjunction with a tailored loss function, which ensures clinical relevance while
boosting clustering stability. As a non-parametric optimization technique based
on Bayes’ Theorem and Gaussian Processes (GP) [16], BO learns the repre-
sentation of the underlying data distribution that the most probable candidate
of the hyper-parameters is generated for evaluation in each step. Here, BO is
leveraged to identify the (sub)optimal hyper-parameter set with the potential to
effectively identify robust and clinically relevant tumor sub-regions. The primary
contributions of this work include:

 – Developing a novel loss function that balances the stability of sub-region
   segmentation and the performance of survival prediction.
 – Developing an FAE architecture in the context of glioblastoma studies to
   further enhance individual clinical relevance between input clinical features
   and improve the robustness of clustering algorithms.
 – Integrating a BO framework that enables automatic hyper-parameter search,
   which significantly reduces the computational cost and provides robust and
   clinically relevant results.

   The remainder of this paper is organized as follows. Section 2 describes the
overall study design, the proposed framework, and techniques. Section 3 reports
numerical results, and Section 4 is the concluding remarks.

2   Problem formulation and methodology

Consider an N patients multi-modal MRI dataset Ω with M modalities defined
as {Xm }M m=1 . Xm denotes the mth (pixel-wise) modality values over a collection
                                                     Im,n ×1
of N patients. Xm = {xm,n }N  n=1 , where xm,n ∈ R           and Im,n denotes total
pixel number of an individual MRI image for the mth modality of the nth patient.
    Our goal is to conduct sub-region segmentation on MRI images and perform
clinically explainable survival analysis. Instead of running unsupervised learning
algorithms directly on Xm , we introduce an extra latent feature enhancement
scheme (termed FAE) prior to the unsupervised learning step to further improve
the efficiency and robustness of clustering algorithms.
    As shown in Figure 1(A), FAE aims to produce a set of latent features
{Zm0 }M                                                M
       m0 =1 that represent the original data {Xm }m=1 . Unlike a standard AE
that takes all modalities as input, FAE ‘highlights’ pairwise common features
and produces Z through a set of encoders (denoted as E) and decoders (de-
noted as D). The latent features are then used in unsupervised clustering to
classify tumor sub-region {Pn }N n=1 for all patients. As an intermediate step, we
can now produce spatial features {Fn }N   n=1 from the segmented figures through
radiomic spatial feature extraction methods such as gray level co-occurrence
matrix (GLCM) and Gray Level Run Length Matrix (GLRLM) [12].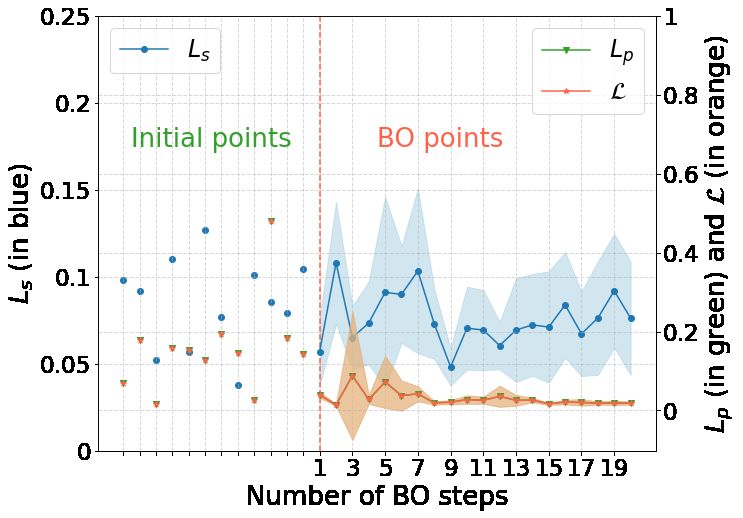
4       Yifan Li et al.

Fig. 1. A: Workflow of the proposed approach. The entire process is modelled under
a Bayesian optimization framework. B: Architecture of FAE. The light orange circle
represents modality Xm overall patients and the blue circle is the latent feature Zm0 .
The green dotted frame denotes the modality pair, and the green trapezoid represents
feature-enhanced encoder E and decoder D. The blue trapezoid indicates the fully
connected decoders Ds . C: Illustration of stability loss calculation. Circles in different
colours represent individual patient MRI data, which are then randomly shuffled for
K times to split into train/validation sets.

2.1   Feature-enhanced auto-encoder

FAE is developed on Auto-encoder (AE), a type of artificial neural network used
for dimensionality reduction. A standard AE is a 3-layer symmetric network that
has the same inputs and outputs. As illustrated in Figure 1(B), FAE contains
                                           W                       W
W feature-enhanced encoder
                           M
                              layers {Ew }w=1 to deal with {Gw }w=1 pairs of
modalities, where W = 2 pairs of modalities (from combination) given M
inputs. The wth encoder takes a pair of modalities from {Xm }M m=1 and encodes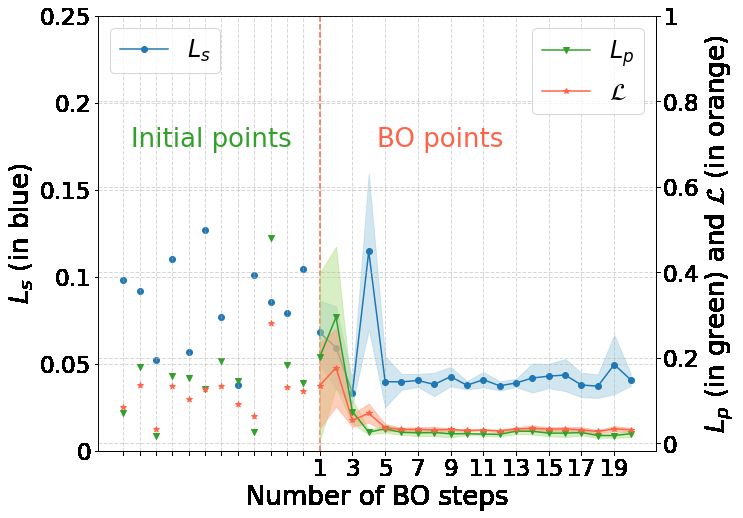
Adaptive learning with enhanced representation for glioblastoma         5

to a representation ew . The central hidden layer of FAE contains {Zm0 }M    m0 =1
nodes that represents M learnt abstract features. FAE also possesses a ‘mirrored’
architecture similar to AE, where W feature-enhanced decoder layers {Dw }W    w=1
are connected to the decoded representations {dw }W  w=1 .
    Unlike the standard symmetric AE, FAE has a ‘dual decoding’ architecture
that an extra fully-connected decoder layer Ds is added to the decoding half of
                                                              0
the networks to connect {dw }W                                  M
                              w=1 directly to the outputs {X m }m=1 . Decoder Ds
aims to pass all outputs information (and correlations) rather than the pairwise
information from Gw in the back-propagation process. As a result, node weights
{Zm0 }M                                                W
       m0 =1 are updated by gradients from both {Dw }w=1 and Ds . In practice, Z
                                                     W
and the encoders are iteratively amended by {Dw }w=1 (i.e., reconstruction loss
from pairwise AEs) and Ds (i.e., global reconstruction loss) in turns.
    FAE enhances the latent features in every pair of input modalities before
reducing the dimensionality from W to M . For instance, ew is a unique rep-
resentation that only depends on (and thus enhances the information of) the
given input pair Gw . Under this dual decoding architecture, FAE takes advan-
tage of highlighting the pairwise information in {Zm0 }M m0 =1 while retaining the
global correlation information from Ds . Another advantage of FAE lies in its
flexibility to the dimensionality of input features. The FAE presented in this
paper always produces the same number of latent features as the input dimen-
sion. The latent dimension might be further reduced manually depending on
computational/clinical needs.

2.2   Patient-wise feature extraction and survival analysis
We implement Kaplan–Meier (KM) survival analysis [1, 13] on spatial features
and sub-region counts {Fn }N n=1 to verify the relevance of clustering sub-regions.
To characterize the intratumoral co-existing sub-regions, we employed the com-
monly used texture features from the GLCM and GLRLM families, i.e., Long
Run Emphasis (LRE), Relative mutual information (RMI), Joint Energy, Run
Variance (RV) and Non-Uniformity. These features are formulated to reflect
the spatial heterogeneity of tumor sub-regions. For example, LRE indicates the
prevalence of a large population of tumor sub-regions. The formulas and inter-
pretations of all these features are detailed in [20]. We next use the k-medoids
technique to classify N patients into high- and low-risk subgroups based on
{Fn }N
     n=1 and then perform KM analysis to analyze the survival significance of
the subgroups to determine the Lp , as described in Section 2.4 and equation 2.

2.3   Constructing problem-specific losses
Stability loss We first introduce a stability quantification scheme to evaluate
clustering stability using pairwise cluster distance [10,21], which will serve as part
of the loss function in hyper-parameter optimization. Specifically, we employ a
Hamming distance method (see [21] for details) to quantify the gap between
clustering models. We first split the MRI training dataset Ω into train and
validation sets, denoted as Ωtrain and Ωval respectively. We then train two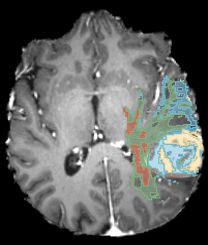
6 Yifan Li et al.
clustering models C (based on Ωtrain ) and C 0 (based on Ωval ). The stability
loss aims to measure the performance of model C on the unseen validation set
Ωval . The distance d(·) (also termed as Ls ) is defined as:
1 X
Ls = d(C, C 0 ) = min 1{π(C(Ωval )6=C 0 (Ωval ))} , (1)
π Ival
Ωval
where Ival denotes the total number of pixels over all MRI images in the vali-
dation set Ωval . 1 represents the Dirac delta function [24] that returns 1 when
the inequality condition is satisfied and 0 otherwise, and function π(·) denotes
the repeated permutations of dataset Ω to guarantee the generalization of the
stability measure [21].
Figure 1 (C) shows the diagram for Ls calculation, where N patients are
randomly shuffled for K times to mitigate the effect of randomness. K pairs of
intermediate latent features {Ztrain,k , Zval,k }K
k=1 are generated through FAE for
training the clustering models C and C 0 . We then compute Ls over K repeated
trials. Ls is normalized to range [0, 1], and smaller values indicates more stable
clusterings.
Significance loss We integrate prior knowledge from clinical survival analysis
and develop a significance loss Lp to quantify clinical relevance between the
clustering outcomes and patient survival, as demonstrated in the below equation:
1 τ
1−τ log( p ) 0 < p ≤ τ
Lp = (2)
− logτ ( τp ) τ < p < 1
where p represents p-value (i.e., statistical significance measure) of the log-rank
test in the survival analysis and τ is a predefined threshold.
This follows the clinical practice that a lower p-value implies that the seg-
mented tumor sub-regions can provide sensible differentiation for patient sur-
vival. In particular, for p less than the threshold, the loss equation returns a
positive reward. Otherwise, for p greater than or equal to τ , the segmented tu-
mor sub-regions are considered undesirable and the penalty increases linearly
with p.
2.4 Bayesian optimization
Hyper-parameters tuning is computational expensive and often requires expert
knowledge, both of which raise practical difficulties in clinical applications. In
this paper, we consider two undetermined hyper-parameters: a quantile threshold
γ ∈ [0, 1] that distinguishes outlier data points from the majority and cluster
number η for the pixel-wise clustering algorithm. We treat the entire process of
Figure 1(A) as a black-box system, of which the input is the hyper-parameter set
θ = [γ, η] and the output is a joint loss L defined as: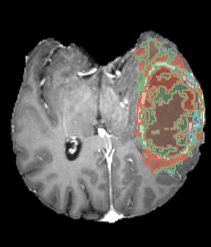
Adaptive learning with enhanced representation for glioblastoma      7

                                L = αLs + (1 − α)Lp                             (3)

where α is a coefficient that balances Ls and Lp and ranges between [0, 1].

 Algorithm 1: Bayesian optimization for hyper-parameter tuning
 1   Initialization of GP surrogate f and the RBF kernel K(·)
 2   while not converged do
 3       Fit GP surrogate model f with {θj , Lj }Jj=1
 4       Propose a most probable candidate θj+1 through Equation (4)
 5       Run Algorithm 2 with θj+1 , and compute loss Lj+1
 6       Estimate current optimal θj+2 of the constructed GP surrogate f 0
 7       Run Algorithm 2 with θj+2 , calculate the loss Lj+2
 8       J =J +2
 9   end
10   Obtain (sub)optimal θ∗ upon convergence

    We address the hyper-parameter tuning issue by modelling the black-box
system under BO, a sequential optimization technique that aims to approximate
the search space contour of θ by constructing a Gaussian Process (GP) surrogate
function in light of data. BO adopts an exploration-exploitation scheme to search
for the most probable θ candidate and therefore minimize the surrogate function
mapping f : Θ → L in J optimization steps, where Θ and L denote input and
output spaces respectively. The GP surrogate is defined as: f ∼ GP(·|µ, Σ);
where µ is the J × 1 mean function vector and Σ is a J × J co-variance matrix
composed by the pre-defined kernel function K(·) over the inputs {θj }Jj=1 . In
this paper, we adopt a standard radial basis function (RBF) kernel (see [2] for
an overview of GP and the kernel functions).
    Given training data ΩB = {θj , Lj }Jj=1 , BO introduces a so-called acquisi-
tion function a(·) to propose the most probable candidate to be evaluated at
each step. Amongst various types of acquisition functions [18], we employ an
EI strategy that seeks new candidates to maximize expected improvement over
the current best sample. Specifically, suppose f 0 returns the best value so far, EI
searches for a new θ candidate that maximizes function g(θ) = max{0, f 0 −f (θ)}.
The EI acquisition can thus be written as a function of θ:

           aEI (θ) = E(g(θ)|ΩB ) = (f 0 − µ)Φ(f 0 |µ, Σ) + ΣN (f 0 |µ, Σ)       (4)

where Φ(·) denotes CDF of the standard normal distribution. In practice, BO
step J increases over time and the optimal θ∗ can be obtained if the predefined
convergence criteria is satisfied. Pseudo-code of the entire process is shown in
both Algorithm 2 and Algorithm 1.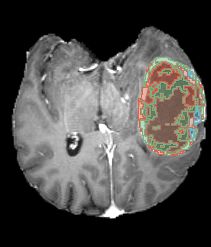
8           Yifan Li et al.

    Algorithm 2: Pseudo-code of the workflow as a component of BO
        // Initialization
    1   Prepare MRI data Ω with N patients and M modalities, perform data
         filtering with quantile threshold γ
        // FAE training follows Figure 1(B)
                                                              M
        Compose W pairs of modalities GW

    2                                       w=1 , where W = 2
    3   Train FAE on {Xm }M                                         W
                              m=1 to generate latent features {Zm0 }m0 =1
        // Stability loss calculation follows Figure 1(C)
    4   for k =1,2,...,K do
    5        Randomly divide Ω into train (Ωtrain ) and validation (Ωval ) sets
    6        Produce latent pairs {Ztrain,k , Zval,k }K
                                                      k=1
             // Pixel-wise clustering
    7        Obtain Ck and Ck0 through standard K-means with η clusters
    8        Compute kth stability loss Ls,k by Eq (1)
    9   end
10      Compute stability score Ls by averaging over {Ls,k }K k=1
        // Sub-region segmentation
11      Obtain patient-wise sub-region segments {Pn }N    n=1
        // Patient-wise feature extraction
12      Extract {Fn }N n=1 for all N patients
        // Survival analysis
13      Cluster patients into high/low risk subgroups based on {Fn }N n=1 using a
         standard K-Medoids algorithm. Perform survival analysis and obtain p
        // BO loss calculation
14      Compute clinical significance score Lp by Eq (2)
15      Compute joint loss L follows Eq (3)

2.5       Experiment details

Data from a total of N = 117 glioblastoma patients were collected and divided
into training set Ω = 82 and test set Ωtest = 35, where the test set was separated
for out-of-sample model evaluation. We collected both pMRI and dMRI data and
co-registered them into T1C images, containing approximately 11 million pixels
per modality over all patients. M = 3 input modalities were calculated, including
rCBV (denoted as r) from pMRI, and isotropic/anisotropic components (denoted
as p/q) of dMRI, thus X = {p, q, r}. Dataset Ω was used for stability loss
calculation with Ωtrain = 57, Ωval = 25. Ls was evaluated over K = 10 trials
for all following experiments. The BO is initialized with J = 10 data points
ΩB , γ ∈ [0, 1] and η is an integer ranges between 3 and 7. The models were
developed on Pytorch platform [14] under Python 3.8. Both encoder E and
decoder D employed a fully connected feed-forward NN with one hidden layer,
where the hidden node number was set to 10. We adopted hyperbolic tangent
as the activation function for all layers, mean squared error (MSE) as the loss
function, and Adam as the optimiser.
Adaptive learning with enhanced representation for glioblastoma 9
3 Results and discussions
We first present the clustering stability of the models incorporating FAE ar-
chitecture, other AE variants against the baseline model and then compare the
performance of the proposed methodology under different experimental settings.
We finally demonstrate the results of survival analysis and independent test.
3.1 Evaluation of FAE based clustering
The results comparing the models are detailed in Table 1. One sees that all three
AE variants show better stability performance than that of the baseline model
in the varying cluster numbers. Of note, our proposed FAE architecture, which
incorporates both standard AE and ensemble AE, outperforms other models in
majority comparisons.
Table 1. Stability performance of cluster algorithms under different AE variants. Base-
line represents the original model without AE. The standard AE represents a standard
3-layer (with 1 hidden layer) feed-forward network and the ensemble AE is the FAE
without dual decoder Ds . The hidden layer contains 10 nodes for all AE variants.
Clusters 3 4 5 6
Stability score
Baseline 0.761±0.026 0.890±0.04 0.744±0.027 0.761±0.035
Standard AE 0.909±0.024 0.896±0.063 0.859±0.06 0.836±0.061
Ensemble AE 0.972±0.013 0.921±0.028 0.872±0.046 0.881±0.046
FAE 0.909±0.048 0.923±0.029 0.911±0.038 0.891±0.048
Calinski-Harabasz (CH) score
Baseline (106 ) 4.12±0.00003 5.16±0.00013 4.82±0.00003 4.73±0.00009
Standard AE (106 ) 5.94±0.63 5.74±0.51 5.50±0.41 5.36±0.28
Ensemble AE (106 ) 10.43±0.67 10.99±0.52 10.98±0.89 11.09±1.00
FAE (106 ) 13.85±4.45 14.85±4.49 15.09±4.19 15.34±4.14
As expected, all AE variants enhance the clustering stability and quality,
shown by the stability score and CH score. The latter of which is relatively sen-
sitive to data scale but can provide reasonable evaluation for a fixed dataset.
In our case, as the dimensions of the original input modalities and the latent
features remain identical (M = 3), the considerably improved stability of the
models incorporating FAE architecture suggests the usefulness of the FAE in
extracting robust features for the unsupervised clustering. Additionally, our ex-
periments show that the FAE demonstrates remarkably stable performance in the
clustering when the training data is randomly selected, which further supports
the resilience of the FAE in extracting generalizable features for distance-based
clustering algorithms.10 Yifan Li et al.
(a) α = 0 (b) α = 0.25
(c) α = 0.5 (d) α = 1
Fig. 2. Performance of the proposed approach with respect to BO step number (on
x-axis). Each figure contains two y-axis: stability loss Ls (in blue) on the left y-axis,
and both significant loss Lp (in green) and joint loss (in orange) on the right y-axis. All
losses are normalized and the shadowed areas in different colors indicate error-bars of
the corresponding curves. Figure (a) - (d) shows the performance with loss coefficient
α = 0, 0.25, 0.5 and 1, respectively.
3.2 Adaptive hyper-parameter tuning
Figure 2 shows the performance of the proposed approach in 4 different α values
in terms of stability score (lower score value indicates better stability). 10 initial
training steps and 20 follow-up BO steps are evaluated in the experiments, all
the results are averaged over 10 repeated trials. One sees significant dispersion
of initial points (dots in the left half of each figure) in all figures, indicating
reasonable randomness of initial points in BO training. BO proposes a new
candidate θ per step after the initial training. One observes that the joint loss
L (orange curves) converges and the proposed approach successfully estimates
(sub)optimal θ∗ in all α cases.
Figure 2(a) shows α = 0 case, for which L = Lp according to Equation (3).
In other words, the algorithm aims to optimize significance loss Lp (green curve)
rather than stability loss Ls (blue curve). As a result, the orange and green
curves overlap with each other, and the stability scores are clearly lower thanAdaptive learning with enhanced representation for glioblastoma 11
that of Ls . A consistent trend can be observed across all four cases that the
error-bar areas of Ls (blue shadowed areas) shrink as the weight of Ls increases
in the joint loss. Similar observations can be seen in Figure 2(d) where α = 1 and
L = Ls , the error-bar area of Lp (green shadowed area) is considerably bigger
than those in the rest α cases. Note that Ls and L also overlap with each other
and the mismatch in the figure is caused by the differences of left and right y-axis
scale. When α = 0.5 (Figure 2(c)), clustering stability can quickly converge in a
few BO steps (around 6 steps in the orange curve), shows the advantage of the
proposed BO integrated method in hyper-parameter optimization.
3.3 Statistical analysis and independent test
Upon convergence of BO, we acquire well-trained FAE encoders to extract fea-
tures from modalities, a well-trained clustering model for tumor sub-region seg-
mentation and a population-level grouping model to divide patients into high-risk
and low-risk subgroups. Subsequently, we apply these well-trained models to the
test set with 35 patients. The results of KM analysis are shown in Figure 3,
illustrating that the spatial features extracted from tumor sub-regions could lead
to patient-level clustering that successfully separates patients into distinct sur-
vival groups in both datasets (Train: p-value = 0.013 Test: p-value = 0.0034).
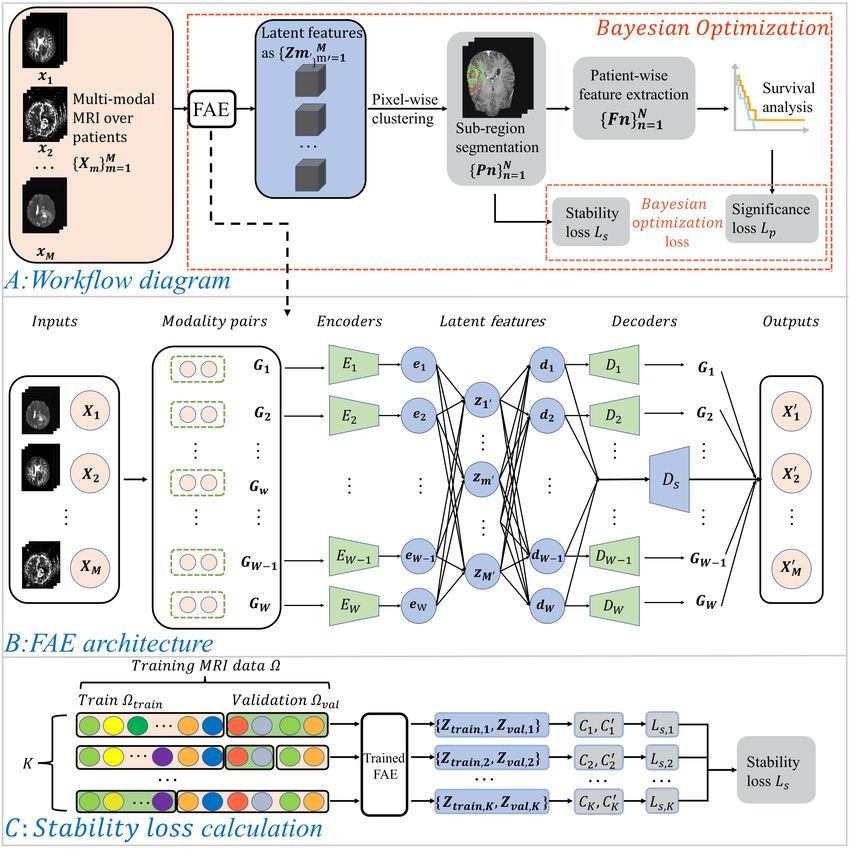
Figure 4 shows two case examples from the high-risk and low-risk subgroups,
respectively, where different colours indicate the partitioned sub-regions. Intu-
itively, these sub-regions are in line with the prior knowledge of proliferating,
necrotic, and edema tumor areas, respectively.
(a) Train set Ω = 82 patients (b) Test set Ωtest = 35 patients
Fig. 3. KM survival curves for the train and test datasets.
4 Conclusions
The paper is an interdisciplinary work that helps clinical research to acquire ro-
bust and effective sub-regions of glioblastoma for clinical decision support. The12 Yifan Li et al.
(a) low-risk (CE) (b) low-risk (NE) (c) high-risk (CE) (d) high-risk (NE)
Fig. 4. Two case examples from the high-risk (a & b) and lower-risk (c & d) group,
respectively. Different colours denote the partitioned sub-regions. The two patients
have significantly different proportions of sub-regions with clinical relevance, which
could provide clinical decision support.
proposed FAE architectures significantly enhance the robustness of the cluster-
ing model and improve the quality of clustering results. Additionally, robust
and reliable clustering solutions can be accomplished with minimal time invest-
ment by integrating the entire process inside a BO framework and presenting
a unique loss function for problem-specific multi-task optimization. Finally, the
independent validation of our methodology using a different dataset strengthens
its viability in clinical applications.
Although we have conducted numerous repeating trials, it is inevitable to
eliminate the randomness for clustering algorithm experiments. In future work,
we could include more modalities and datasets to test the framework. To en-
hance the clinical relevance, more clinical variables could be included into the
BO framework for multi-task optimization. To summarise, the BO framework
combined with the suggested FAE and mixed loss represents a robust frame-
work for obtaining clustering results that are clinically relevant and generalizable
across datasets.
References
1. Beig, N., Bera, K., Prasanna, P., Antunes, J., Correa, R., Singh, S., Bamashmos,
A.S., Ismail, M., Braman, N., Verma, R., et al.: Radiogenomic-Based survival risk
stratification of tumor habitat on Gd-T1w MRI is associated with biological pro-
cesses in glioblastoma. Clinical Cancer Research 26(8), 1866–1876 (2020)
2. Brochu, E., Cora, V.M., De Freitas, N.: A tutorial on Bayesian optimization of
expensive cost functions, with application to active user modeling and hierarchical
reinforcement learning. arXiv preprint arXiv:1012.2599 (2010)
3. Dextraze, K., Saha, A., Kim, D., Narang, S., Lehrer, M., Rao, A., Narang, S.,
Rao, D., Ahmed, S., Madhugiri, V., et al.: Spatial habitats from multiparamet-
ric mr imaging are associated with signaling pathway activities and survival in
glioblastoma. Oncotarget 8(68), 112992 (2017)
4. Leone, J., Zwenger, A.O., Leone, B.A., Vallejo, C.T., Leone, J.P.: Overall survival
of men and women with breast cancer according to tumor subtype. American
journal of clinical oncology 42(2), 215–220 (2019)Adaptive learning with enhanced representation for glioblastoma 13
5. Li, C., Wang, S., Liu, P., Torheim, T., Boonzaier, N.R., van Dijken, B.R., Schönlieb,
C.B., Markowetz, F., Price, S.J.: Decoding the interdependence of multiparametric
magnetic resonance imaging to reveal patient subgroups correlated with survivals.
Neoplasia 21(5), 442–449 (2019)
6. Li, C., Wang, S., Serra, A., Torheim, T., Yan, J.L., Boonzaier, N.R., Huang, Y.,
Matys, T., McLean, M.A., Markowetz, F., et al.: Multi-parametric and multi-
regional histogram analysis of mri: modality integration reveals imaging pheno-
types of glioblastoma. European radiology 29(9), 4718–4729 (2019)
7. Li, C., Wang, S., Yan, J.L., Piper, R.J., Liu, H., Torheim, T., Kim, H., Zou,
J., Boonzaier, N.R., Sinha, R., et al.: Intratumoral heterogeneity of glioblastoma
infiltration revealed by joint histogram analysis of diffusion tensor imaging. Neu-
rosurgery 85(4), 524–534 (2019)
8. Li, C., Yan, J.L., Torheim, T., McLean, M.A., Boonzaier, N.R., Zou, J., Huang,
Y., Yuan, J., van Dijken, B.R., Matys, T., et al.: Low perfusion compartments in
glioblastoma quantified by advanced magnetic resonance imaging and correlated
with patient survival. Radiotherapy and Oncology 134, 17–24 (2019)
9. Mangla, R., Ginat, D.T., Kamalian, S., Milano, M.T., Korones, D.N., Walter,
K.A., Ekholm, S.: Correlation between progression free survival and dynamic sus-
ceptibility contrast MRI perfusion in WHO grade III glioma subtypes. Journal of
neuro-oncology 116(2), 325–331 (2014)
10. Meilă, M.: Comparing clusterings by the variation of information. In: Learning
theory and kernel machines, pp. 173–187. Springer (2003)
11. Meyer-Bäse, A., Saalbach, A., Lange, O., Wismüller, A.: Unsupervised clustering
of fMRI and MRI time series. Biomedical Signal Processing and Control 2(4),
295–310 (2007)
12. Mohanty, A.K., Beberta, S., Lenka, S.K.: Classifying benign and malignant mass
using glcm and glrlm based texture features from mammogram. International Jour-
nal of Engineering Research and Applications 1(3), 687–693 (2011)
13. Park, J.E., Kim, H.S., Kim, N., Park, S.Y., Kim, Y.H., Kim, J.H.: Spatiotempo-
ral Heterogeneity in Multiparametric Physiologic MRI Is Associated with Patient
Outcomes in IDH-Wildtype Glioblastoma. Clinical Cancer Research 27(1), 237–
245 (2021)
14. Paszke, A., Gross, S., Massa, F., Lerer, A., Bradbury, J., Chanan, G., Killeen,
T., Lin, Z., Gimelshein, N., Antiga, L., et al.: Pytorch: An imperative style, high-
performance deep learning library. Advances in neural information processing sys-
tems 32, 8026–8037 (2019)
15. Patel, E., Kushwaha, D.S.: Clustering cloud workloads: K-means vs gaussian mix-
ture model. Procedia Computer Science 171, 158–167 (2020)
16. Rasmussen, C.E.: Gaussian processes in machine learning. In: Summer school on
machine learning. pp. 63–71. Springer (2003)
17. Sala, E., Mema, E., Himoto, Y., Veeraraghavan, H., Brenton, J., Snyder, A.,
Weigelt, B., Vargas, H.: Unravelling tumour heterogeneity using next-generation
imaging: radiomics, radiogenomics, and habitat imaging. Clinical radiology 72(1),
3–10 (2017)
18. Snoek, J., Larochelle, H., Adams, R.P.: Practical Bayesian optimization of machine
learning algorithms. arXiv preprint arXiv:1206.2944 (2012)
19. Syed, A.K., Whisenant, J.G., Barnes, S.L., Sorace, A.G., Yankeelov, T.E.: Mul-
tiparametric analysis of longitudinal quantitative MRI data to identify distinct
tumor habitats in preclinical models of breast cancer. Cancers 12(6), 1682 (2020)14 Yifan Li et al.
20. Van Griethuysen, J.J., Fedorov, A., Parmar, C., Hosny, A., Aucoin, N., Narayan,
V., Beets-Tan, R.G., Fillion-Robin, J.C., Pieper, S., Aerts, H.J.: Computational
radiomics system to decode the radiographic phenotype. Cancer research 77(21),
e104–e107 (2017)
21. Von Luxburg, U.: Clustering stability: an overview. Foundations and Trends in
Machine Learning 2(3), 235–274 (2010)
22. Wu, J., Cui, Y., Sun, X., Cao, G., Li, B., Ikeda, D.M., Kurian, A.W., Li, R.: Unsu-
pervised clustering of quantitative image phenotypes reveals breast cancer subtypes
with distinct prognoses and molecular pathways. Clinical Cancer Research 23(13),
3334–3342 (2017)
23. Xia, W., Chen, Y., Zhang, R., Yan, Z., Zhou, X., Zhang, B., Gao, X.: Radio-
genomics of hepatocellular carcinoma: multiregion analysis-based identification of
prognostic imaging biomarkers by integrating gene data—a preliminary study.
Physics in Medicine & Biology 63(3), 035044 (2018)
24. Zhang, L.: Dirac delta function of matrix argument. International Journal of The-
oretical Physics pp. 1–28 (2020)You can also read