A systematic review and meta analysis of geographic differences in comorbidities and associated severity and mortality among individuals with ...
←
→
Page content transcription
If your browser does not render page correctly, please read the page content below
www.nature.com/scientificreports

                OPEN             A systematic review
                                 and meta‑analysis of geographic
                                 differences in comorbidities
                                 and associated severity
                                 and mortality among individuals
                                 with COVID‑19
                                 Bhaskar Thakur1, Pallavi Dubey2, Joseph Benitez3, Joshua P. Torres3, Sireesha Reddy2,
                                 Navkiran Shokar4, Koko Aung5, Debabrata Mukherjee5 & Alok Kumar Dwivedi1,3,6*

                                 Several comorbidities have been shown to be associated with coronavirus disease 2019 (COVID-
                                 19) related severity and mortality. However, considerable variation in the prevalence estimates of
                                 comorbidities and their effects on COVID-19 morbidity and mortality have been observed in prior
                                 studies. This systematic review and meta-analysis aimed to determine geographical, age, and gender
                                 related differences in the prevalence of comorbidities and associated severity and mortality rates
                                 among COVID-19 patients. We conducted a search using PubMed, Scopus, and EMBASE to include
                                 all COVID-19 studies published between January 1st, 2020 to July 24th, 2020 reporting comorbidities
                                 with severity or mortality. We included studies reporting the confirmed diagnosis of COVID-19 on
                                 human patients that also provided information on comorbidities or disease outcomes. We used
                                 DerSimonian and Laird random effects method for calculating estimates. Of 120 studies with 125,446
                                 patients, the most prevalent comorbidity was hypertension (32%), obesity (25%), diabetes (18%), and
                                 cardiovascular disease (16%) while chronic kidney or other renal diseases (51%, 44%), cerebrovascular
                                 accident (43%, 44%), and cardiovascular disease (44%, 40%) patients had more COVID-19 severity
                                 and mortality respectively. Considerable variation in the prevalence of comorbidities and associated
                                 disease severity and mortality in different geographic regions was observed. The highest mortality
                                 was observed in studies with Latin American and European patients with any medical condition,
                                 mostly older adults (≥ 65 years), and predominantly male patients. Although the US studies observed
                                 the highest prevalence of comorbidities in COVID-19 patients, the severity of COVID-19 among each
                                 comorbid condition was highest in Asian studies whereas the mortality was highest in the European
                                 and Latin American countries. Risk stratification and effective control strategies for the COVID-19
                                 should be done according to comorbidities, age, and gender differences specific to geographical
                                 location.

                                 1
                                  Division of Biostatistics and Epidemiology, Department of Molecular and Translational Medicine, Paul L. Foster
                                 School of Medicine, Texas Tech University Health Sciences Center El Paso, 5001 El Paso Drive, El Paso, TX 79905,
                                 USA. 2Department of Obstetrics and Gynecology, Paul L. Foster School of Medicine, Texas Tech University Health
                                 Sciences Center El Paso, 4800 Alberta Avenue, El Paso, TX 79905, USA. 3Graduate School of Biomedical Sciences,
                                 Texas Tech University Health Sciences Center El Paso, 5001 El Paso Drive, El Paso, TX 79905, USA. 4Department
                                 of Family and Community Medicine, Paul L. Foster School of Medicine, Texas Tech University Health Sciences
                                 Center El Paso, 9849 Kenworthy St., El Paso, TX 79924, USA. 5Department of Internal Medicine, Paul L. Foster
                                 School of Medicine, Texas Tech University Health Science Center El Paso, 4800 Alberta Ave, El Paso, TX 79905,
                                 USA. 6Biostatistics and Epidemiological Consulting Lab, Texas Tech University Health Sciences Center El Paso,
                                 5001 El Paso Drive, El Paso, Texas 79905, USA. *email: alok.dwivedi@ttuhsc.edu

Scientific Reports |   (2021) 11:8562               | https://doi.org/10.1038/s41598-021-88130-w                                               1

                                                                                                                                          Vol.:(0123456789)
www.nature.com/scientificreports/
Abbreviations
COVID-19 Coronavirus disease 2019
SARS-CoV-2 Severe acute respiratory syndrome associated coronavirus 2
SARS-CoV-1 Severe acute respiratory syndrome associated coronavirus 1
WHO World health organization
DM Diabetes mellitus
HTN Hypertension
CKD Chronic kidney disease
COPD Chronic obstructive pulmonary disease
CVD Cardiovascular disease
CVA Cerebrovascular accident
PRISMA Preferred reporting in systematic reviews and meta-analyses
SAMBR Statistical analysis and methods in biomedical research
ICU Intensive care unit
MINORS Methodological index for non-randomized studies
CI Confidence interval
ACE2 Angiotensin-converting enzyme 2
RAAS Renin–angiotensin–aldosterone system
The world health organization (WHO) officially declared the novel coronavirus (COVID-19) infected by SARS-
CoV-2 (severe acute respiratory syndrome coronavirus 2) as a global pandemic on March 11th 2020 because of
the alarming level of transmission, the evolving disparities among cases, and rising mortality r ates1. The current
strategies for managing COVID-19 are mainly with treatments that showed promising results in observational
or preliminary clinical trial studies or recommended for an earlier outbreak of SARS-CoV-1. Given the nature
of transmission of SARS-CoV-2 and the lack of any available antiviral therapy or vaccine, the optimal approach
to treatment remains unclear. Rapidly evolving data provides guidance on therapeutic approach, including risk
stratification utilizing comorbidities and laboratory features associated with severe COVID-19, prevention of
venous thromboembolism, empiric treatment for bacterial pneumonia, addressing hypoxia and use of immu-
nomodulatory agents on a case-by-case b asis2–5.
Numerous studies have identified comorbidities associated with the adverse prognosis of COVID-19. Age,
gender, and at least a few comorbidities have been shown to be the strongest predictors of prognosis of COVID-19
patients6–10. Prior systematic reviews and meta-analyses confirmed that diabetes mellitus (DM) and hypertension
(HTN) are strongly associated with mortality in COVID-19 p atients11 and most frequently observed conditions in
12
COVID-19 . However, malignancy and DM were found to be associated with disease severity in prior meta-anal-
yses13,14. Other meta-analyses11,14,15 showed that chronic kidney disease (CKD), chronic obstructive pulmonary
disease (COPD), cardiovascular disease (CVD), DM, and HTN are the major risk factors predicting severity in
COVID-19 patients. In contrast, a large study identified CKD as the major risk factor for mortality while COPD
as the risk factor for the severity of COVID-199. Another meta-analysis16 showed that cerebrovascular disease
(CVA) is strongly associated with the severity and mortality in COVID-19. Most of these reviews were based
on the analysis of studies where the majority of participants were from China. Recently, several observational
studies from the US, Europe, and Latin America also demonstrated some coexisting diseases associated with
the severity and mortality among COVID-19 patients17–19. Some studies20–22 reported COPD, CKD, malignancy,
HTN, and DM as the prominent risk factors for disease severity or mortality in COVID-19 patients while other
studies23–29 showed no association between these comorbidities and the disease outcomes. These studies at times
reported rather inconsistent and conflicting findings. Rapid accumulation of data on comorbidities associated
with poor prognosis of COVID-19 warrant updating the evidence.
The continental differences in the distribution of COVID-19 comorbidities, disease severity and mortal-
ity are more likely due to the variation in the timing of COVID-19 spread, population size, and prevalence of
comorbidities among COVID-19 patients, age and gender distribution, implementation of mitigation strategies,
diagnostic testing, capacity, COVID-19 management strategies, and reporting a ccuracy30,31. A proper under-
standing of coexisting diseases associated with COVID-19 severity and mortality is paramount to effectively
allocate healthcare resources, endorse appropriate preventive and containment measures, and guide emerging
treatment protocols. We sought to perform a comprehensive systematic review and meta-analysis to determine
the differences in the prevalence of major comorbidities associated with COVID-19 and the severity and mortal-
ity of COVID-19 associated with each of the comorbidities according to the geographical regions. In addition,
we also aimed to determine the impact of age and gender on the distribution of different comorbidities, severity,
and mortality among COVID-19 patients.
Methods
Data sources and search strategy. We followed the preferred reporting in systematic reviews and meta-
analyses (PRISMA)32 guidelines and SAMBR33 checklists for conducting and reporting this study. We conducted
a systematic literature search using multiple electronic databases including PubMed, Scopus, and EMBASE
between Jan 1st, 2020 to July 24th, 2020. The search strategy was designed to retrieve all published articles on
COVID-19 reporting comorbidities and outcomes in the reported comorbidities. We applied various combina-
tions of Boolean operators by using the following keywords for our search: [(SARS-Cov-2 OR 2019-nCOv OR
COVID-19 OR coronavirus) AND (comorbidities OR comorbid OR comorbidity) AND (“severity” OR “second-
ary infection” OR “critical care” OR “ICU” OR intensive care unit” OR “fatality rate” OR “Death” OR “Mortal-
ity”)]. In addition, the references from review or other systematic review studies were cross-checked to retrieve
Scientific Reports | (2021) 11:8562 | https://doi.org/10.1038/s41598-021-88130-w 2
Vol:.(1234567890)www.nature.com/scientificreports/
any additional articles that were missed at the initial search. Three persons (BT, JT, and JB) reviewed all articles
to eliminate any duplicated study. Studies with similar authors, the duration of data collection, and the location
of the study were strictly matched to further identify any duplicated study. All the duplicates were omitted from
the analyses.
Study selection. Studies were eligible for inclusion in our systematic review if they met the following cri-
teria: (1) originally published in the English language; (2) included confirmed diagnosis of COVID-19 through
laboratory examination; (3) conducted on human patients; (4) provided information about comorbidities; (5)
contained information on the disease outcomes: severity or mortality within comorbidity; and (6) published as
an original investigation. Studies without diagnostic information, involved the pediatric population, and per-
formed surgical procedures were excluded from the analysis. In addition, any studies published as case reports
and case series with smaller numbers (≤ 10) were also excluded from the analyses.
Data extraction. All relevant information from the eligible studies were extracted and recorded in an excel
datasheet. The following information was extracted from each study: study characteristics involved the first
author of the study; geographical region (US, Europe, Latin America, Asia, South America); sample size (total
number of patients with COVID-19); the average age in years with standard deviation or interquartile range;
gender (male and female ratio); status of the comorbidities (number of subjects without any comorbidity, num-
ber of subjects with one comorbidity, number of subjects with multiple comorbidities), the type of comorbidity
that included HTN, DM, CVD, obesity, CVA, lung disease, cancer/malignancy, either chronic or acute kidney
or other renal diseases (CKD) and liver disease, and the outcomes of COVID-19 (number of severe cases and
number of fatalities) within each comorbid condition. The detail information on the inclusion of comorbidities,
outcomes including the criteria for COVID-19 severity assessment, and comparing variables is provided in an
additional (supplementary file).
Quality assessment. Methodological Index for Non-Randomized Studies (MINORS) scale was used
uality34. Three authors (BT, JT, and JB) independently graded the quality of the
for critical appraisal of study q
included studies using Sundemo et al. 2019 methods35. Consensus discussions were carried out among the three
authors to resolve any disagreements. Additional information on quality assessment and publication bias is
included in the additional file (supplementary file).
Statistical analysis. We estimated the pooled proportion of underlying medical conditions, severity, and
mortality among each comorbidity separately by geographic region (Asia, Europe, Latin America, USA) using
a random effects meta-analysis of proportions with DerSimonian and Laird (D&L) method36. A priori random
effects model was applied due to considerable heterogeneity across the studies. We applied the Freeman-Tukey
double arcsine method for computing a 95% confidence interval (CI) for each proportion to obtain a reasonable
range. The pooled proportion of each comorbidity, severity, and mortality was estimated according to average
age groups (≤ 50 years, 51 – 64 years, and ≥ 65 years) and percentage of the female population (≤ 50%: male dom-
inant vs. > 50%: female dominant) using random effects meta-analysis of proportions with the D&L method.
Meta-regression analyses with Knapp-Hartung modification were also performed to determine associations of
demographic data with disease outcomes. All the estimated proportions were summarized with their 95%CI and
I2 statistic37. An I2 greater than 50% was considered as an indication of presence of heterogeneity. All statistical
analyses were conducted using Stata 15.1.
Results
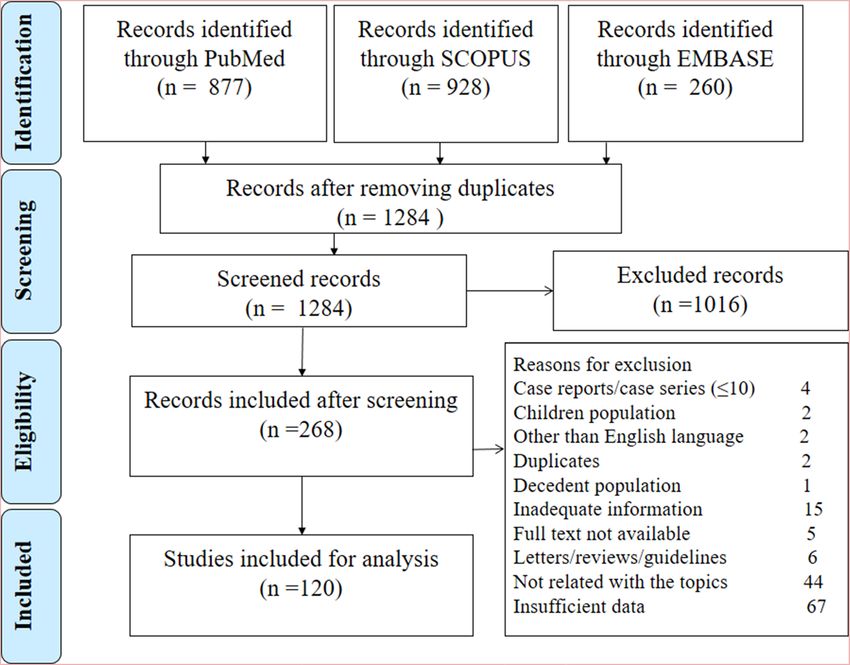
Characteristics of included studies. Figure 1 shows the search pattern and exclusion of articles with
specific reasons at each step. Out of 120 eligible studies, 118 studies were conducted in 19 countries (China:
59; USA: 16; Italy: nine; Spain: five; Iran: five; India: three; South Korea: three; Brazil: three; Mexico: two; Swit-
zerland: two; Turkey: two; UK: two; Denmark: one; France: one; Germany: one; Netherlands: one; Oman: one;
Poland: one; and South Africa: one) and two studies represented multiple countries (one study comprised two
European countries and another study comprised 13 Asian countries). In our quality appraisal, we observed
a high quality of conducting and reporting of 101 studies (94.2%) and fair quality in the rest of the 19 studies
(5.83%). The detail of study characteristics and quality assessment of each study is included in the additional file
(Supplementary Tables 1 and 2). No evidence of publication bias or small sample size effect was observed for the
estimation of prevalence of comorbidity or associated mortality except for the severity in some comorbidities
(additional file: Supplementary Table 3).
Of the total, 72 studies reported from Asia, 26 from Europe, 16 from the USA, five from Latin America,
and one from South Africa. These studies yielded a total sample size of 125,546 patients (Asia: 50.6%, Europe:
11.1%; USA: 16.4%; Latin America: 19.6%, and South Africa: 2.4%). The female proportion was estimated as 45%
(95% CI: 43%, 47%) with the highest in South Africa followed by Asia, USA, and Latin America and the lowest
in Europe. The mean age of the patients was 56.2 years (95% CI: 52.6 – 59.8 years) with the highest in Europe
(64.8 years), followed by the USA (60.4 years), Asia (54.4 years), and Latin America (50.2 years) (additional file:
Supplementary Table 4).
Proportions of comorbid diseases. In the pooled estimation of all studies, over half of the COVID-19
cases had at least one comorbidity while less than one-third of COVID cases had multiple comorbidities (28%;
95%CI: 18–40%). The history of liver disease and CVA were frequently reported in Asian studies while rarely
Scientific Reports | (2021) 11:8562 | https://doi.org/10.1038/s41598-021-88130-w 3
Vol.:(0123456789)www.nature.com/scientificreports/
Figure 1. PRISMA flowchart for the selection of studies at different stages.
reported in other country studies. In contrast, obesity was rarely reported from Asian studies. The most preva-
lent comorbidity was HTN (32%; 95%CI: 95% CI: 28%, 36%) followed by obesity (25%; 95% CI: 17%, 34%), DM
(18%; 95% CI: 15%, 20%), CVD (16%; 95% CI: 13%, 19%), lung disease (9%; 95%CI: 7–11%), and CKD (6%;
95%CI: 5–8%) while other underlying medical conditions were estimated to be 4–5% (Fig. 2). All the considered
comorbidities except for the liver disease were frequently observed in the US studies (range: 10–51%) followed
by South African (range: 9–42%), European (range: 2–40%), Latin American (range: 3–32%), and Asian (range:
3–25%) studies. HTN, DM, and CVD remained the top three medical conditions among COVID-19 cases in the
USA (51%, 31%, and 32% respectively), Europe (40%, 20%, and 25% respectively), Latin America (32%, 18%,
and 20% respectively) and Asia (25%, 14%, and 10% respectively) regions. The prevalence of multiple comor-
bidities was also observed highest in the US (48%) and European (40%) studies compared to Asian (23%) and
Latin American (19%) studies. Significant differences in all comorbidities other than CVA and liver disease were
observed between geographic regions (Table 1, additional file: Supplementary Table 5). All the estimates yielded
a substantial presence of heterogeneity across studies (Table 1). Studies with older adults (≥ 65 years) were asso-
ciated with the increased prevalence of most comorbidities (Table 2, additional file: Supplementary Table 6).
However, no substantial difference in the proportion of any comorbidities between male and female-dominant
studies was observed (Table 3).
Severity of COVID‑19 patients within each comorbidity. The disease severity was highly prevalent
in CKD patients (51%; 95%CI: 39–64%) whereas a similar level of severity of COVID-19 cases was observed in
CVD (44%), CVA (43%), DM (42%), and lung disease (42%) conditions followed by HTN (39%) and malig-
nancy (37%) conditions. The least proportion of disease severity was estimated in liver disease (23%) and
obese (33%) patients. COVID-19 severity remained similar in patients with at least one comorbidity (41%) or
multiple comorbidities (44%) but substantially higher than COVID-19 cases without any comorbidity (19%)
(Fig. 3). Other than liver disease and obesity, COVID-19 severity (range: 40–68%) was found to be highest
among patients with any comorbidities in Asian studies compared to the studies from other geographic locations
(additional file: Supplementary Table 5). The most common cause of the severity of COVID-19 was CKD (68%;
95%CI: 46–87%) in Asian studies, liver disease (50%; 95%CI: 1–99%) in European and Latin American studies,
and malignancy in the US studies (38%; 95%CI: 18–60%). Patients with medical conditions such as CVD, lung
disease, and DM were associated with a similar level of severity in Asian studies (50–55%) (Table 2). Age and
gender differences in COVID-19 severity according to comorbidities were not observed (additional file: Sup-
plementary Table 6, Tables 2, 3). However, female dominant studies tended to show more severe cases among
patients with HTN (44% vs. 38%), DM (48% vs. 41%), CVA (54% vs. 39%), and CKD (76% vs. 40%) compared
to male-dominant studies (Table 3).
Mortality of COVID‑19 patients within each comorbidity. Compared to COVID-19 patients without
any preexisting condition, the overall mortality proportion was much higher among patients with CVA (44%,
95% CI: 31%, 58%), CKD (44%, 95% CI: 35%, 53%), and CVD (40%, 95% CI: 34%, 46%). The other underlying
Scientific Reports | (2021) 11:8562 | https://doi.org/10.1038/s41598-021-88130-w 4
Vol:.(1234567890)www.nature.com/scientificreports/
Figure 2. Prevalence of comorbidities among COVID-19 patients.
conditions were associated with similar levels of mortality (range: 30–33%) except for obesity (27%) (Fig. 4). In
Latin American studies, the highest proportion of mortality was observed in CKD (81%) and liver disease (65%)
patients. The mortality proportion remained similar in other conditions (51–55%) in Latin American studies
but higher than studies from other geographic regions. Similarly, COVID-19 coexisted with CKD (60%) or
liver disease (49%) had the highest mortality in European studies as well. European patients with CVD (44%),
malignancy (44%), DM (41%), lung disease (40%), obesity (37%), and HTN (36%) had a higher mortality rate
compared to other studies from the US or Asia. The highest mortality was observed in patients with CVA (48%)
followed by CKD (38%) and CVD (36%) in Asian studies whereas CVD (40%) and CVA (39%) had the high-
est mortality in the US studies (Table 1). Significant geographic differences in mortality proportions associated
with underlying medical conditions were also observed (Table 1 and additional file: Supplementary Table 5).
Older adults without any comorbidities had a 14% mortality rate (95%CI: 3–30%) with 10% (95%CI: 6–15%) in
predominantly male studies without any medical conditions. An increasing trend in mortality proportion was
observed with higher age groups in COVID-19 patients with CVD, malignancy, and one comorbidity whereas a
decreasing trend in mortality proportion was noticed in CKD patients (Table 2). Compared to female-dominant
studies, male-dominant studies had a high rate of mortality among patients with any comorbid conditions other
than CKD and liver disease. However, gender differences in mortality within each comorbidity were not found
to be statistically significant (Table 3).
Discussion
In our meta-analysis, HTN, obesity, DM, and CVD were more frequently observed in COVID-19 patients
whereas mortality was more frequently observed in COVID-19 patients with CVD, CVA, and CKD. The pres-
ence of CVD and their most prominent risk factors such as HTN and DM have been shown to be associated with
COVID-19 disease11,38 because SARS-CoV-2 binds to the angiotensin-converting enzyme 2 (ACE2) receptor
by interaction with viral spike protein which allows the virus to enter into host c ells39–41. Furthermore, several
medications for the treatment of COVID-19 may yield cardiovascular adverse events, and COVID-19 may also
directly cause CVD or aggravate underlying C VD40,42,43. Interaction of SARS-CoV-2 with the renin–angioten-
sin–aldosterone system (RAAS) may likely to observe in HTN and DM patients reflecting as the most prevalent
conditions in COVID-19 p atients9. Furthermore, immunocompromised patients are at high risk for developing
Scientific Reports | (2021) 11:8562 | https://doi.org/10.1038/s41598-021-88130-w 5
Vol.:(0123456789)www.nature.com/scientificreports/
Asia Europe Latin America USA
N P (95% CI) I2 N P (95% CI) I2 N P (95% CI) I2 N P (95% CI) I2 p value
Comorbidities
One comorbidity 56 0.43 (0.39, 0.47) 98.2 12 0.66 (0.60, 0.72) 95.7 2 0.45 (0.45, 0.46) ID 6 0.87 (0.77, 0.95) 99.5 < 0.001
Multiple comorbidities 7 0.23 (0.14, 0.33) 97.6 1 0.40 (0.36, 0.44) ID 1 0.19 (0.19, 0.20) ID 2 0.48 (0.48, 0.49) ID 0.183
HTN 58 0.25 (0.22, 0.28) 98.0 21 0.40 (0.33, 0.47) 97.8 1 0.32 (0.25, 0.41) ID 12 0.51 (0.40, 0.61) 99.5 < 0.001
DM 62 0.14 (0.12, 0.16) 96.5 22 0.20 (0.17, 0.23) 92.7 4 0.18 (0.08, 0.33) 99.5 13 0.31 (0.26, 0.36) 98.1 < 0.001
CVD 56 0.10 (0.07, 0.13) 99.3 21 0.25 (0.20, 0.30) 96.7 4 0.20 (0.06, 0.40) 99.7 12 0.32 (0.26, 0.39) 98.8 < 0.001
Obesity 1 0.04 (0.03, 0.04) ID 8 0.19 (0.14, 0.31) 94.9 4 0.08 (0.03, 0.17) 99.2 11 0.39 (0.33, 0.46) 98.3 0.002
CVA 29 0.04 (0.03, 0.05) 85.2 1 0.02 (0.00, 0.08) ID NA NA NA 3 0.10 (0.05, 0.15) ID 0.283
Lung disease 52 0.06 (0.04, 0.08) 98.6 19 0.13 (0.09, 0.18) 97.6 4 0.04 (0.00, 0.12) 99.3 12 0.19 (0.15, 0.23) 97.0 < 0.001
Cancer/malignancy 41 0.03 (0.02, 0.04) 95.4 13 0.11 (0.08, 0.14) 93.0 NA NA NA 7 0.10 (0.08, 0.13) 95.1 < 0.001
CKD/other renal
33 0.03 (0.02, 0.03) 89.9 11 0.09 (0.03, 0.17) 99.2 3 0.03 (0.01, 0.07) ID 12 0.19 (0.15, 0.23) 97.7 < 0.001
disease
Liver disease 37 0.05 (0.03, 0.09) 98.4 2 0.02 (0.01, 0.02) ID 2 0.01 (0.01, 0.01) ID 3 0.03 (0.02, 0.04) 66.7 0.879
Severity
Total 29 0.29 (0.24, 0.34) 96.0 4 0.30 (0.29, 0.30) 74.8 1 0.30 (0.29, 0.30) ID 4 0.33 (0.18, 0.50) 99.5 0.176
One comorbidity 29 0.46 (0.39, 0.53) 92.4 4 0.21 (0.16, 0.27) 62.6 1 0.41 (0.40, 0.42) ID 4 0.35 (0.22, 0.49) 99.0 0.119
No comorbidity 29 0.17 (0.13, 0.21) 91.0 4 0.33 (0.03, 0.75) 97.4 1 0.20 (0.19, 0.21) ID 4 0.25 (0.08, 0.46) 98.0 0.604
Multiple comorbidities 5 0.56 (0.40, 0.71) 84.8 1 0.16 (0.11, 0.21) ID 1 0.48 (0.46, 0.50) ID 1 0.21 (0.19, 0.23) ID 0.006
HTN 39 0.45 (0.40, 0.51) 88.8 12 0.29 (0.21, 0.37) 81.2 1 0.22 (0.11, 0.37) ID 7 0.34 (0.24, 0.44) 97.3 0.044
DM 41 0.50 (0.44, 0.57) 85.9 11 0.31 (0.24, 0.38) 55.3 1 0.38 (0.21, 0.56) ID 8 0.31 (0.23, 0.40) 94.5 0.057
CVD 39 0.55 (0.46, 0.63) 86.7 11 0.35 (0.20, 0.51) 92.8 1 0.17 (0.00, 0.64) ID 7 0.31 (0.21, 0.43) 96.1 0.139
Obesity 1 0.24 (0.19, 0.29) ID 6 0.37 (0.28, 0.47) 68.2 1 0.30 (0.18, 0.45) ID 8 0.31 (0.21, 0.42) 97.1 0.877
CVA 15 0.47 (0.38, 0.56) 49.0 1 0.00 (0.00, 0.84) ID NA NA NA 2 0.23 (0.19, 0.29) ID 0.069
Lung disease 32 0.52 (0.40, 0.65) 85.2 11 0.35 (0.27, 0.44) 42.0 1 0.25 (0.01, 0.81) ID 8 0.29 (0.20, 0.40) 93.5 0.189
Cancer/malignancy 23 0.40 (0.29, 0.51) 53.5 7 0.29 (0.14, 0.46) 61.5 NA NA NA 4 0.38 (0.18, 0.60) 96.1 0.811
CKD/other renal
21 0.68 (0.46, 0.87) 86.3 6 0.36 (0.20, 0.54) 50.3 NA NA NA 7 0.33 (0.24, 0.44) 91.6 0.001
disease
Liver disease 26 0.22 (0.14, 0.31) 54.3 1 0.50 (0.01, 0.99) ID 1 0.50 (0.01, 0.99) ID 1 0.35 (0.20, 0.54) ID 0.815
Mortality
Total 24 14 (0.10, 0.19) 98.6 5 0.31 (0.16, 0.48) 99.3 2 0.11 (0.11, 012) ID 3 0.23 (0.11, 0.37) ID 0.206
One comorbidity 24 0.24 (0.17, 0.31) 97.1 5 0.39 (0.23, 0.56) 98.9 2 0.18 (0.17, 0.19) ID 3 0.26 (0.16, 0.36) ID 0.391
No comorbidity 24 0.06 (0.03, 0.09) 97.4 5 0.14 (0.01, 0.38) 99.1 2 0.06 (0.05, 0.06) ID 3 0.06 (0.01, 0.13) ID 0.306
Multiple comorbidities 4 0.14 (0.03, 0.32) 95.2 NA NA NA 1 0.25 (0.23, 0.26) ID 2 0.28 (0.27, 0.29) ID 0.130
HTN 27 0.28 (0.21, 0.36) 96.7 10 0.36 (0.27, 0.46) 96.8 NA NA NA 7 0.28 (0.23, 0.34) 95.2 0.277
DM 30 0.27 (0.21, 0.34) 92.8 11 0.41 (0.32, 0.51) 92.2 3 0.55 (0.45, 0.64) ID 7 0.28 (0.23, 0.33) 92.1 < 0.001
CVD 29 0.36 (0.28, 0.45) 91.3 12 0.44 (0.36, 0.52) 90.2 3 0.55 (0.47, 0.62) ID 7 0.40 (0.31, 0.51) 97.1 0.035
Obesity NA NA NA 3 0.37 (0.22, 0.53) ID 3 0.51 (0.41, 0.61) ID 6 0.17 (0.11, 0.24) 95.2 0.008
CVA 13 0.48 (0.29, 0.67) 80.2 NA NA NA NA NA NA 2 0.39 (0.34, 0.45) ID 0.672
Lung disease 24 0.33 (0.21, 0.47) 90.0 8 0.40 (0.28, 0.54) 89.5 3 0.53 (0.49, 0.57) ID 6 0.24 (0.19, 0.30) 75.5 0.080
Cancer/malignancy 20 0.27 (0.13, 0.44) 75.1 6 0.44 (0.30, 0.58) 91.4 NA NA NA 4 0.30 (0.23, 0.37) 87.6 0.083
CKD/other renal
16 0.38 (0.20, 0.57) 85.0 5 0.60 (0.41, 0.79) 94.5 3 0.81 (0.61, 0.95) ID 8 0.33 (0.27, 0.39) 84.9 0.001
disease
Liver disease 14 0.27 (0.10, 0.47) 85.2 1 0.49 (0.38, 0.60) ID 1 0.65 (0.54, 0.75) ID 3 0.23 (0.17, 0.30) ID 0.123
Table 1. The proportion estimates of underlying medical diseases and associated COVID-19 severity and
mortality by geographic region. N Number of studies, P Proportion, CI Confidence interval, ID Insufficient
data, NA Not available, HTN Hypertension, DM Diabetes mellitus, CVD Cardiovascular disease, CVA
Cerebrovascular accident, CKD Chronic kidney disease, I2 Index for between studies heterogeneity.
any infectious diseases and immune dysfunction has been linked with HTN, DM, obesity, CVD, lung disease,
and CKD indicating these medical conditions as more common in COVID-19 patients as w ell42–44. Patients
with CVD, CKD, and a history of CVA have been observed at high risk for mortality in COVID-19 in our study.
These conditions share common risk factors including increased allostatic load, and COVID-19 may either
induce or aggravate these conditions by impacting ACE2 receptor, RAAS function, immune, hemostatic and
nervous system damage, and major physiological s ystems40,45. Our study suggests that COVID-19 patients with
chronic diseases regardless of geographic location should be given proper health care attention and prioritized
for vaccination.
Scientific Reports | (2021) 11:8562 | https://doi.org/10.1038/s41598-021-88130-w 6
Vol:.(1234567890)www.nature.com/scientificreports/
Age ≤ 50 years 50 years < Age ≤ 65 years Age > 65 years
N P (95% CI) I2 N P (95% CI) I2 N P (95% CI) I2 p value
Comorbidities
One comorbidity 20 0.34 (0.29, 0.40) 96.4 44 0.53 (0.45, 0.61) 99.4 10 0.75 (0.63, 0.85) 98.0 < 0.001
Multiple comorbidities 4 0.13 (0.07, 0.20) 98.5 5 0.43 (0.35, 0.50) 96.6 2 0.33 (0.29, 0.37) ID 0.002
HTN 20 0.17 (0.13, 0.20) 94.4 52 0.33 (0.28, 0.38) 99.0 18 0.48 (0.39, 0.56) 98.0 < 0.001
DM 22 0.12 (0.09, 0.15) 93.8 56 0.18 (0.15, 0.21) 98.3 20 0.25 (0.19, 0.31) 97.3 < 0.001
CVD 21 0.10 (0.03, 0.20) 99.5 54 0.14 (0.11, 0.17) 98.8 19 0.30 (0.24, 0.37) 97.3 < 0.001
Obesity 5 0.13 (0.04, 0.27) 99.5 11 0.31 (0.18, 0.46) 99.7 7 0.27 (0.20, 0.35) 94.4 0.237
CVA 5 0.03 (0.01, 0.07) 95.4 23 0.04 (0.03, 0.05) 78.6 5 0.09 (0.05, 0.15) 88.0 0.170
Lung disease 20 0.05 (0.02, 0.10) 99.1 48 0.09 (0.07, 0.11) 97.9 16 0.14 (0.11, 0.18) 87.3 0.058
Cancer/malignancy 11 0.02 (0.01, 0.04) 89.5 37 0.05 (0.04, 0.07) 96.7 11 0.09 (0.06, 0.13) 92.0 0.013
CKD/other renal disease 11 0.03 (0.01, 0.05) 94.3 34 0.05 (0.03, 0.07) 98.3 12 0.17 (0.10, 0.24) 98.0 < 0.001
Liver disease 15 0.04 (0.01, 0.06) 96.0 24 0.06 (0.03, 0.09) 98.8 6 0.03 (0.01, 0.06) 80.8 0.703
Severity
One comorbidity 16 0.39 (0.33, 0.45) 86.4 19 0.44 (0.36, 0.51) 97.3 3 0.37 (0.25, 0.50) ID 0.961
No comorbidity 16 0.12 (0.08, 0.16) 94.4 19 0.26 (0.19, 0.34) 96.1 3 0.25 (0.09, 0.45) ID 0.283
Multiple comorbidities 4 0.44 (0.39, 0.49) 57.1 4 0.46 (0.26, 0.67) 94.7 NA NA NA 0.001
HTN 18 0.40 (0.33, 0.47) 77.7 34 0.40 (0.35, 0.46) 93.8 7 0.36 (0.23, 0.50) 89.5 0.870
DM 19 0.46 (0.38, 0.54) 77.8 35 0.42 (0.36, 0.48) 90.8 7 0.35 (0.25, 0.46) 69.6 0.798
CVD 18 0.41 (0.31, 0.51) 77.8 33 0.46 (0.39, 0.54) 88.4 7 0.37 (0.20, 0.57) 93.5 0.713
Obesity 4 0.32 (0.19, 0.46) 93.3 8 0.31 (0.21, 0.41) 96.6 4 0.40 (0.28, 0.52) 66.3 0.742
CVA 5 0.50 (0.30, 0.69) 59.0 15 0.42 (0.30, 0.55) 71.1 1 0.45 (0.23, 0.68) 0.699
Lung disease 17 0.33 (0.23, 0.45) 71.6 28 0.46 (0.37, 0.55) 88.9 7 0.38 (0.28, 0.49) 25.5 0.653
Cancer/malignancy 11 0.47 (0.29, 0.65) 55.0 18 0.31 (0.21, 0.42) 81.4 4 0.50 (0.14, 0.86) 82.9 0.533
CKD/other renal disease 9 0.64 (0.26, 0.95) 94.5 21 0.47 (0.35, 0.60) 87.4 4 0.39 (0.29, 0.49) 30.1 0.239
Liver disease 14 0.19 (0.09, 0.31) 37.8 13 0.29 (0.14, 0.44) 66.1 2 0.37 (0.09, 0.70) ID 0.883
Mortality
One comorbidity 6 0.14 (0.06, 0.25) 97.3 21 0.27 (0.20, 0.35) 98.2 5 0.44 (0.31, 0.57) 93.9 0.035
No comorbidity 6 0.02 (0.00, 0.04) 95.9 21 0.08 (0.04, 0.13) 97.8 5 0.14 (0.03, 0.30) 93.4 0.113
Multiple comorbidities 4 0.14 (0.03, 0.31) 97.2 2 0.28 (0.27, 0.29) ID 1 0.26 (0.18, 0.36) ID 0.397
HTN 4 0.28 (0.10, 0.51) 96.0 27 0.31 (0.25, 0.38) 96.8 11 0.35 (0.28, 0.41) 91.1 0.730
DM 5 0.35 (0.15, 0.57) 95.0 30 0.31 (0.24, 0.39) 97.2 13 0.36 (0.31, 0.42) 74.7 0.772
CVD 6 0.34 (0.14, 0.56) 90.6 29 0.40 (0.33, 0.48) 95.8 13 0.47 (0.39, 0.54) 90.1 0.411
Obesity 1 0.50 (0.07, 0.93) ID 6 0.21 (0.10, 0.34) 97.7 4 0.32 (0.23, 0.43) 80.2 0.663
CVA 1 0.20 (0.08, 0.39) ID 10 0.50 (0.29, 0.71) 83.5 4 0.48 (0.38, 0.57) 0.0 0.363
Lung disease 5 0.36 (0.22, 0.5) 0.0 25 0.30 (0.22, 0.38) 92.5 9 0.45 (0.31, 0.59) 85.1 0.410
Cancer/malignancy 2 0.14 (0.03, 0.32) ID 19 0.33 (0.22, 0.44) 88.1 7 0.40 (0.30, 0.50) 39.2 0.513
CKD/other renal disease 4 0.68 (0.10, 1.00) 93.0 17 0.45 (0.32, 0.58) 94.5 9 0.38 (0.31, 0.46) 78.4 0.542
Liver disease 3 0.24 (0.00, 0.72) ID 12 0.34 (0.15, 0.54) 93.9 4 0.31 (0.12, 0.52) 0.0 0.595
Table 2. The proportion estimates of underlying medical diseases and associated COVID-19 severity and
mortality by age groups. N Number of studies, P Proportion, CI Confidence interval, ID Insufficient data, NA
Not available, HTN Hypertension, DM Diabetes mellitus, CVD Cardiovascular disease, CVA Cerebrovascular
accident, CKD Chronic kidney disease, I2 Index for between studies heterogeneity.
The highest mortality among all comorbidities was observed in European studies compared to the US and
Asian studies despite lower prevalence of comorbidities compared to the US studies and lower severity prevalence
in each comorbidity compared to Asian studies. This mostly occurred due to more elderly and male patients
compounded with the second highest proportions of underlying medical conditions and disease severity in
some comorbidities in European studies. In addition, an early hit of the pandemic in European regions espe-
cially in the elderly population might have also created a surge in these populations. In contrast, a single study
from South Africa yielded the lowest mortality rate even with high proportions of DM (40.4%) and HTN (42%)
patients. This could be due to the inclusion of predominantly females in the study compared to other region
studies. Older age, male gender, and presence of at least one comorbidity have been shown to be independently
associated with mortality in COVID-19 p atients9. In another meta-analysis10, the mortality rate in COVID-19
has also been reported to be highest in the European region compared to the US or other regions. Our meta-
analysis also estimated the highest rate of mortality in Latin American studies despite having younger patients
than studies from other regions. Although the specific reason for this finding is yet not clear, a limited number of
studies from Latin American regions might have amplified the proportion estimates of mortality among different
Scientific Reports | (2021) 11:8562 | https://doi.org/10.1038/s41598-021-88130-w 7
Vol.:(0123456789)www.nature.com/scientificreports/
Male dominant studies Female dominant studies
(≤ 50%) (> 50%)
N P (95% CI) I2 N P (95% CI) I2 p value
Comorbidities
One comorbidity 57 0.51 (0.44, 0.57) 99.5 17 0.53 (0.40, 0.65) 98.4 0.728
Multiple comorbidities 8 0.27 (0.15, 0.40) 99.8 3 0.33 (0.16, 0.54) ID 0.617
HTN 68 0.33 (0.28, 0.38) 99.1 23 0.28 (0.22, 0.34) 99.0 0.175
DM 73 0.19 (0.16, 0.22) 98.4 27 0.16 (0.12, 0.20) 98.7 0.112
CVD 70 0.16 (0.13, 0.20) 99.0 26 0.14 (0.08, 0.22) 99.6 0.498
Obesity 18 0.26 (0.17, 0.35) 99.5 6 0.22 (0.08, 0.40) 99.8 0.957
CVA 24 0.05 (0.03, 0.06) 88.4 9 0.04 (0.02, 0.06) 88.4 0.483
Lung disease 65 0.09 (0.07, 0.11) 97.4 22 0.08 (0.05, 0.12) 98.9 0.793
Cancer/malignancy 44 0.06 (0.04, 0.07) 96.8 16 0.04 (0.01, 0.07) 98.8 0.478
CKD/other renal disease 43 0.07 (0.05, 0.10) 98.8 17 0.04 (0.02, 0.06) 97.9 0.091
Liver disease 29 0.06 (0.03, 0.09) 98.6 16 0.03 (0.01, 0.06) 97.0 0.508
Severity
One comorbidity 30 0.40 (0.35, 0.45) 96.8 8 0.46 (0.34, 0.58) 84.5 0.250
No comorbidity 30 0.17 (0.14, 0.21) 95.4 8 0.27 (0.13, 0.43) 94.4 0.682
Multiple comorbidities 7 0.38 (0.25, 0.53) 98.5 1 1.00 (0.63, 1.00) ID 0.154
HTN 43 0.38 (0.33, 0.43) 92.4 15 0.44 (0.37, 0.52) 86.5 0.288
DM 42 0.41 (0.36, 0.46) 86.3 18 0.48 (0.38, 0.57) 89.7 0.414
CVD 41 0.43 (0.36, 0.50) 89.2 16 0.47 (0.37, 0.58) 86.2 0.900
Obesity 12 0.32 (0.24, 0.40) 94.5 4 0.36 (0.19, 0.55) 95.5 0.472
CVA 15 0.39 (0.28, 0.50) 64.9 6 0.54 (0.35, 0.73) 70.8 0.293
Lung disease 37 0.41 (0.34, 0.49) 85.0 15 0.42 (0.29, 0.56) 79.7 0.517
Cancer/malignancy 23 0.34 (0.24, 0.45) 81.5 11 0.44 (0.28, 0.60) 54.5 0.809
CKD/other renal disease 25 0.40 (0.31, 0.49) 80.0 9 0.76 (0.45, 0.98) 88.7 < 0.001
Liver disease 18 0.23 (0.12, 0.35) 58.5 11 0.27 (0.14, 0.43) 41.5 0.922
Mortality
One comorbidity 24 0.29 (0.22, 0.36) 98.9 9 0.24 (0.15, 0.34) 94.3 0.514
No comorbidity 24 0.10 (0.06, 0.15) 98.7 9 0.01 (0.00, 0.03) 48.1 0.160
Multiple comorbidities 6 0.19 (0.14, 0.25) 96.4 1 0.26 (0.18, 0.36) ID 0.804
HTN 31 0.33 (0.28, 0.38) 96.4 12 0.26 (0.17, 0.37) 98.0 0.098
DM 35 0.35 (0.29, 0.41) 96.7 15 0.29 (0.19, 0.39) 96.4 0.189
CVD 35 0.43 (0.38, 0.49) 95.6 14 0.36 (0.23, 0.49) 95.0 0.151
Obesity 8 0.32 (0.22, 0.43) 96.8 4 0.17 (0.08, 0.28) 87.9 0.205
CVA 11 0.47 (0.32, 0.62) 80.9 4 0.39 (0.08, 0.73) 74.9 0.870
Lung disease 31 0.37 (0.29, 0.44) 91.8 10 0.26 (0.17, 0.36) 84.4 0.410
Cancer/malignancy 22 0.36 (0.27, 0.45) 86.7 7 0.24 (0.16, 0.34) 25.5 0.334
CKD/other renal disease 23 0.44 (0.36, 0.53) 93.1 10 0.44 (0.23, 0.66) 96.4 0.565
Liver disease 13 0.29 (0.13, 0.48) 93.7 6 0.38 (0.07, 0.75) 72.0 0.803
Table 3. The proportion estimates of underlying medical diseases and associated COVID-19 severity and
mortality by gender distribution. N Number of studies, P Proportion, CI Confidence interval, ID Insufficient
data, HTN Hypertension, DM Diabetes mellitus, CVD Cardiovascular disease, CVA Cerebrovascular accident,
CKD Chronic kidney disease, I2 Index for between studies heterogeneity.
comorbid conditions. Other potential reasons for having high mortality in Latin American countries could be the
differential approaches to COVID-19 testing and timing and implementation of mitigation strategies compared
to other geographic regions along with resource constrained health systems, allocation strategies of resources,
inequality and poverty, and internal political dynamics30,46. Similar to another meta-analysis10, our study also
confirmed the lower rate of mortality in the Asian region and a South African study than the European and
American regions. It appears that the varying immune profile of individuals from different racial groups can
modulate their risk of disease infection and autoimmunity and may respond differently to novel infections47.
Preliminary evidence showed a trend towards the slower spread of COVID-19 in countries where the national
Bacillus Calmette–Guérin vaccine policy is current for a ll48. Based on distributions of age and gender with dif-
ferential prevalence of comorbid conditions associated with disease outcomes specific to geographic regions,
we suggest the joint evaluation of country-specific demographic and comorbid factors for stratifying risk for
COVID-19 disease severity and mortality.
Scientific Reports | (2021) 11:8562 | https://doi.org/10.1038/s41598-021-88130-w 8
Vol:.(1234567890)www.nature.com/scientificreports/
Figure 3. Proportion of COVID-19 severity among patients with underlying medical comorbidities.
Our study estimated the highest proportion of all comorbidities in US studies compared to studies from
other countries. The prevalence of comorbid conditions have been reported to be higher in the overall US
population which may be reflecting the higher prevalence of each comorbid condition in COVID-19 patients
as well49–51. COVID-19 severity in the US remained lower than Asian and European studies even with high
proportions of HTN and multiple comorbidities. This empirical observation indirectly suggests that RAAS
inhibitors may not adversely impact COVID-19 patients with underlying medical conditions, although this
needs further validation39,52. The low rate of mortality within each comorbidity in the US studies even with
the high prevalence of underlying disease conditions is likely due to optimal management of COVID-19 cases
with underlying disorders, timely and strategic implementation of mitigation strategies, avoiding unnecessary
medication use, and proper reporting of public health practices30. Our stratified analyses clearly showed that
higher COVID-19 severity was more likely to occur in all underlying medical conditions in the Asian region
compared to other regions. Although a direct comparison of severity among each of the comorbid conditions is
not available in COVID-19 across geographic locations, socio-demographic, cultural, behavioral, and biological
factors might explain the differential prevalence of the disease severity in Asian studies47,53. Our study suggests
developing COVID-19 management policies specific to geographic regions. For example, some regions need
proper implementation of mitigation strategies and vaccination policy to minimize COVID-19 spread among
at-risk individuals while some regions require adequate resources with proper guidelines, and management
strategies for minimizing disease severity.
This study has confirmed higher mortality in older adults (> 65 years) with all the underlying medical diseases
except for CKD patients. This could be due to the inclusion of Latin American studies involving the youngest age
patients and demonstrating a higher rate of mortality in CKD and obese patients. Mortality risk in older adults
with comorbidities was also confirmed in other studies29,54,55. Similar to our study, a study also confirmed that
older adults with underlying diseases including DM, HTN, CVD, liver diseases, and malignancy have been more
likely to develop a critical illness56. Our meta-analysis also confirmed that there was no substantial difference
in the burden of comorbidities between male or female-dominant studies. In consistent with a single-center
retrospective study29 and another meta-analysis57, we also observed higher rates of disease severity with most
of the underlying medical conditions in female-dominant studies while higher mortality rates were observed
in male-dominant studies. Gender differences in mortality rates in all underlying medical conditions could be
due to the sex hormones and sex chromosome genes associated with different immune responses58,59. Like we
Scientific Reports | (2021) 11:8562 | https://doi.org/10.1038/s41598-021-88130-w 9
Vol.:(0123456789)www.nature.com/scientificreports/
Figure 4. Proportion of mortality among COVID-19 patients with underlying medical comorbidities.
observed geographical differences in COVID-19 severity and mortality, the geographical differences in COVID-
19 therapeutic practices have also been observed60. COVID-19 prevention and treatment strategies should be
effectively implemented to elderly population and individuals with underlying disease conditions.
We have some limitations in our study. Although we have used random effects models to estimate propor-
tions, high heterogeneity across the studies and publication biases in few subgroup analyses might produce biased
estimates. Given the variations in study populations, we estimated prevalence estimates within each comorbidity
stratified by geographic regions. However, the variation in racial/ethnic and socioeconomic populations might
further yield heterogeneity in the proportion estimates. Limited studies from Africa and Latin America may
produce higher estimates in these subpopulations. Furthermore, we could not explore the regional differences in
disease outcomes in Asian countries due to limited studies from South and West Asia. Since the majority of the
studies included in our study were retrospective and conducted in different countries, missing, misclassification,
and variation in reporting of medical conditions may be present. While our study is the most update-to-date
and comprehensive, our restriction to studies with only English language and upcoming evidence as COVID-19
is evolving might impact the findings of our study. Despite these limitations, to the best of our knowledge, our
study is the first comprehensive systematic review and meta-analysis that produced estimates of major underlying
medical conditions with COVID-19, and COVID-19 severity and mortality within each comorbidity by including
a large number of high-quality studies from the US, Europe, Asia, and other countries with large sample sizes.
Our methodological rigor and stratified analysis of the study population by geographic regions yielded reliable
and regional specific findings to develop an effective control policy for this COVID-19 pandemic.
Conclusions
In conclusion, we observed high prevalence estimates of major comorbid conditions in US studies. Among
patients with any comorbidities, the highest disease severity was estimated in Asian region while the highest
mortality in European and Latin American regions. The mortality among those with underlying medical diseases
was estimated to be high in mostly elderly and predominantly male patients with considerable mortality in older
patients without any comorbidities. COVID-19 severity and mortality were highly variable based on medical
conditions specific to geographic regions. These findings clearly suggest that country-specific comorbidities
should ideally be used to evaluate and stratify risk for the COVID-19 disease severity and mortality. We suggest
Scientific Reports | (2021) 11:8562 | https://doi.org/10.1038/s41598-021-88130-w 10
Vol:.(1234567890)www.nature.com/scientificreports/
developing policies across the globe with particular attention to specific geographic/ethnic populations such as
avoiding COVID-19 spread to individuals with underlying medical conditions especially in the US population,
protecting elderly male and sick individuals from SARS-CoV-2 infection mainly from European regions, and
managing life-threatening COVID-19 complications particularly in Asian patients. In addition, at-risk individu-
als according to geographic regions should be given a priority for vaccination. Our study prioritizes comorbid
conditions associated with the disease severity and mortality and provides insights for targeted risk stratification
and effective control management of this pandemic.
Data availability
The dataset for the current study is available from the corresponding author on reasonable request.
Received: 13 November 2020; Accepted: 1 April 2021
References
1. Mahase, E. Covid-19: WHO declares pandemic because of “alarming levels” of spread, severity, and inaction. BMJ 368, m1036
(2020).
2. Cervantes, J. et al. Factors associated with COVID-19 severity and mortality among Hispanic patients living on the USA-Mexico
border. J. Investig. Med. 69, 819–823 (2021).
3. Lin, K. J. et al. Pharmacotherapy for hospitalized patients with COVID-19: treatment patterns by disease severity. Drugs 80(18),
1961–1972 (2020).
4. Moores, L. K. et al. Prevention, diagnosis, and treatment of VTE in patients with coronavirus disease 2019: CHEST guideline and
expert panel report. Chest 158(3), 1143–1163 (2020).
5. KA, Y. & GR, T. Coronavirus disease 2019 (COVID-19): management in hospitalized adults. In: UpToDate (ed Post, T. W.) (UpTo-
Date, 2021). https://www.uptodate.com/contents/covid-19-clinical-features.
6. El Aidaoui, K. et al. Predictors of severity in Covid-19 patients in Casablanca, Morocco. Cureus. 12(9), e10716 (2020).
7. Mahil, S. K. et al. Factors associated with adverse COVID-19 outcomes in patients with psoriasis—insights from a global registry-
based study. J. Allergy Clin. Immunol. 147, 60–71 (2020).
8. Yazdanpanah, Y., French CCSG. Impact on disease mortality of clinical, biological and virological characteristics at hospital admis-
sion and over time in COVID-19 patients. J. Med. Virol. 93(4), 2149–2159 (2020).
9. Fang, X. et al. Epidemiological, comorbidity factors with severity and prognosis of COVID-19: a systematic review and meta-
analysis. Aging (Albany NY). 12(13), 12493–12503 (2020).
10. Noor, F. M. & Islam, M. M. Prevalence and associated risk factors of mortality among COVID-19 patients: a meta-analysis. J.
Community Health. 45(6), 1270–1282 (2020).
11. Nandy, K. et al. Coronavirus disease (COVID-19): a systematic review and meta-analysis to evaluate the impact of various comor-
bidities on serious events. Diabetes Metab Syndr. 14(5), 1017–1025 (2020).
12. Singh, A. K. et al. Prevalence of co-morbidities and their association with mortality in patients with COVID-19: a systematic
review and meta-analysis. Diabetes Obes. Metab. 22(10), 1915–1924 (2020).
13. Li, J. et al. Meta-analysis investigating the relationship between clinical features, outcomes, and severity of severe acute respiratory
syndrome coronavirus 2 (SARS-CoV-2) pneumonia. Am. J. Infect. Control. 49(1), 82–89 (2020).
14. Luo, L., Fu, M., Li, Y., Hu, S., Luo, J., Chen, Z. et al. The potential association between common comorbidities and severity and
mortality of coronavirus disease 2019: a pooled analysis. Clin. Cardiol. 43(12), 1478–1493 (2020).
15. Wang, B., Li, R., Lu, Z. & Huang, Y. Does comorbidity increase the risk of patients with COVID-19: evidence from meta-analysis.
Aging (Albany NY). 12(7), 6049–6057 (2020).
16. Pranata, R., Huang, I., Lim, M. A., Wahjoepramono, E. J. & July, J. Impact of cerebrovascular and cardiovascular diseases on mor-
tality and severity of COVID-19-systematic review, meta-analysis, and meta-regression. J. Stroke Cerebrovasc. Dis. 29(8), 104949
(2020).
17. Docherty, A. B. et al. Features of 20 133 UK patients in hospital with covid-19 using the ISARIC WHO Clinical Characterisation
Protocol: prospective observational cohort study. BMJ 369, m1985 (2020).
18. de Souza, W. M. et al. Epidemiological and clinical characteristics of the COVID-19 epidemic in Brazil. Nat. Hum. Behav. 4(8),
856–865 (2020).
19. Chand, S. et al. COVID-19-associated critical illness-report of the first 300 patients admitted to intensive care units at a New York
City Medical Center. J. Intensive Care Med. 35(10), 963–970 (2020).
20. Atkins, J. L. et al. Preexisting comorbidities predicting COVID-19 and mortality in the UK biobank community cohort. J. Gerontol.
A Biol. Sci. Med. Sci. 75(11), 2224–2230 (2020).
21. Biswas, M., Rahaman, S., Biswas, T. K., Haque, Z. & Ibrahim, B. Association of sex, age, and comorbidities with mortality in
COVID-19 patients: a systematic review and meta-analysis. Intervirology 64(1), 36–47 (2021).
22. Guan, W. J. et al. Comorbidity and its impact on 1590 patients with COVID-19 in China: a nationwide analysis. Eur. Respir. J.
55(5), 2000547. https://doi.org/10.1183/13993003.00547-2020 (2020).
23. Bajgain, K. T., Badal, S., Bajgain, B. B. & Santana, M. J. Prevalence of comorbidities among individuals with COVID-19: a rapid
review of current literature. Am. J. Infect. Control. 49(2), 238–246 (2021).
24. Filardo, T. D. et al. Comorbidity and clinical factors associated with COVID-19 critical illness and mortality at a large public
hospital in New York City in the early phase of the pandemic (March-April 2020). PLoS ONE 15(11), e0242760 (2020).
25. Palaiodimos, L. et al. Severe obesity, increasing age and male sex are independently associated with worse in-hospital outcomes,
and higher in-hospital mortality, in a cohort of patients with COVID-19 in the Bronx, New York. Metabolism 108, 154262 (2020).
26. Petrilli, C. M. et al. Factors associated with hospital admission and critical illness among 5279 people with coronavirus disease
2019 in New York City: prospective cohort study. BMJ 369, m1966 (2020).
27. Simonnet, A. et al. High prevalence of obesity in severe acute respiratory syndrome Coronavirus-2 (SARS-CoV-2) requiring
invasive mechanical ventilation. Obesity (Silver Spring) 28(7), 1195–1199 (2020).
28. Wang, F. et al. Pancreatic injury patterns in patients with coronavirus disease 19 pneumonia. Gastroenterology 159(1), 367–370
(2020).
29. Yang, X. et al. Clinical course and outcomes of critically ill patients with SARS-CoV-2 pneumonia in Wuhan, China: a single-
centered, retrospective, observational study. Lancet Respir. Med. 8(5), 475–481 (2020).
30. Team CC-R. Geographic differences in COVID-19 cases, deaths, and incidence—United States, February 12–April 7, 2020. MMWR
Morb. Mortal. Wkly. Rep. 69(15), 465–471 (2020).
31. Dubey, P., Reddy, S. Y., Manuel, S. & Dwivedi, A. K. Maternal and neonatal characteristics and outcomes among COVID-19 infected
women: an updated systematic review and meta-analysis. Eur. J. Obstet. Gynecol. Reprod. Biol. 252, 490–501 (2020).
Scientific Reports | (2021) 11:8562 | https://doi.org/10.1038/s41598-021-88130-w 11
Vol.:(0123456789)www.nature.com/scientificreports/
32. Moher D, Liberati A, Tetzlaff J, Altman DG, Group P. Preferred reporting items for systematic reviews and meta-analyses: the
PRISMA statement. PLoS Med. 6(7), e1000097 (2009).
33. Dwivedi, A. K. & Shukla, R. Evidence-based statistical analysis and methods in biomedical research (SAMBR) checklists according
to design features. Cancer Rep. (Hoboken). 3(4), e1211 (2020).
34. Slim, K. et al. Methodological index for non-randomized studies (minors): development and validation of a new instrument. ANZ
J. Surg. 73(9), 712–716 (2003).
35. Sundemo, D. et al. Generalised joint hypermobility increases ACL injury risk and is associated with inferior outcome after ACL
reconstruction: a systematic review. BMJ Open Sport Exerc. Med. 5(1), e000620 (2019).
36. DerSimonian, R. & Laird, N. Meta-analysis in clinical trials. Control Clin. Trials. 7(3), 177–188 (1986).
37. Pathak, M., Dwivedi, S. N., Deo, S. V. S., Sreenivas, V. & Thakur, B. Which is the preferred measure of heterogeneity in meta-analysis
and why? A revisit. Biostat. Biometrics Open Acc. J. 1(1), 1–7 (2017).
38. Aggarwal, G. et al. Association of cardiovascular disease with coronavirus disease 2019 (COVID-19) severity: a meta-analysis.
Curr. Probl. Cardiol. 45(8), 100617 (2020).
39. Kanwal, A., Agarwala, A., Martin, L. W., Handberg, E. M. & Yang, E. COVID-19 and Hypertension: What We Know and Don’t
Know. American College of Cardiology. https://www.acc.org/latest-in-cardiology/articles/2020/07/06/08/15/covid-19-and-hyper
tension. (2020).
40. Nishiga, M., Wang, D. W., Han, Y., Lewis, D. B. & Wu, J. C. COVID-19 and cardiovascular disease: from basic mechanisms to
clinical perspectives. Nat Rev Cardiol. 17(9), 543–558 (2020).
41. Wu, C. et al. Risk factors associated with acute respiratory distress syndrome and death in patients with coronavirus disease 2019
pneumonia in Wuhan, China. JAMA Intern. Med. 180(7), 934–943 (2020).
42. Driggin, E. et al. Cardiovascular considerations for patients, health care workers, and health systems during the COVID-19 pan-
demic. J. Am. Coll. Cardiol. 75(18), 2352–2371 (2020).
43. Limsreng, S. et al. Dyslipidemias and elevated cardiovascular risk on lopinavir-based antiretroviral therapy in Cambodia. PLoS
ONE 11(8), e0160306 (2016).
44. Fortis, A., Garcia-Macedo, R., Maldonado-Bernal, C., Alarcon-Aguilar, F. & Cruz, M. The role of innate immunity in obesity. Salud
Publica Mex. 54(2), 171–177 (2012).
45. Ssentongo, P., Ssentongo, A. E., Heilbrunn, E. S., Ba, D. M. & Chinchilli, V. M. Association of cardiovascular disease and 10 other
pre-existing comorbidities with COVID-19 mortality: a systematic review and meta-analysis. PLoS ONE 15(8), e0238215 (2020).
46. Pablos-Mendez, A., Vega, J., Aranguren, F. P., Tabish, H. & Raviglione, M. C. Covid-19 in Latin America. BMJ 370, m2939 (2020).
47. Pan, D. et al. The impact of ethnicity on clinical outcomes in COVID-19: a systematic review. EClinicalMedicine. 23, 100404 (2020).
48. Mahase, E. Covid-19: what treatments are being investigated?. BMJ 368, m1252 (2020).
49. Raghupathi, W. & Raghupathi, V. An empirical study of chronic diseases in the United States: a visual analytics approach. Int. J.
Environ. Res. Public Health. 15(3) (2018).
50. Persons. AAoR. Chronic Conditions among Older Americans. Available from: https://assets.aarp.org/rgcenter/health/beyond_
50_hcr_conditions.pdf.
51. Fried, L. America’s Health and Health Care Depend on Preventing Chronic Disease. Available from: https://www.huffpost.com/
entry/americas-health-and-healthcare-depends-on-preventing_b_58c0649de4b070e55af9eade.
52. Fang, L., Karakiulakis, G. & Roth, M. Are patients with hypertension and diabetes mellitus at increased risk for COVID-19 infec-
tion?. Lancet Respir. Med. 8(4), e21 (2020).
53. King’s College London. 2020 O. Black and Asian patients have increased risk of severe COVID-19 at different stages of the disease,
UK study finds. ScienceDaily. 2020 October 9, 2020.
54. Martins-Filho, P. R., Tavares, C. S. S. & Santos, V. S. Factors associated with mortality in patients with COVID-19. A quantitative
evidence synthesis of clinical and laboratory data. Eur. J. Intern. Med. 76, 97–99 (2020).
55. Ruan, Q., Yang, K., Wang, W., Jiang, L. & Song, J. Clinical predictors of mortality due to COVID-19 based on an analysis of data
of 150 patients from Wuhan, China. Intensive Care Med. 46(5), 846–848 (2020).
56. Cai, Q. et al. COVID-19 in a designated infectious diseases hospital outside Hubei Province, China. Allergy 75(7), 1742–1752
(2020).
57. Fu, L. et al. Clinical characteristics of coronavirus disease 2019 (COVID-19) in China: a systematic review and meta-analysis. J.
Infect. 80(6), 656–665 (2020).
58. Barbu, M. G., Thompson, R. J., Thompson, D. C., Cretoiu, D. & Suciu, N. The impact of SARS-CoV-2 on the most common
comorbidities—a retrospective study on 814 COVID-19 deaths in Romania. Front. Med. (Lausanne). 7, 567199 (2020).
59. Klein, S. L. & Flanagan, K. L. Sex differences in immune responses. Nat. Rev. Immunol. 16(10), 626–638 (2016).
60. Dubey, P. et al. Current trends and geographical differences in therapeutic profile and outcomes of COVID-19 among pregnant
women - a systematic review and meta-analysis. BMC Pregnancy Childbirth. 21(1), 247 (2021).
Acknowledgements
We appreciate the efforts of all the researchers whose articles were included in this study.
Author contributions
B.T., P.D., and A.D. designed and conceptualized study; B.T., J.B., and J.T. performed searches, reviewed all arti-
cles for their eligibility, and conducted quality assessment of each study independently; K.A. and B.T. reviewed
search strategies; B.T., J.B., and J.T. extracted data; B.T., A.D., and P.D. verified the underlying data; B.T. and A.D.
performed meta-analysis and prepared results and tables; B.T. and A.D. drafted the manuscript; S.R., N.S., K.A.,
D.M., A.D. provided guidance, interpretation, review, and edits in the manuscript. All authors have substantially
contributed to design phase, interpretation of results, and edited manuscript. B.T. and A.D. take responsibility
for the integrity of the data and accuracy of the data analysis.
Funding
No financial support was received for this study.
Competing interests
The authors declare no competing interests.
Additional information
Supplementary information The online version contains supplementary material available at https://doi.org/
10.1038/s41598-021-88130-w.
Scientific Reports | (2021) 11:8562 | https://doi.org/10.1038/s41598-021-88130-w 12
Vol:.(1234567890)You can also read