A structured ICA based process for removing auditory evoked potentials
←
→
Page content transcription
If your browser does not render page correctly, please read the page content below
www.nature.com/scientificreports

                OPEN             A structured ICA‑based process
                                 for removing auditory evoked
                                 potentials
                                 Jessica M. Ross1,2*, Recep A. Ozdemir1,2, Shu Jing Lian1, Peter J. Fried1,2, Eva M. Schmitt4,
                                 Sharon K. Inouye3,4, Alvaro Pascual‑Leone2,4,5 & Mouhsin M. Shafi1,2

                                 Transcranial magnetic stimulation (TMS)-evoked potentials (TEPs), recorded using
                                 electroencephalography (EEG), reflect a combination of TMS-induced cortical activity and multi-
                                 sensory responses to TMS. The auditory evoked potential (AEP) is a high-amplitude sensory
                                 potential—evoked by the “click” sound produced by every TMS pulse—that can dominate the TEP and
                                 obscure observation of other neural components. The AEP is peripherally evoked and therefore should
                                 not be stimulation site specific. We address the problem of disentangling the peripherally evoked
                                 AEP of the TEP from components evoked by cortical stimulation and ask whether removal of AEP
                                 enables more accurate isolation of TEP. We hypothesized that isolation of the AEP using Independent
                                 Components Analysis (ICA) would reveal features that are stimulation site specific and unique
                                 individual features. In order to improve the effectiveness of ICA for removal of AEP from the TEP,
                                 and thus more clearly separate the transcranial-evoked and non-specific TMS-modulated potentials,
                                 we merged sham and active TMS datasets representing multiple stimulation conditions, removed
                                 the resulting AEP component, and evaluated performance across different sham protocols and
                                 clinical populations using reduction in Global and Local Mean Field Power (GMFP/LMFP) and cosine
                                 similarity analysis. We show that removing AEPs significantly reduced GMFP and LMFP in the post-
                                 stimulation TEP (14 to 400 ms), driven by time windows consistent with the N100 and P200 temporal
                                 characteristics of AEPs. Cosine similarity analysis supports that removing AEPs reduces TEP similarity
                                 between subjects and reduces TEP similarity between stimulation conditions. Similarity is reduced
                                 most in a mid-latency window consistent with the N100 time-course, but nevertheless remains high
                                 in this time window. Residual TEP in this window has a time-course and topography unique from
                                 AEPs, which follow-up exploratory analyses suggest could be a modulation in the alpha band that is
                                 not stimulation site specific but is unique to individual subject. We show, using two datasets and two
                                 implementations of sham, evidence in cortical topography, TEP time-course, GMFP/LMFP and cosine
                                 similarity analyses that this procedure is effective and conservative in removing the AEP from TEP, and
                                 may thus better isolate TMS-evoked activity. We show TEP remaining in early, mid and late latencies.
                                 The early response is site and subject specific. Later response may be consistent with TMS-modulated
                                 alpha activity that is not site specific but is unique to the individual. TEP remaining after removal of
                                 AEP is unique and can provide insight into TMS-evoked potentials and other modulated oscillatory
                                 dynamics.

                                 Abbreviations
                                 BIDMC	Beth Israel Deaconess Medical Center
                                 BWH	Brigham and Women’s Hospital
                                 HMS	Harvard Medical School
                                 HSL	Hebrew SeniorLife
                                 MGH	Massachusetts General Hospital

                                 1
                                  Berenson‑Allen Center for Noninvasive Brain Stimulation, Beth Israel Deaconess Medical Center, 330
                                 Brookline Avenue, KS‑423, Boston, MA, USA. 2Department of Neurology, Harvard Medical School, Boston, MA,
                                 USA. 3Department of Medicine, Harvard Medical School, Boston, MA, USA. 4Hinda and Arthur Marcus Institute
                                 for Aging Research, and Deanna and Sidney Wolk Center for Memory Health, Hebrew SeniorLife, Boston, MA,
                                 USA. 5Guttmann Brain Health Institute, Institut Guttmann, Institut Universitari de Neurorehabilitació adscrit a la
                                 UAB, Badalona, Barcelona, Spain. *email: jross4@bidmc.harvard.edu

Scientific Reports |   (2022) 12:1391                | https://doi.org/10.1038/s41598-022-05397-3                                                1

                                                                                                                                            Vol.:(0123456789)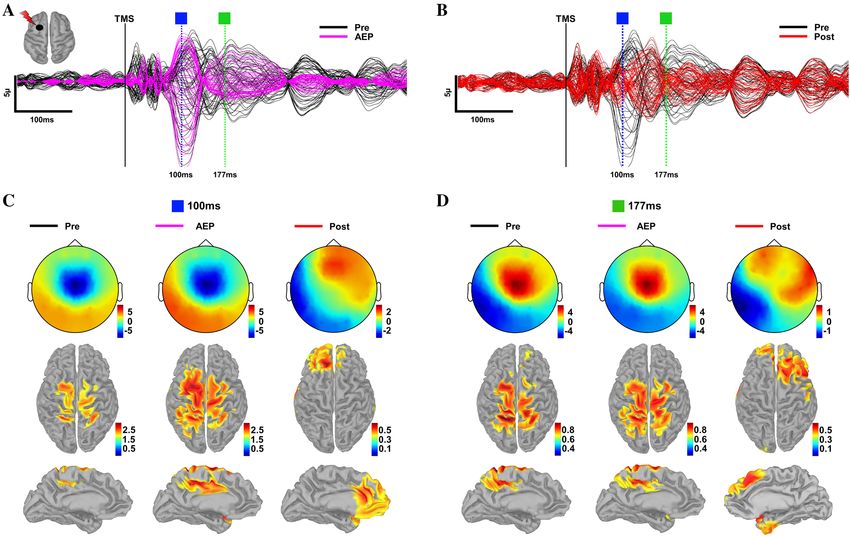
www.nature.com/scientificreports/
PI Principal investigator
UCONN University of Connecticut Health Center
Transcranial magnetic stimulation (TMS) has gained increasing importance and application in the neurophysi-
ologic characterization of healthy aging1,2 and a variety of neurological disorders, including Alzheimer’s disease1,2,
epilepsy3, autism spectrum disorders2, and schizophrenia ( see4 for a review). TMS excites neuronal p opulations5
in cortical n etworks6,7. TMS-evoked8 and induced changes in endogenous oscillatory a ctivity9 can be observed
using electroencephalography (EEG)10,11. An averaged TMS-evoked EEG potential (TEP) is used to describe
local and network effects of focal single pulse TMS8,10,12,13. However, the TEP waveform contains all activity
within several hundred milliseconds of the pulse. This activity can include centrally evoked activity from induced
intracranial currents, modulated oscillatory d ynamics9,14,15, peripherally evoked activity from direct sensory
afferents due to the multi-sensory nature of each TMS pulse16–20, and non-neural artifacts. Existing preprocess-
ing pipelines are fairly good at isolating and removing non-neural artifacts but are inconsistent at separating
centrally and peripherally evoked activity.
The TEP reflects TMS-evoked brain a ctivation21,22 that can be specific to stimulation s ite9,13,23, and
reproducible13,23,24, particularly at earlier latencies. However, the specificity of longer latency responses is a
matter of debate16,25,26 due to high correlation between TEPs and sensory responses to TMS by 60–80 ms17,18,23
and high correlation between active and sham stimulation starting as early as 58 ms16,18. Biabani et al.17 raised
concerns about the specificity of TEPs to TMS-evoked activity, advising a need to further suppress sensory
evoked activity or to remove it.
One large sensory component appears to be due, at least in part, to auditory processing of the “click” caused
by mechanical deflection of the copper coil when electrical current passes through it27. This auditory evoked
potential (AEP) dominates the TEP w aveform16 and is a stereotyped response to an auditory stimulus, with peaks
at 50 ms from primary auditory cortical response and at 100 and 200 ms from responses in surrounding belt areas
of A128–30. Because AEP source is bilateral auditory cortex, the distribution of the response in scalp electrodes is
central30–32. AEP might explain TEP non-specificity across site and stimulation c onditions16.
Earplugs and noise m asking6,18,33 can attenuate AEP in single pulse TMS-EEG, and foam padding between
coil and scalp can reduce bone conduction of the s ound34. Rocchi et al. showed that noise masking can reduce
AEP effectively for subthreshold s timulation18. Use of these experimental modifications, along with adjustment
of coil placement and stimulation parameters during data acquisition, can minimize sensory potentials and
maximize the impact of TMS on c ortex26. However, many groups have observed AEP even after using these
techniques16,17,34–36. When masking needs to be presented at louder volumes, such as for suprathreshold stimula-
tion, tolerability for the loud masking sound becomes a greater c oncern16; and if the noise-masking is painful,
for pain induced evoked potentials and oscillatory changes with p ain37–39. In some cases, participants can still
hear the distinct sound of the TMS click through noise, regardless of volume. It has been suggested this could be
due to contrasting acoustic properties of the TMS click and sustained noise40. Perhaps critical to the discussion,
a sensory potential with identical time course and topography has been described with s omatosensory19 and
multimodal41–43 perception, so there may be contributions to the AEP that cannot be masked with an auditory
sound. In addition, it is unknown what effects noise masking sounds have on the TEP. Auditory noise is known
to have measurable impacts on sensory processing of other s ounds44, sensorimotor cortical e xcitability45–47,
cognitive task p erformance48, and on evoked potentials49–51, but noise effects on TEP are unexamined.
Because the sensory potential described as AEP is shared between active and sham TMS, sham could be useful
for identifying this AEP in TEP. Rogasch et al.52 showed that Independent Components Analysis (ICA)53,54 can
detect AEPs in TEPs from both active and sham TMS and suggested that concatenating active and sham record-
ings before ICA would reveal a common AEP potential in both conditions. Biabani et al.17 reported a correlation
between TEPs from active TMS and TMS to the shoulder starting at latencies of 60 ms and used ICA on merged
active and sham conditions to detect sensory potentials in a comparison with other methods. However, to our
knowledge, this approach has not been rigorously examined or quantified in non-M1 targets and has not been
evaluated using different populations and varying sham protocols.
In the current study, we merge sham and two active stimulation conditions before ICA to identify a common
AEP component. Because of additional sensory components that occur with M1 stimulation, we used non-M1
stimulation sites for the active stimulation conditions. We quantify the changes that occur when removing AEP
using this method and characterize the components that account for TEP non-specificity. This manuscript pre-
sents these four specific contributions: (1) We assess the generalizability of this approach by applying it to two
populations: younger and older adults, collected with differing sham procedures and TMS-EEG systems. (2) We
assess and quantify the impact of removing AEP with this method. (3) We quantify the specificity of the TEPs
across different non-motor stimulation sites and between individuals before and after this procedure. Finally,
(4) we describe the residual activity. Our hypothesis was that effectively removing AEP would reveal stimulation
site-specific and participant-specific responses in early, mid latency and late time windows.
Materials and methods
Participants. Data used in the present analysis were from two ongoing TMS-EEG studies at the Berenson-
Allen Center for Noninvasive Brain Stimulation at Beth Israel Deaconess Medical Center. All participants pro-
vided written informed consent before enrollment according to the Declaration of Helsinki. Both studies were
approved by the Institutional Review Board of the Beth Israel Deaconess Medical Center, Boston, MA. The first
cohort consists of 10 healthy adult control participants (9 M/1F, age = 42.2 ± 18.8 yrs., range = 19 to 65) from a
TMS-EEG study of epilepsy3. The second cohort consisted of 24 older adults, collected as part of a study of post-
operative delirium called The Successful Aging after Elective Surgery study (SAGES; 10 M/14F, age = 72.0 ± 6.6
Scientific Reports | (2022) 12:1391 | https://doi.org/10.1038/s41598-022-05397-3 2
Vol:.(1234567890)
www.nature.com/scientificreports/
yrs., range = 65 to 89)55. Participants selected for SAGES did not have clinical dementia, were scheduled for
major surgery, and we used pre-surgery baseline TMS-EEG visit data for this analysis. We replicated and vali-
dated the findings from the first cohort (healthy younger adult) with the second cohort (older adult). The two
cohorts represent different age groups, sham TMS protocols, and TMS-EEG systems, and are therefore ideal for
addressing the robustness and strengths/weaknesses of this structured ICA-based approached to isolating AEP
from TEP independent of experimental design.
Transcranial magnetic brain stimulation set‑up and procedure. In the younger cohort, TMS was
delivered using a Nexstim eXimia stimulator with real-time MRI neuronavigation (NBS software v3.2.1; Nex-
stim, Helsinki, Finland), following standard p rotocols56. Single TMS pulses were applied to left dorsolateral
prefrontal cortex (L DLPFC), left intra-parietal lobule (L IPL) and a sham condition to left M1 delivered with
an active coil tilted away from the scalp at 90°. DLPFC and IPL were anatomically defined, respectively, as the
superior half of the middle frontal gyrus approximately 3 cm anterior to precentral sulcus and the superior
edge of angular gyrus roughly 1 cm inferior to intraparietal sulcus. Coil orientation was set with coil handle
perpendicular to the targeted gyri inducing a biphasic anterior–posterior—posterior-to-anterior current in the
underlying cortex. No auditory noise masking or electrical stimulation was used. Participants were asked to
wear earplugs during sham and active-TMS trials to protect their hearing. Throughout the visit, participants
were seated in an adjustable chair. The motor hotspot for eliciting motor evoked potentials (MEPs) in the right
first dorsal interosseous (FDI) muscle was determined by delivering single pulse TMS to the hand knob of
left motor cortex with the coil tangential to the scalp and oriented orthogonal to the motor strip (~ 45° from
anterior–posterior midline) and searching around until finding the site where the largest and most consistent
MEPs were produced in FDI. Resting motor threshold (RMT) was then determined as the minimum stimula-
tion intensity (% of maximum stimulator output) needed to elicit MEPs ≥ 50 µV in the relaxed FDI in at least 5
out of 10 pulses. Following determination of RMT, 120 single pulses of TMS were applied at 120% RMT with
randomly jittered inter-stimulus intervals (3–5 s). TMS operators monitored participants for wakefulness. See
Vink et al.57 for more details.
In the older cohort, TMS was delivered using a figure-of-eight shaped coil with dynamic fluid cooling, a
biphasic waveform, and anterior–posterior–posterior-anterior current direction in the brain (MagVenture Cool-
B65) attached to a Magpro X100 stimulator, following standard p rotocols56. MagVenture Cool-B65 A/P coil was
used with a 2.7 cm thick plastic spacer for sham stimulation and white noise masking was presented through
earplug-earbuds at the maximum volume comfortable for each participant. Participants were asked to rate the
perceived loudness of the TMS “click” while listening to the noise, relative to no noise-masking (0–10 scale, with
0 = “could not hear” and 10 = “as loud with noise and without noise”), and the average loudness rating was 6 ± 4.
Four subjects reported “click” loudness ratings equal to 0. Although auditory noise masking was used in the
older cohort, 20 participants reported hearing the TMS “click” and had AEPs. These 20 participants were used
for all pre/post AEP removal comparisons (7M/13F, age = 71.9 ± 5.8 years, range = 65 to 86). Small current pulses
(between 2 and 4 mA) were delivered over the left forehead, over the frontalis muscle, using surface electrodes
(Ambu Neuroline 715) to approximate somatosensory sensations arising from skin mechanoreceptors and scalp
muscles during the active-TMS condition. The motor hotspot for eliciting motor evoked potentials (MEPs) in
the right FDI muscle was determined by delivering single pulse TMS to the hand knob of left motor cortex with
the coil tangential to the scalp and oriented orthogonal to the central sulcus/motor strip (~ 45° from mid-sagittal
plane) and varying the location and orientation until the largest and most consistent MEPs were produced in
FDI. RMT was determined as the minimum stimulation intensity needed to elicit MEPs ≥ 50 µV in the relaxed
FDI in at least 5 out of 10 trials. Following determination of the FDI hotspot and RMT, 120 single pulses of
TMS were applied at 120% RMT with randomly jittered inter-stimulus intervals (3–5 s) to the DLPFC and IPL
targets, and sham TMS over M1. To select the non-motor targets in the SAGES cohort, group-level resting-
state functional networks maps were used based on a 7 networks parcellation covering cortical and subcortical
structures58. Confidence maps for each RSN were used, representing the confidence of each vertex belonging to
its assigned network across a sample of 1000 healthy participants (expressed as valued between − 1 and 1), with
larger values indicating higher confidence. By using group-level functional parcellations and confidence maps on
the Montreal Neurological Institute (MNI) template brain, we were able to target the most consistent and reliable
regions within the left angular gyrus (L-IPL: − 55.1, − 70.5, 27.7) and dorsolateral prefrontal cortex (L-DLPFC:
− 50.5, 30.4, 31.8) that had the highest likelihood of occurring in the default mode and frontoparietal resting-
state networks, respectively. A custom processing pipeline was developed to take each participant’s anatomical
MRI, create a non-linear transform from the participant’s native space to MNI space and then use the inverse of
that transform to bring back the coordinates into participant’s space using FSL’s FNIRT tool. The transformed
coordinates along with individual high-resolution T1w images were then imported into the Brainsight TMS
Frameless Navigation system (Rogue Research Inc., Montreal, Canada), and co-registered to digitized anatomical
landmarks for online monitoring of coil positioning. TMS operators monitored participants for wakefulness.
Electroencephalography acquisition and preprocessing. In the younger cohort, whole scalp
60-channel EEG was collected with a TMS-compatible amplifier (eXimia EEG, Nexstim Ltd) and labeled accord-
ing to the extended 10–20 international system. EEG data were online referenced to an additional electrode on
the forehead. Impedances were maintained below 5 kΩ at a sampling rate of 1450 Hz. EEG signals were digitized
using a Nexstim amplifier. Digitized EEG electrode locations on the scalp were also co-registered to individual
MRI scans using Nexstim Brainsight TMS Frameless Navigation system (Rogue Research Inc., Montreal, Can-
ada). See Vink et al.57 for more details.
Scientific Reports | (2022) 12:1391 | https://doi.org/10.1038/s41598-022-05397-3 3
Vol.:(0123456789)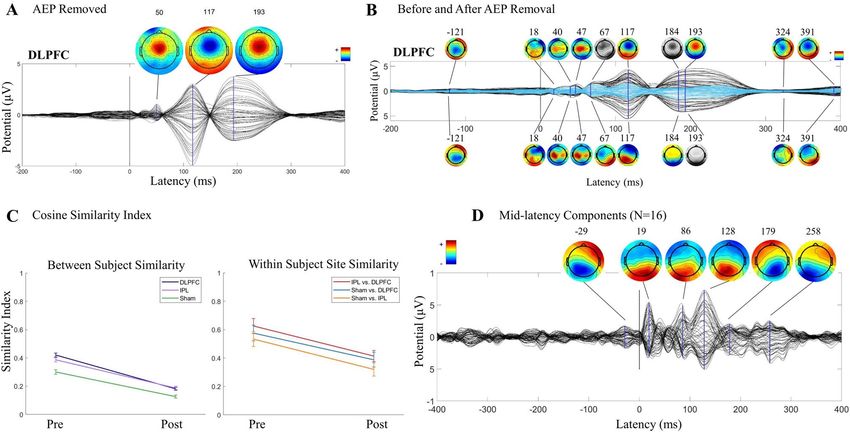
www.nature.com/scientificreports/
In the older cohort, whole scalp 64-channel EEG was collected with a TMS-compatible amplifier (actiCHamp,
Brain Products GmbH, Munich, Germany) and labeled according to the extended 10–20 international system.
EEG data were online referenced to AFz. Impedances were maintained below 5kΩ at a sampling rate of 5000 Hz.
EEG signals were digitized using a BrainVision amplifier (BrainCHamp, BrainVision Recorder software, v. 1.21).
Digitized EEG electrode locations on the scalp were co-registered to individual MRI scans using Nexstim Brain-
sight TMS Frameless Navigation system (Rogue Research Inc., Montreal, Canada).
EEG data were pre-processed offline using custom scripts and EEGLab v2019.059 in MATLAB R2019a (Math-
works, Natick, MA, USA). Data were segmented into 3000 ms epochs, each starting 1000 ms before (pre-stimulus)
and ending 2000 ms (post-stimulus) following TMS pulse, respectively. Baseline correction was performed by
subtracting the mean pre-stimulus (− 900 to − 100) signal amplitude from the rest of the epoch in each channel.
Following baseline correction, data were visually inspected to identify and remove extremely noisy channels with
high amplitudes. The median number of channels removed in the younger cohort was 2 channels (range: 0–6),
and in the SAGES cohort was 1 channel (range: 0–4). Zero-padding between − 2 and 14 ms time range were then
applied to remove the early TMS pulse artifact from the EEG data. Both cohorts were affected by muscle artifacts
from the TMS, so we applied a standard zero-padding approach to equate analysis between the two datasets,
and subsequently employed conventional ICA methods to identify and remove muscle artifacts. All zero padded
epochs were then tagged based on voltage (≥ 100 μV), kurtosis (≥ 3), and joint probability (single channel-based
threshold ≥ 3.5sd; all channel-based threshold ≥ 5sd) metrics to identify excessively noisy epochs. Visual inspec-
tion was performed on the tagged epochs for the final decision on removal of noisy epochs.
An initial round of fast independent component analysis (fICA)60 was performed to identify and remove
exclusively components with early TMS evoked high amplitude electrode and EMG a rtifacts52,61. After the first
round of fICA, the EEG data were interpolated for previously zero-padded time window around TMS pulse
(− 2 ms to 14 ms) using linear interpolation, band pass filtered using a forward–backward 4th order Butterworth
filter from 1 to 100 Hz, notch filtered between 57 and 63 Hz, and referenced to global average. Missing/removed
channels were interpolated using spherical interpolation, and DLPFC, IPL and sham stimulation blocks were
merged, in that order. Because recordings were made with 60/64 channels, and the signals were unlikely to
have that many independent sources, PCA was used to reduce dimensionality prior to ICA. This approach can
improve decomposition62,63 and signal to noise ratio of large sources64. Data were reduced into no fewer than 30
dimensions in the younger cohort (median = 32.5, range = 30–50), and no fewer than 35 dimensions in the older
cohort (median = 45, range = 35–60), optimized at the individual level to maximize uniqueness and dipolarity of
resulting components while minimizing residual noise components64. A second round of fICA was run on the
merged data to manually remove all remaining artifact components61 including eye movement/blink, muscle
noise (EMG), single electrode noise, TMS evoked muscle, and cardiac beats (EKG). The median number of
components removed in the younger cohort was 21.5 (range: 18–41), and in the older cohort was 38.5 (range:
28–55). The data were low pass filtered with a 4th order Butterworth filter at 50 Hz.
Components that met the following criteria were classified as AEP components and removed: (1) the time-
course has three peaks, P50-N100-P200, with the lowest amplitude in the P50 compared with N100 and P200;
(2) the scalp topography reflects left/right symmetry and a central distribution anterior to Cz; and (3) the com-
ponent is shared across both active stimulation sites and sham stimulation. The median number of remaining
components after all cleaning steps in the younger cohort was 8.5 (range: 6–11), and in the older cohort was 7
(range 4–16). See “Discussion” for more details about AEP classification criteria. Conditions were then unmerged
for subsequent analyses.
In both rounds of fICA, a semi-automated artifact detection algorithm incorporated into the open source
TMS-EEG Signal Analyzer (TESA v1.1.0-beta) extension for EEGLAB was used to classify and visually inspect
components based on their frequency, activity power spectrum, amplitude, scalp topography, and time c ourse65
(http://nigelrogasch.github.io/TESA/).
Analysis of TMS‑evoked potentials. All analyses were performed at the single subject level, and group
level statistical analyses were performed. Selections of both individual and group data are shown in several fig-
ures and supplementary figures. The specific analyses are described here, of time course and topography of TEPs,
GMFP and LMFP, TEP similarity, source reconstruction, and follow-up exploratory analyses of remaining TEP.
Time‑course and topography. Latency and amplitude of peaks in the pre- and post-AEP removal TMS-evoked
cortical response were identified using an automated peakfinder algorithm66 and scalp topographies were plotted
at those peak latencies.
GMFP/LMFP (and windows). Global mean field power (GMFP) across all channels was used to quantify global
synchrony and excitability67,68 in the 14–400 ms post-TMS window. We computed Global Mean Field Power
(GMFP) following:
k
2
i (Vi(t) − Vmean(t) )
GMFP(t) =
K
where Vi(t) is the voltage at electrode i at a certain point in time, V
mean(t) is the mean of instantaneous TEP across
electrodes, and K is the number of electrodes.
Local mean field potentials (LMFP) from electrodes near the active stimulation sites were used to quantify
local activity under the coil67,69,70 in the 14–400 ms post-TMS window. Channels included in each region of
Scientific Reports | (2022) 12:1391 | https://doi.org/10.1038/s41598-022-05397-3 4
Vol:.(1234567890)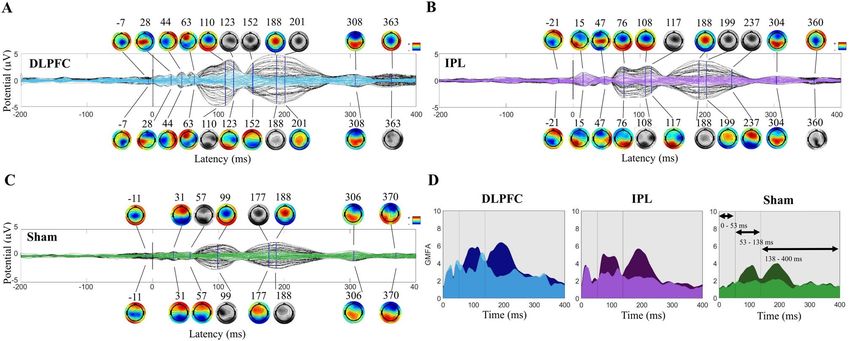
www.nature.com/scientificreports/
interest were determined as all electrodes bordering stimulation target locations. For the younger cohort, the
DLPFC ROI included AF1, F7, F5, F1, FT7, FC5, and FC3 and the IPL ROI included TP7, CP5, CP3, P7, P3,
and PO3. In the older cohort, the DLPFC ROI included AF3, F7, F5, F3, FT7, FC5, and FC3, and the IPL ROI
included TP7, CP5, CP3, P7, P5, P3, PO7, and PO3. See Supplementary Fig. S1 for electrode arrays color coded
to show LMFP ROIs for younger adult (S1A) and older SAGES (S1B) cohorts. In addition, GMFP and LMFP
were calculated for three windows corresponding to the three subcomponents of AEP. Windows were defined in
each study cohort for GMFP, LMFP of the DLPFC ROI, and LMFP of the IPL ROI, using the latency of the mini-
mum amplitude between peaks in the sham stimulation condition (determined using the peakfinder() function,
which finds peaks with amplitudes that are greater than two standard deviations above b aseline66). See Fig. 2D
for time-windows defined for GMFP analysis in the younger cohort, and Supplementary Fig. S2 for all defined
windows in both cohorts. Area under the curve for GMFP, LMFP at the DLPFC ROI, LMFP at the IPL ROI, and
in all time-windows were entered as dependent variables into a 2 (Version: pre-AEP removal, post-AEP removal)
by 3 (Site: DLPFC, IPL, shamM1) repeated-measures analyses of variance (ANOVA).
Similarity index. Similarity between TEPs across site and between subjects at each site, pre and post AEP
removal, was quantified in vector space using the cosine similarity index (SI) which ranges from 0 to 1 (low to
high similarity, with 0.5 indicating mid-range)13,23. We first generated a TEP matrix for each subject (from aver-
aged responses) with a fixed window size (385 ms) covering EEG responses from 14 to 400 ms. Each TEP matrix
contains millisecond voltage values from all channels with a 63 × 385 matrix size. We then used cosine similarity
to quantify similarity index (SI) between matrices following:
n
(X it ∗ Yit )
SI XY =
i,t=1
( i,t=1 Xit ) ∗ ( ni,t=1 Yit2 )
n 2
where SI XY is the cosine similarity between TEP matrices x and y for a given stimulation site, and n is the number
of channels, Xit and Yit are the ith vector of all channels at time t. Within-subject site SI was computed as the
mean SI from the diagonal of site comparison grids. Between-subject SI was computed as the mean SI of half
grid, excluding the diagonal, of within-site grids (DLPFC by DLPFC, etc.). To enable assessment of similarity
between the DLPFC and IPL datasets, SI was also calculated for three time-windows defined by residual TEP
in active stimulation conditions post-AEP removal: early, mid, and late latency. These windows were defined
using GMFP area under the curve post-AEP removal active stimulation conditions averaged across participants.
We performed multiple univariate tests to describe how the AEP-removal method affects each outcome
variable separately. Multiple univariate tests are preferred over one multivariate MANOVA here for a number
of reasons71. First, our research question dictates a model that tests for effects of the method on each outcome
variable independently, with no particular interest in a linear composite of the outcome variables. Our approach
best describes how using this AEP-removal method will practically influence a variety of datasets if applied.
We acknowledge that redundant information is being obtained using multiple ANOVAs but suggest that this
redundancy supports that removing AEP using this method has robust effects on mean field potentials across
ROIs and, particularly at mid and later latencies. However, to address concerns about experiment-wise Type 1
error for performing multiple ANOVAs, we additionally use an additive Bonferroni inequality. For m = 12 tests,
α of 0.05 becomes 0.004 (0.05/12).
EEG source reconstruction. All TMS evoked EEG source reconstruction was performed using Brainstorm72.
First, digitized EEG channel locations and anatomical landmarks of each subject were extracted from Brain-
sight (nasion ‘NAS’, left pre-auricular ‘LPA’, and right pre-auricular ‘RPA’ points; Rogue Research Inc., Montreal,
Canada), and registered onto individual MRI scans in brainstorm. Next, the EEG epochs, − 500 ms to 1000 ms
with respect to TMS pulse for each TMS trial were uploaded, and the average epoch time series was generated for
each subject. Forward modeling of neuro electric fields was performed using the open MEEG symmetric bound-
ary element method, all with default parameter settings. Noise covariance was estimated from individual trials
using the pre-TMS (− 500 to − 1 ms) time window as baseline. The inverse modeling of the cortical sources was
performed using the minimum norm estimation (MNE) method with dynamic statistical parametric mapping
(dSPM) and constraining source dipoles to the cortical surface. The resulting output of EEG source reconstruc-
tion was the MNE current density time series for each cortical vertex.
Residual mid‑latency components. As a follow-up we examined the residual TEP in a mid-latency window.
We used two approaches in an attempt to isolate the mid-latency components in sham—(1) a percent vari-
ance threshold to identify components contributing the most variance in this mid-latency window, and (2)
non-parametric permutation based suprathreshold cluster size a nalysis73. We looked for clusters in the post
pulse GMFP that were greater than the baseline period, and we determined which components contributed the
highest percent variance to each of these clusters. See “Results”—“Residual mid latency components” for more
details. Due to redundancy in the results of these two approaches, only the percent variance threshold approach
(1) is described here. See Supplementary material for the results of the non-parametric permutation-based clus-
ter size analysis (2).
All plots were generated using custom scripts and MATLAB R2019a (Mathworks, Natick, MA, USA), and
figures were designed using Inkscape (version 1.1, http://www.inkscape.org/).
Scientific Reports | (2022) 12:1391 | https://doi.org/10.1038/s41598-022-05397-3 5
Vol.:(0123456789)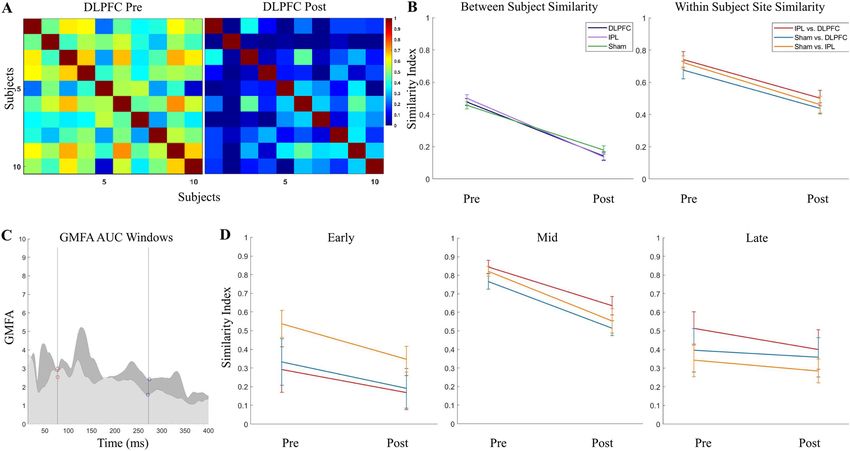
www.nature.com/scientificreports/

                                            Figure 1.  Auditory evoked potential (AEP) in the younger adult cohort. (A) Time-course and topography
                                            of AEP component removed from merged dataset in a representative participant. (B) ERP Image of AEP
                                            component in merged dataset across all trials in the same representative participant. Conditions were merged
                                            in this order: DLPFC, IPL, sham. (C) Components removed, averaged across all participants (N = 10; after being
                                            unmerged into conditions), and components removed from sham without merging with other conditions,
                                            averaged across all participants (N = 10).

                                            Results
                                            Results of all analyses are shown for the younger cohort in Figs. 1, 2, 3,4, 5, and summarized results are shown
                                            for the older cohort in Fig. 6. See Supplementary for additional Tables and Figures for both cohorts.

                                            The AEP.       All 10 participants in the younger cohort had an AEP that met all three criteria (time-course,
                                            topography, and shared across conditions including sham). See Fig. 1A for a representative participant’s TEP and
                                            scalp topography of the component classified as AEP in this participant’s data. The ERP image of this component
                                            from the merged conditions shows a shared time-course and polarity of AEP across active and sham stimulation
                                            conditions (Fig. 1B for same representative participant). Averaged TEP and topography plots across all AEP
                                            components from the full cohort show the expected stereotypical time-course and topography (Fig. 1C). At the
                                            group level, AEP components (14–400 ms) showed low within-subject site-specificity with an averaged between-
                                            site SI of 0.83 ± 0.04. The AEP components showed moderate subject specificity, with an averaged within-site
                                            between-subject SI of 0.49 ± 0.03. For all between- and within-site SIs, see Supplementary Table S1.
                                                In the older cohort, 20 of 24 participants had an AEP that met all three criteria. AEP components (14–400 ms)
                                            again had high similarity across sites, with an averaged within-subject between-site SI of 0.66 ± 0.06. Between-
                                            subject similarity was again moderate, with an averaged within-site between-subject SI of 0.36 ± 0.02. For all
                                            between- and within-site SIs, see Supplementary Table S1. See Fig. 6A for the averaged AEP component time-
                                            course and topography from active stimulation of the DLPFC target in the older cohort.

                                            Effects on the TEP.      Time‑course and topography. Pre/post AEP removal comparisons at the group lev-
                                            el revealed an amplitude reduction that was most noticeable at approximately 100 and 200 ms latencies. See
                                            Fig. 2A–C for TEPs and scalp topographies before and after AEP removal in the first cohort (N = 10). TEP from
                                            stimulation of DLPFC (Fig. 2A) had peaks at 28, 44, 63, 110, 188, 308, and 363 ms pre-AEP removal, and AEP
                                            removal revealed smaller peaks at 123 and 152 ms. See Fig. 2B IPL stimulation at 15, 47, 76, 108, 188, 304, and

          Scientific Reports |   (2022) 12:1391 |               https://doi.org/10.1038/s41598-022-05397-3                                                 6

Vol:.(1234567890)
www.nature.com/scientificreports/
Figure 2. Group level impact of removing AEP in the younger cohort (N = 10). Topoplots are greyscale if no
peak is present at the indicated latency. (A) DLPFC condition TEPs pre (black) and post (blue) removal of AEP
components. Scalp topography pre (above) and post (below) at indicated latencies. (B) IPL condition TEPs/
topographies pre (black/above) and post (purple/below) removal of AEP components. (C) Sham stimulation
condition TEPs/topographies pre (black/above) and post (green/below) removal of AEP components. (D)
Global mean field potential (GMFP) area under the curve plots pre (darker) and post (lighter) AEP removal in
three time-windows, defined by sham GMFP peak activity pre-AEP removal.
Figure 3. Specificity of TEPs (cosine similarity) before and after removing AEPs in the younger cohort.
(A) Between-subject similarity index grids pre- and post-removal of AEP components. (B) Between-subject
similarity index average (calculated from half of the grid, excluding the diagonal) pre- and post-removal (left),
and within-subject stimulation site similarity (calculated as the average of the diagonal of IPL/DLPFC, sham/
DLPFC, and sham/IPL grids; right). (C) Time windows used for within-subject site similarity in three windows
(early: 14–77.24 ms, mid: 77.24–271.72 ms, late: 271.72–400 ms), defined using the post-removal GMFP from
DLPFC (darker) and IPL (lighter). (D) Within-subject stimulation site similarity pre and post removal in early,
mid and late latency windows.
Scientific Reports | (2022) 12:1391 | https://doi.org/10.1038/s41598-022-05397-3 7
Vol.:(0123456789)www.nature.com/scientificreports/
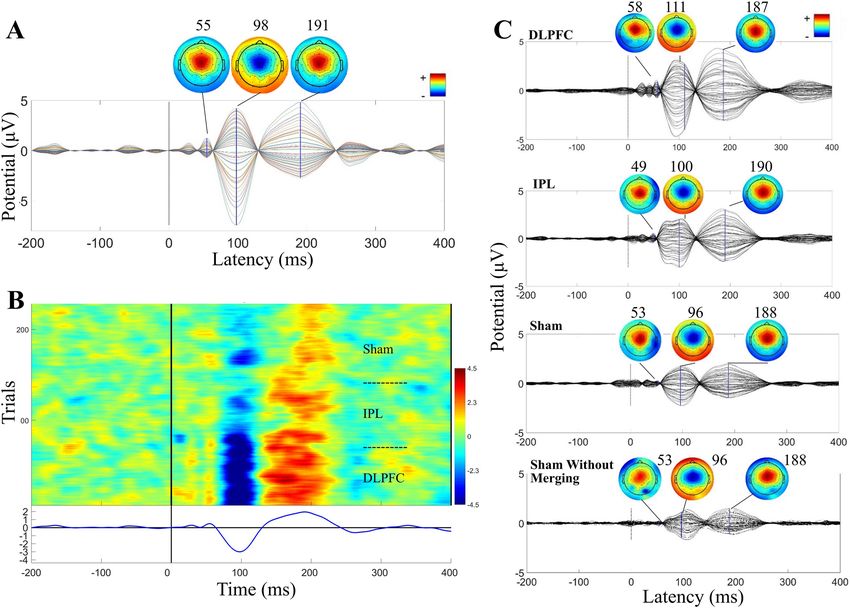
Figure 4. Source reconstruction of TEPs pre- and post-AEP removal. (A) TEPs from DLPFC pre- (black) AEP
removal and AEP component (magenta) time series for a representative subject with selected peaks. (B) TEPs
in (A) pre- (black) and post-(red) AEP removal for this same subject with selected peaks. (C) Topography and
corresponding source reconstructions at 100 ms for pre- (left), AEP (middle) and post- (right) AEP removal.
(D) Topography and corresponding source reconstructions at 177 ms for pre- (left), AEP (middle) and post-
(right) AEP removal.
360 ms pre-AEP removal and the revealed peak at 117 ms post-AEP removal, and Fig. 2C sham stimulation at
31, 99, 188, 306, and 370 ms pre-AEP removal and the revealed peaks at 57 and 177 ms post-AEP removal. Scalp
topographies in this mid-latency window shifted to posterior distributions with removal of AEP. Earlier peaks
appeared to be stimulation site specific and have unique topographies, less effected by removal of AEP than later
peaks.
In the older cohort, with removal of AEP there was a similar amplitude reduction in mid-latency peaks of
the TEPs and revealing of smaller peaks in that window with a posterior shift in topographies. See Fig. 6B for
pre- and post-AEP removal TEPs and scalp topographies in the SAGES cohort with DLPFC stimulation (note
pre/post changes at 117 and 193 ms). See Supplementary Fig. S3 for sham condition.
Global mean field potentials. In the younger cohort, in the full 14–400 ms time window, across all electrodes,
we found that removing AEP reduced GMFP area under the curve, (F(1,9) = 21.78, p = 0.001), with no significant
version (pre/post) by site interaction (F(2,18) = 2.28, p = 0.13).
Using the peak/trough analysis of GMFP in the sham stimulation condition pre-AEP removal, we found
three peaks that were greater than two standard deviations above baseline with latencies at 45 ms, 110 ms, and
192 ms (windows for analysis: 14 to 53 ms, 53 to 138 ms, and 138 to 400 ms; Supplementary Fig. S2A). In the P50
window, there was no change in GMFP AUC with removal of AEP (F(1,9) < 0.0001, p = 0.99), and no significant
version (pre/post) by stimulation site interaction (F(2,18) = 1.41, p = 0.27). In the N100 window, there was a
significant reduction in GMFP AUC (F(1,9) = 9.14, p = 0.014, but no version by site interaction (F(2,18) = 0.16,
p = 0.86). In the P200 window, there was a significant reduction in GMFP AUC (F(1,9) = 20.49, p = 0.001), and
also a significant version by site interaction (F(2,18) = 5.65, p = 0.012). See Fig. 2D for GMFP AUC pre- and
post-AEP removal. See Supplementary Table S2 for all test statistics.
In the older cohort, in the full 14–400 ms time window, we found that removing AEP reduces GMFP AUC
(F(1,19) = 29.27, p < 0.0001), with a Version-by-Site interaction (F(2,38) = 6.04, p = 0.005). Three peaks were
detected at 43, 122, and 205 ms (windows: 14 to 59 ms, 59 to 163 ms, and 163 to 400 ms; Supplementary Fig. S2D).
In the P50 window, there was no change in GMFP AUC (F(1,19) = 1.18, p = 0.29), and no interaction with site
(F(2,38) = 0.41, p = 0.66). In the N100 window, there was a significant reduction in GMFP AUC (F(1,19) = 21.08,
p < 0.0001), with an interaction between version and site (F(2,38) = 6.63, p = 0.003). In the P200 window, there
Scientific Reports | (2022) 12:1391 | https://doi.org/10.1038/s41598-022-05397-3 8
Vol:.(1234567890)www.nature.com/scientificreports/
Figure 5. Mid-latency components. Properties of mid latency component in a one representative participant
in sham stimulation condition (A–E). (A) Percent variance contributing to mid latency window in sham
stimulation in all components, showing peak contribution in component 2. For all participants, a threshold
PVAF of 28% was used to select largest mid-latency contributors in sham stimulation condition. (B) Topography
of component 2, showing posterior midline projection. (C) ERP Image of component 2, showing time course
across all trails and presence of activity in baseline period. (D) Spectral profile of component 2, with peak
frequency in alpha band. (E) GMFP pre (darker) and post (lighter) removal of component 2, showing similar
reduction in baseline and post-TMS windows. (F) TEP/topography of all mid latency components contributing
more than 28% variance in mid latency window in sham stimulation condition (N = 7) from full group analysis.
was also a reduction in GMFP AUC (F(1,19) = 31.26, p < 0.0001), and an interaction with site (F(2,38) = 4.58,
p = 0.017).
Local mean field potentials. In the younger cohort, local mean field potentials (LMFP) over DLPFC and IPL
targets reveal a similar pattern of results as in GMFP. We found a reduction in LMFP AUC with removal of AEP
(DLPFC ROI: F(1,9) = 13.41, p = 0.005; IPL ROI: F(1,9) = 27.70, p = 0.001), with no interaction between Version
and Site (DLPFC ROI: F(2,18) = 1.73, p = 0.21; IPL ROI: F(2,18) = 2.46, p = 0.11).
Using the peak/trough analysis, we found windows defined for the DLPFC ROI as 14 to 54 ms, 54 to
146 ms, and 146 to 400 ms, and for the IPL ROI as 14 to 52 ms, 52 to 144 ms, and 144 to 400 ms (Supple-
mentary Fig. S2B,C). Removing AEP did not reduce LMFP area under the curve in the P50 window in either
ROI (DLPFC ROI: F(1,9) = 0.47, p = 0.51; IPL ROI: F(1,9) = 0.09, p = 0.77), with no Version-by-Site interac-
tions (DLPFC ROI: F(2,18) = 2.57, p = 0.10; IPL ROI: F(2,18) = 0.31, p = 0.74). Removing AEP reduced LMFP
AUC in the N100 window in the DLPFC ROI (F(1,9) = 6.61, p = 0.03) but did not reach significance in the
IPL ROI (F(1,9) = 4.58, p = 0.061), and there were no Version-by-Site interactions (DLPFC ROI: F(2,18) = 0.74,
p = 0.49; IPL ROI: F(2,18) = 0.041, p = 0.96). In the P200 window, there was a reduction in LMFP AUC (DLPFC
ROI: F(1,9) = 17.93, p = 0.002; IPL ROI: F(1,9) = 26.69, p = 0.001), a Version-by-Site interaction in the IPL ROI
(F(2,18) = 5.92, p = 0.011) but not in the DLPFC ROI (F(2,18) = 2.73, p = 0.092).
In the older cohort, we also saw a reduction in LMFP AUC with removal of AEP (DLPFC ROI: F(1,19) = 18.34,
p < 0.0001; IPL ROI: F(1,19) = 16.89, p = 0.001), and in this cohort we found a Version-by-Site interaction (DLPFC
ROI: F(2,38) = 5.98, p = 0.006; IPL ROI: F(2,38) = 4.55, p = 0.017). Three windows were defined for the DLPFC
ROI as 14 to 69, 69 to 165, and 165 to 400 ms, and for the IPL ROI as 14 to 60, 60 to 165, and 165 to 400 ms
(Supplementary Fig. S2E,F). Removal of AEP did not reduce LMFP AUC in the P50 window (DLPFC ROI:
F(1,19) = 0.014, p = 0.91; IPL ROI: F(1,19) = 1.08, p = 0.31), with no Version-by-Site interactions (DLPFC ROI:
F(2,38) = 0.42, p = 0.66; IPL ROI: F(2,38) = 0.029, p = 0.97). The reduction in LMFP with removal of AEP was
being driven by the N100 (DLPFC ROI: F(1,19) = 19.50, p < 0.0001; IPL ROI: F(1,19) = 16.68, p = 0.001) and P200
windows (DLPFC ROI: F(1,19) = 15.42, p = 0.001; IPL ROI: F(1,19) = 13.49, p = 0.002). There were Version-by-Site
interactions in this cohort in the DLPFC ROI (N100: F(2,38) = 5.37, p = 0.009; P200: F(2,38) = 3.32, p = 0.047) and
the IPL ROI (N100: F(2,38) = 4.41, p = 0.019; P200: not significant F(2,38) = 2.73, p = 0.078).
To address concerns about experiment-wise Type 1 error for performing multiple ANOVAs, we addition-
ally use an additive Bonferroni inequality. As described in “Materials and methods”, for m = 12 tests, α of 0.05
becomes 0.004 (0.05/12). Our general pattern of results remains significant across measures and cohorts, showing
a reduction in GMFP and LMFP AUC for full TEP, and with most robust changes in the N100 and P200 latency
Scientific Reports | (2022) 12:1391 | https://doi.org/10.1038/s41598-022-05397-3 9
Vol.:(0123456789)www.nature.com/scientificreports/
Figure 6. Validation using cohort of older adults (≥ 65 years) from SAGES study. 20 of the 24 participants have
AEP components, regardless of the noise masking protocol, and this N = 20 is shown here. (A) AEP components
removed, averaged across all participants (N = 20; DLPFC after being unmerged from other conditions). (B)
DLPFC condition TEPs/topography pre (black/above) and post (blue/below) removal of AEP components.
Topoplots are greyscale if no peak is present at the indicated latency. (C) Cosine similarity index average
between-subject (left; calculated from half of the grid, excluding the diagonal) and within-subject site (right;
calculated as the average of the diagonal of IPL/DLPFC, sham/DLPFC, and sham/IPL grids) pre and post
removal of AEP components. (D) TEP/topography of all mid latency components contributing more than 28%
variance in mid latency window in sham stimulation condition (N = 16) from full group analysis.
windows. Interactions between version and site do not remain significant for most outcome measures, excepting
GMFP of N100 in the older cohort.
See Supplementary Table S2 for results of all GMFP and LMFP analyses, with test statistics, using α of 0.01,
0.05, and 0.004.
Similarity index. In the younger cohort, in full TEPs (14–400 ms), we found a reduction in between-sub-
ject SI pre- (0.48 ± 0.012) to post- (0.15 ± 0.013) AEP removal (t(2) = 17.82, p < 0.0001), indicating increasing
subject specificity within stimulation site with removal of AEP. We found a reduction in between-site SI pre-
(0.71 ± 0.019) to post- (0.47 ± 0.018) AEP removal (t(2) = 9.17, p < 0.0001), indicating an increase in site specific-
ity with removal of AEP, although it should be noted that 0.47 ± 0.018 was still moderately similar across site.
See Fig. 3A,B for between-subject pre and post AEP removal grids (A) and between-subject and between-site SI
averages pre and post AEP removal (B).
In the active stimulation conditions, GMFP post AEP removal appeared to have three latency windows,
separated by troughs at 77.24 and 273.79 ms in DLPFC and 77.24 and 270.34 ms in IPL, with trough latencies
averaged across active sites at 77.24 and 271.72 ms. These windows were chosen to enable assessment of similarity
in residual TEP (post AEP removal) and were defined using peakfinder()66 as early: 14 to 77.24 ms, mid: 77.24 to
271.72 ms, and late: 271.72 to 400 ms (Fig. 3C). In the early window, between-site SI was 0.39 ± 0.076 pre-AEP
removal, indicating site specificity, and 0.24 ± 0.056 post-AEP removal with no significant change from pre- to
post-AEP removal (t(2) = 1.61, p = 0.092). In the mid-latency window, between-site SI was 0.81 ± 0.023 pre-AEP
removal, indicating high similarity across sites in this window, and reduced to 0.57 ± 0.036 post-AEP removal
(t(2) = 5.68, p = 0.0024). In the late window, between-site SI was 0.42 ± 0.05 pre-AEP removal and 0.35 ± 0.034
post-AEP removal with no significant change from pre- to post-AEP removal (t(2) = 1.15, p = 0.16). See Fig. 3D
for between-site SI averages pre and post AEP removal in the three latency windows.
See Supplementary Table S3 for mean between-subject and within-subject between-site SIs for all stimula-
tion conditions.
Similarly, in the older cohort, in full TEPs (14–400 ms), we found a reduction in between-subject SI pre-
(0.37 ± 0.036) to post- (0.16 ± 0.019) AEP removal (t(2) = 5.03, p = 0.0037), and a reduction in between-site SI
pre- (0.58 ± 0.027) to post- (0.37 ± 0.028) AEP removal (t(2) = 5.29, p = 0.0031). As described above, AEP com-
ponents (14-400 ms) had an averaged between-subject SI of 0.36 ± 0.02 and an averaged between-site SI of
0.66 ± 0.06—the almost identical SIs of AEP components and of pre-AEP removal TEP (but reduced in post-
AEP removal TEP) indicates that the AEP components are dominating the signal-to-noise ratio of the evoked
response prior to removal.
Scientific Reports | (2022) 12:1391 | https://doi.org/10.1038/s41598-022-05397-3 10
Vol:.(1234567890)www.nature.com/scientificreports/
In the active stimulation conditions, GMFP post AEP removal showed three latency windows, separated by
trough latencies averaged across active sites at 86.80 and 285.20 ms. The three latency windows were defined using
peakfinder()66 as early: 14 to 86.80 ms, mid: 86.80 to 285.20 ms, and late: 285.20 to 400 ms. In the early window,
between-site SI was 0.27 ± 0.021 pre-AEP removal and remained low, 0.19 ± 0.038, post-AEP removal (t(2) = 1.98,
p = 0.060). In the mid-latency window, between-site SI reduced from 0.72 ± 0.030 to 0.51 ± 0.040 pre- to post-
AEP removal (t(2) = 4.17, p = 0.0070). In the late window, between-site SI was 0.24 ± 0.017 pre-AEP removal and
0.21 ± 0.020 with no change pre- to post-AEP removal (t(2) = 1.00, p = 0.19). See Fig. 6C for between-subject and
between-site SI averages pre and post AEP removal in the older cohort, and Supplementary Table S3 for mean
between-subject and within-subject between-site SIs for all stimulation conditions.
Source analysis. When AEP is present, topographical distribution of selected peaks in TEPs in both data-
sets have similar spatial characteristics compatible with the signal morphology and topography of AEPs reported
in the recent TMS-EEG and EEG literature52,74–76. While the presence of AEPs resulted in potentials with a
uniform spatial topography and source activations at the expected time points, site-specificity of the evoked
response and distinct source activations became clearly visible after removing AEP. See Fig. 4 for spatial and
temporal characteristics of TEPs pre- and post-AEP removal for a representative subject.
Residual mid latency components. As an exploratory analysis, we examined the residual TEP that
exhibits moderately low site specificity in the mid latency window. Although between-site similarity was reduced
in this mid latency window, it was still higher than the midpoint of SI range (0 to 1), at 0.57 ± 0.036 in the
younger cohort and 0.51 ± 0.040 in the older cohort, indicating some residual similarity across stimulation sites.
One possibility is that the AEP was not being fully removed. However, the altered TEP time course and posterior
shift in scalp topography in this mid latency window (Figs. 2A–C and 6B) suggest that removing AEP revealed
smaller amplitude components that are unique from AEP. We describe the residual TEP but do not make strong
claims as to the specific nature of the activity. However, the residual mid latency TEP may be brain-related and
unique from AEP.
To characterize the mid latency components in sham, we used a percent variance threshold to identify com-
ponents contributing the most variance in this mid latency window. We looked for clusters in the post pulse
GMFP that were greater than the baseline period, and we determined which components contributed the highest
percent variance to each of these clusters.
Percent variance threshold for components that contributed most to the mid latency window. Percent variance
(PVAF) was calculated for the mid latency window for each participant. See Fig. 5A for PVAFs of all components
contributing to the mid latency window in one representative participant. In most participants, we found 1–2
components with a peak PVAF above 28%. This 28% threshold was selected using a data driven approach to iso-
lating sources contributing most to the mid latency window. The representative participant shown in Fig. 5 had a
peak PVAF in component 2. The scalp topography of IC2 (Fig. 5B) had a posterior distribution characteristic of
occipital alpha. The time-course of IC2 in all trials (Fig. 5C) showed presence in baseline, increase in amplitude
after the TMS pulse, and oscillations at approximately 10 Hz (Fig. 5C,D). After removing IC2, GMFP of the sham
condition, calculated across all channels, decreased in both the pre- and post-stimulation windows (Fig. 5E). All
peak PVAF components across participants that exceed 28% variance (N = 7) showed activity in the pre-TMS
baseline window, highest power oscillation in the alpha band, and GMFP reduction when removed in both the
pre- and post-TMS windows. See Supplementary Fig. S4A for individual subject component topographies that
exceeded 28% in this mid latency window. All these components across participants had a posterior distribution
in the scalp topography, although some were at the midline and some suggested left/right laterality. See Fig. 5F
for the average TEP and topographies of all peak PVAF components that met the 28% threshold. Time-courses
and topographies of the mid-latency components in sham suggested brain components that did not meet our
time course/topography criteria for AEP. It is possible the components could be occipital alpha with modulated
power in the post-TMS window.
Between-subject and within-subject site similarity SI was calculated for the identified mid-latency com-
ponents. Within-subject between-site SI was 0.53 ± 0.039, and between-subject SI was 0.12 ± 0.034 for these
components. Together, these SI values indicated that the mid latency components did not exhibit site specificity
but did exhibit subject specificity. Time course of component amplitude peaks showed no consistency across site
within-subject, suggesting these components were not time locked to the TMS pulse.
Similarly, in the older cohort, we identified peak PVAF contributors in mid latency sham using the same
28% variance threshold. 16 participants had at least one component that met this threshold. See Fig. 6D for the
average TEP and topographies. These components exhibited posterior, either central or left/right lateral, scalp
distributions, activity in the baseline period, highest power in the alpha band, and GMFP reduction in both
the pre- and post-TMS windows when removed. See Supplementary Fig. S4B for individual subject component
topographies that exceeded 28% in this mid latency window.
Within-subject between-site SI was 0.32 ± 0.019, and between-subject SI was very low for these components,
0.10 ± 0.026. These SI values indicated that the mid-latency components did not exhibit high site specificity but
did exhibit subject specificity. Time-course of component amplitude peaks between sites suggested these com-
ponents were not time locked to the TMS pulse.
See Supplementary Table S4 for similarity of mid latency components between-subject and within-subject
between-site from all stimulation conditions, and Supplementary Table S5 for SI of TEPs pre- and post-removal
of mid-latency components.
Scientific Reports | (2022) 12:1391 | https://doi.org/10.1038/s41598-022-05397-3 11
Vol.:(0123456789)www.nature.com/scientificreports/
Discussion
In the present study, we show that auditory-evoked potentials (AEPs) evoked by the sound associated with
the discharge of each TMS pulse can be isolated and extracted from the TEP after performing ICA on merged
active and sham stimulation conditions. Using data from two separate studies, we show effective and conserva-
tive extraction of AEP with younger adult as well as an older population, with variations of sham stimulation
protocols, and with different TMS devices and EEG systems. Of note, one of the sham stimulation protocols
included electrical stimulation of the skin, as this is increasingly considered an important element of an effec-
tive sham d esign18,77. We show this method may preserve residual TEP in early, mid and late latency windows.
As an exploratory analysis, we evaluated the residual mid latency TEP for specificity of stimulation site, group,
and individual. This analysis suggests that the method may reveal non-specific alpha band modulations that
were previously obscured by AEP. Our group level analyses of pre- and post-AEP removal suggest that the TEP
is composed of transcranial evoked potentials, sensory-evoked potentials, and site-independent modulation of
ongoing oscillations.
To our knowledge, our study represents an important and novel advance by rigorously and quantitatively
examining the effects on the TEP of removing an AEP component that is shared between active and sham
stimulation. Another aspect of our study that is unique is that the two cohorts that were used differed in several
important factors, including age, gender, the details of the sham application, and the use of auditory noise mask-
ing. The consistency of results across the two cohorts demonstrates the robustness of the AEP removal method
to these multiple experimental factors.
Efficacy and advantages of an ICA‑based approach to removing AEP. Options are needed for
removing AEP from TEP to reveal other brain responses to TMS. Although earplugs and masking6,18,33 can
be used to attenuate AEP, and foam padding can reduce bone conduction of the sound34, these techniques
do not always work as effectively as anticipated. Many groups have observed AEP even after using these
techniques16,17,34–36. Consistent with this literature, in our older cohort, in which auditory noise masking was
used, a majority of participants perceived the ‘click’ and had an AEP. This may be due to contrasting acoustic
properties of the ‘click’ sound and noise masking, or to multisensory contributions to auditory perception and
the AEP. However, regardless of the reason for the persistent AEP, options for effective handling of the AEP
after data collection could be of great use, and we present one option that is effective. Further, we show that this
method is also conservative in that it preserves the earliest TEP that is stimulation site specific and reveals later
activity that could carry information about subject-specific neural modulations.
We show that removing AEPs using this structured ICA-based process significantly reduced GMFP (whole
scalp) and LMFP (of left DLPFC and IPL ROIs) in the post-stimulation TEP (14 to 400 ms), driven by time
windows consistent with the N100 and P200 temporal characteristics of AEP. Further, supported by cosine
similarity analysis, we show that removing AEPs reduces TEP similarity between-subjects and between stimu-
lation conditions. Similarity is reduced most in a mid-latency window, but nevertheless remains higher than
mid-range for the 0–1 SI rating. Residual TEP in this window has a time course and topography unique from
AEP, and follow-up analyses suggest this could be alpha modulation that is not stimulation site specific but is
unique to individual subject.
One property of our isolated AEP components that might seem counterintuitive is that there are slight dif-
ferences in amplitude of the AEP between sites (Fig. 1C). The acoustic properties of the ‘click’ were identical
across conditions6,18, but the AEP amplitudes were not. This could be due to differences between conditions in
coil distance from the ears and/or bone conduction. Nikouline et al.27 observed an amplitude difference between
AEPs when the coil was pressed against the scalp, held 2 cm above the scalp in the air, or 2 cm above the scalp
but with the use of a plastic spacer. In that study, all stimulation conditions were over the same left hemisphere
M1 target, and time course of the AEPs were comparable. The amplitude of N100- and P180 peaks were small-
est when the coil was held above the scalp, intermediate when a spacer was used, and largest when the coil was
pressed directly to the scalp, demonstrating how coil distance from scalp and bone conduction can contribute
greatly to AEP amplitudes. Due to these results, AEP should not be expected to have comparable peak ampli-
tudes under different stimulation conditions. Consequently, merely subtracting out the mean sham-evoked
potential from active stimulation TEPs would not suffice in accounting for differential AEP amplitudes with
other stimulation sites. In contrast, one of the strengths of the ICA approach is that as the underlying neural
generators (and thus the resulting scalp EEG topographies) are stable, differential activations on distinct trials
can be isolated and removed.
One concern is that it is not known what the “ground truth” TEP without any auditory stimulation (including
auditory noise masking) should look like. Rocchi et al. showed suppressed AEP with subthreshold stimulation
and noise m asking18, but future work is needed that demonstrates noise masking efficacy for suprathreshold
intensities, and the resulting TEPs when adequate noise masking is used. The recently developed TAAC tool40
may be particularly helpful in this regard.
To further validate the ICA method, TEPs devoid of AEP should ideally be compared to TEPs remaining
after ICA-based removal of AEP. However, it is still worth noting that adequate noise masking volumes may not
be achievable (due to safety or tolerability reasons) in all participants, and thus this may not always be possible.
Another factor is that it is unknown what effects auditory noise masking itself has on the TEP, and this needs
to be examined in future work. Sustained auditory noise can improve sensory perception44,48, modulate cortical
and sensorimotor e xcitability45,46, and have impacts on cognitive task p erformance48 and, most importantly for
the use in TMS, evoked potentials49–51. In addition, if noise is presented at a volume that is uncomfortable for
participants, there may be modulations in the TEP that reflect a pain related state c hange37–39. A benefit of the
Scientific Reports | (2022) 12:1391 | https://doi.org/10.1038/s41598-022-05397-3 12
Vol:.(1234567890)You can also read