A simple relationship for predicting marathon performance it generally applicable? training
←
→
Page content transcription
If your browser does not render page correctly, please read the page content below
Original Article

A simple relationship for predicting marathon
performance from training: Is it generally
applicable?
GIOVANNI TANDA 1
Department of Mechanical, Energy, Management and Transportation Engineering (DIME), University of
Genova, Italy

                                                     ABSTRACT

The aim of this work is to provide further validation of a predictive formula for marathon time performance
(MPT) published in 2011. The predictive formula has been correlated with new sample points derived mainly
from publicly available data on Strava. The new marathon data points confirm the predictive correlation
between mean weekly distance run, mean training pace and marathon performance. The RMSE of 5.4 min
for MPT in the 2:47−3:36 (hour:min) range is statistically significant. The extension of the correlation validity
for MPT below 2:47 (hour:min) is possible but results are affected by a larger RMSE (9.5 min for MPT).
Therefore, the predictive formula for the MPT can be used by coaches and athletes to adjust training
programmes and to adopt optimal pace strategies during the marathon race.
Keywords: Marathon; Training; Long-distance running; Performance prediction.

    Cite this article as:
    Tanda, G. (2020). A simple relationship for predicting marathon performance from training: Is it generally
       applicable?. Journal of Human Sport and Exercise, in press. doi:https://doi.org/10.14198/jhse.2022.172.05

1
 Corresponding author. Department of Mechanical, Energy, Management and Transportation Engineering (DIME), University of
Genova, Italy. https://orcid.org/0000-0003-4098-5492
   E-mail: giovanni.tanda@unige.it
   Submitted for publication June 25, 2020
   Accepted for publication September 02, 2020
   Published in press September 28, 2020
   JOURNAL OF HUMAN SPORT & EXERCISE ISSN 1988-5202
   © Faculty of Education. University of Alicante
   doi:10.14198/jhse.2022.172.05
                                                                            VOLUME -- | ISSUE - | 2020 |          1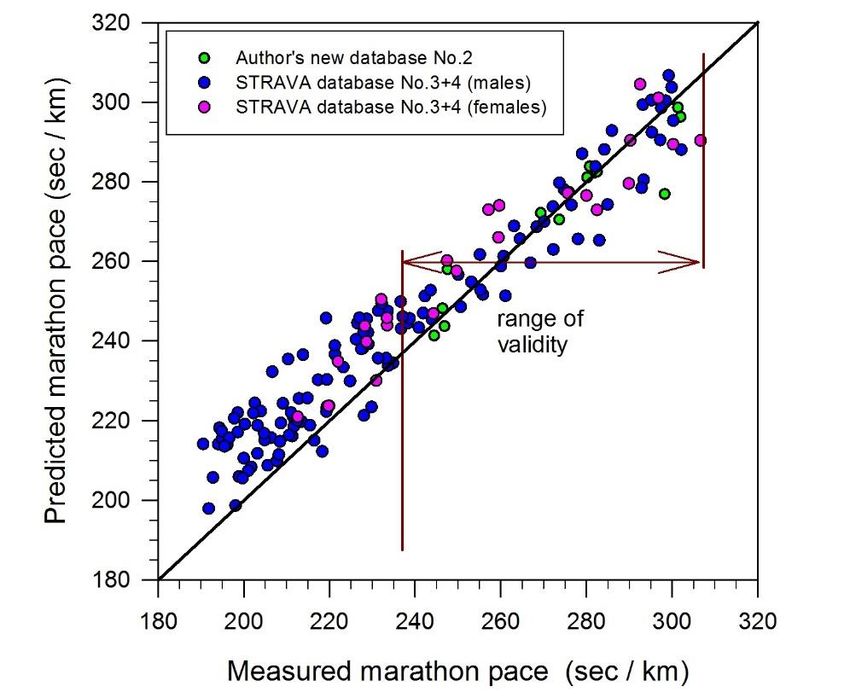
Tanda, G. / Predicting marathon performance from training                  JOURNAL OF HUMAN SPORT & EXERCISE

INTRODUCTION

The number of recreational runners taking part in long-distance races such as the marathon has been steadily
growing. For the increasing mass of marathon runners, the possibility of accurate estimation of running
performance can be helpful to plan optimal race pacing strategies and fulfil the goal-times reducing injury risk
(Altini and Amft, 2018). Performance during the marathon is determined by a variety of factors, including the
physiological and anthropometric characteristics, and training of the subject (Doherty et al., 2020). A
significant body of research has been developed to identify reliable correlation to predict the marathon
performance time (MPT); for instance, some studies were based on the result of incremental treadmill test
(Florence and Weir, 1997), ventilatory threshold (Florence and Weir, 1997), maximal aerobic power (Hagan
et al., 1981 and 1987), skinfold assessment of body fat (Barandun et al., 2012, Tanda and Knechtle, 2013),
and training indices (Slovic, 1977, Hagan et al., 1981 and 1987, Tanda, 2011, Barandun et al., 2012, Tanda
and Knecthle, 2013). Marathon time predictors are also based on previous race performance (e.g.,
https://www.runnersworld.com/uk/training/a761681/rws-race-time-predictor/); these algorithms typically
make use of Riegel endurance equation (Riegel, 1981), which is a simple power function relating the
performance of two races of different distances.

Among the correlations proposed for MPT, a method of predicting performance based only on training indices
may be an attractive, easy, and inexpensive alternative to laboratory testing (typically reserved to elite
athletes). Tanda (2011) proposed a correlation between MPT and training indices recorded over an 8-week
training period ending one week preceding the race. Tanda (2011) reported that the training indices most
highly correlated to MPT were the mean training distance run per week K and the mean training pace P.
These two parameters were combined mathematically to give a prediction of the mean marathon pace P m:

     Pm (sec/km) = 17.1 + 140.0 exp[-0.0053 K(km/week)] + 0.55 P (sec/km)                                  (1)

Eq.(1) was based on data from twenty-two runners (age 28−54 years) who completed 46 races, with
marathon finishing times ranging from 167 to 216 min, i.e., in the 2:47−3:16 (hour:min) range. The deviation
of predicted MPT from measured MPT, expressed by the root mean square error, was about 4 min,
corresponding to an error in marathon pace Pm of 5.8 sec/km. The simplicity of the formula and the availability
of the training data from GPS-enabled wearable technology have led to its adoption by professional coaches
(e.g.,      https://www.jset.run),     its   publication      in     specialised      running     magazines
(https://www.athleticsweekly.com/featured/marathon-pacing-smashing-through-the-wall-40871/) and various
online calculators (e.g. https://tandaracepredictor.com/), none of which were set-up or have any link to the
author.

The aim of this research note is twofold: (i) to reinvestigate the relationship with a larger cohort of athletes,
(ii) to extend the prediction to marathoners with an expected MPT lower than 2:47 (hour:min).

MATERIALS AND METHODS

Eq.(1) was developed on the basis of a limited sample group (22 athletes, 46 marathons, database No.1). All
of them were asked to take a diary where carefully annotating any workout (distance run and elapsed time)
for a period of about two months preceding the marathon race. From its publication date (2011), the author
collected other data (10 new athletes, running 14 marathons), included in the database No.2. Other sample
groups (150 subjects) were extracted from Strava public database. In particular, the selection involved (i): 60

     2      | 2020 | ISSUE - | VOLUME --                                             © 2020 University of Alicante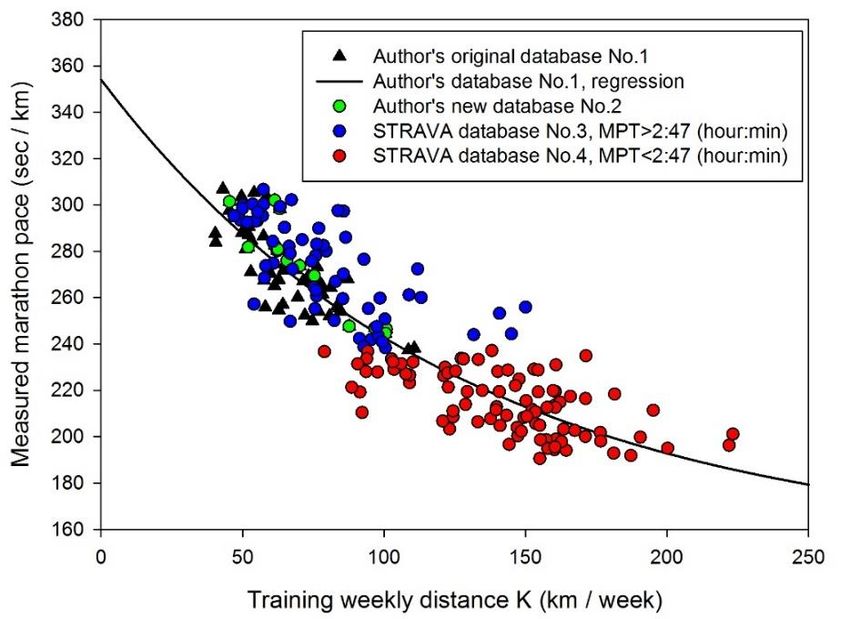
Tanda, G. / Predicting marathon performance from training                  JOURNAL OF HUMAN SPORT & EXERCISE

athletes (45 males, 15 females) having a MPT uniformly distributed in the 2:47−3:16 (hour:min) range,
included in database No.3, (ii) 90 athletes (81 males, 9 females) having a MPT uniformly distributed in the
2:14−2:47 (hour:min) range, included in database No.4. The Strava database was organized by collecting
data from 78 marathons held from 2014 to 2019 throughout the world: Italy (Rome, Florence, Milan, Venice,
Padua, Brescia, Verona, Reggio Emilia), Germany (Berlin, Munich, Frankfurt, Köln, Hamburg), U.K. (London,
Yorkshire, Manchester, Brighton, Stratford-upon-Avon), Spain (Valencia, Seville, Barcelona, San Sebastian),
France (Paris, Reims), Est-Europe (Wien, Prague), Nord-Europe (Stockholm, Copenhagen), U.S.A.
(Chicago, New York, Philadelphia), Brazil (Rio de Janeiro), Japan (Tokyo), and Australia (Sydney). The
selected athletes from Strava dataset met the following inclusion criteria: they performed only running activity
in the observation period (no cycling or swimming) and trained with a volume and intensity which do not differ,
for a given week, more than 20% and 10% from the average of 8 weeks, respectively. Moreover, the
difference between the pace taken during the first and second half of the marathon race, inferred from the
net final and split time results reported in the official website of the marathon, had to be lower than 15 sec/km
(it was 10 sec/km in the original author’s database).

RESULTS

Figure 1 shows the marathon pace predicted by Eq.(1) for the author’s new database (database No.2, 14
points) and for the Strava database No.3 (60 points) showing only data for subjects with a measured MPT >
2:47 (hour:min). For the purpose of comparison, results for the original author’s database No.1 are plotted in
the figure. The statistical analysis of data is reported in Table 1: for both author (No.2) and Strava (No.3)
database, the MBE (Mean Bias Error; i.e., the mean difference between predicted and measured marathon
paces) is close to zero (−1.3 / 0.2 sec/km); i.e., data are practically centred onto the perfect agreement line.
The RMSE (Root Mean Square Error) is 6.86 sec/km for the author group (database No.2), 7.88 sec/km for
the Strava group (database No.3), and 7.69 sec/km (5.4 min in terms of MPT) for the entire new database
(No.2 and No.3, 74 points). The low bias error suggests that the Eq.(1) also fits the two new datasets for
runners completing the marathon in its original range of validity, i.e., in the 2:47−3:36 (hour:min) range.

Table 1. RMSE and MBE of prediction results using the author’s and Strava database.
                                                                        Predicted                Predicted
                   Sample Predicted pace, Predicted MPT,
 Database                                                               pace, MBE                MPT, MBE
                   points RMSE (sec/km) RMSE (min:sec)
                                                                         (sec/km)                (min:sec)
 Author’s original
                     46             5.77                4:04               +0.61                    +0:26
 database (No.1)
 Author’s new
                     14             6.86                4:49               −1.28                    −0:54
 database (No.2)
 Strava database
                     60             7.88                5:32               +0.20                    +0:08
 No.3
 Strava database
                     90            13.54                9:31              +11.20                    +7:52
 No.4
 Database No.2+3     74             7.69                5:25               −0.08                    −0:03
 Database
                    164            11.28                7:56               +6.11                    +4:18
 No.2+3+4

                                                                        VOLUME -- | ISSUE - | 2020 |        3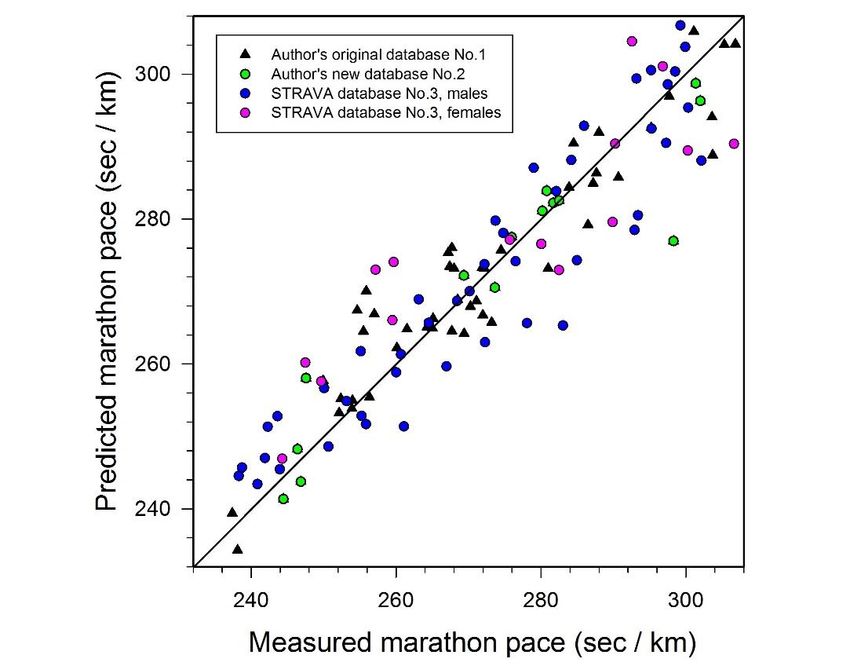
Tanda, G. / Predicting marathon performance from training           JOURNAL OF HUMAN SPORT & EXERCISE

Figure 1. Predicted marathon pace by Eq.(1) versus measured marathon pace for subjects running the
marathon in the 2:47−3:36 (hour:min) range and included in the author’s (No.1 and 2) and Strava (No.3)
database.

Figure 2. Predicted marathon pace by Eq.(1) versus the measured marathon pace for all subjects included
in the author’s new database (No.2) and Strava database (No.3 and 4).

     4      | 2020 | ISSUE - | VOLUME --                                      © 2020 University of Alicante
Tanda, G. / Predicting marathon performance from training JOURNAL OF HUMAN SPORT & EXERCISE
The ability of Eq.(1) to predict marathon performance for runners with MPT < 2:47 (hour:min) was then
investigated. This was accomplished by extracting from Strava data for 90 athletes with MPT in the range
2:14 − 2:47 (hour:min). Figure 2 shows the predicted versus measured marathon paces for the author’s new
database (No.2) and for the entire Strava sample groups (database No.3 and No.4, with male and female
athletes indicated with a different colour). Whereas data falling in the original range of validity of Eq.(1) deviate
only slightly, on average, from the perfect agreement line, the majority of data from the Strava database for
runners with MPT < 2:47 (hour:min) show a significant deviation from the perfect agreement line (irrespective
of gender), with a systematically slower marathon performance predicted. As the entire new database (No.2,
No.3, and No.4, 164 points) is considered, RMSE increases up to 11.28 sec/km (i.e., about 8 min for MPT),
with MBE = +6.11 sec/km). When only data for runners with MPT < 2:47 (hour:min) are considered (90
points), the MBE is +11.20 sec/km (i.e., data are not centred around the perfect agreement line but lie on the
same half of the plot, divided by the perfect agreement line), while the RMSE is 13.54 sec/km (almost the
double of RMSE recorded for slower marathoners), corresponding to 9.5 min for MPT.
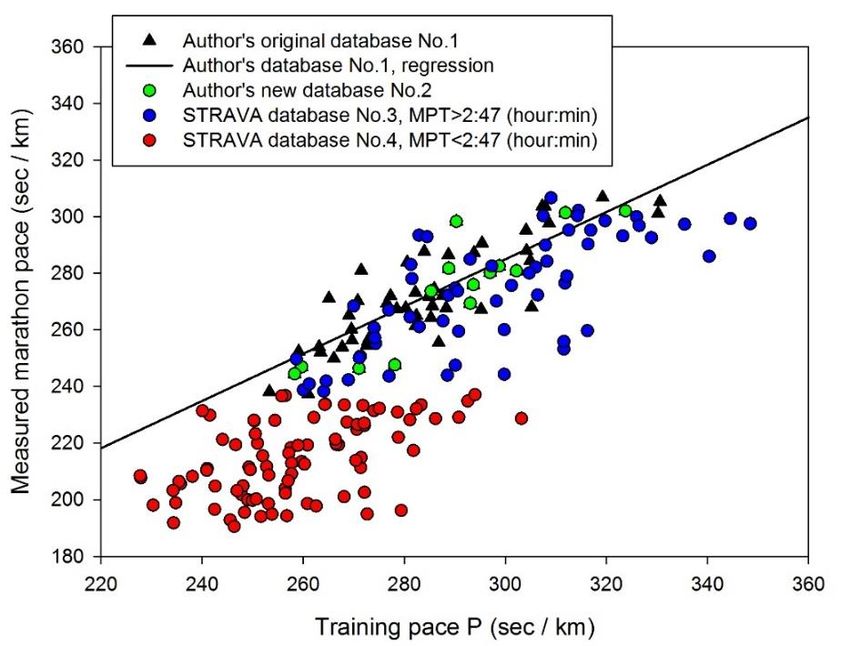
Figures 3 and 4 show the measured marathon pace against the mean distance run per week (K) and the
mean training pace (P), respectively (these are the two variables in Eq.(1)). While all of the measured
marathon pace data plotted versus training distance per week K (Figure 3) are fitted by a single regression
curve (exponential decay), the relationship between the measured marathon pace and the training pace P is
not. The runners that perform better tend to train faster (i.e., have lower training paces).
Figure 3. Measured marathon pace versus the mean training distance per week for all subjects included in
the author’s (No.1 and 2) and Strava database (No.3 and 4).
VOLUME -- | ISSUE - | 2020 | 5Tanda, G. / Predicting marathon performance from training JOURNAL OF HUMAN SPORT & EXERCISE
Figure 4. Measured marathon pace versus the mean training pace P for all subjects included in the author’s
(No.1 and 2) and Strava database (No.3 and 4).
DISCUSSION
Tanda (2011) relationship between training distance, pace and marathon performance (Eq.(1)) predicts
subject ability at a marathon distance challenge with a relatively high probability and can, therefore, help with
the selection of the correct initial marathon pace. Unlike other prediction methods, like those based on
Riegel’s formula (Riegel, 1981), the Tanda algorithm (Tanda, 2011) does not require tests for a given distance
(i.e., faster time for a 5km or 10km run) but it is entirely based on training data accumulated in a relatively
short period prior the race. Since Eq.(1) was obtained from a statistical analysis of training data from a
relatively small sample group, its validation using a larger cohort of athletes is important. Recently, the use
of GPS watches has become very popular with social media services such as Strava
(https://www.strava.com), acquiring and making available a large cache of data from both normal training and
competition performances (Johansson et al., 2020). A major limitation for the use of such data is the
uncertainty in the validity of the activities uploaded. It is sometimes unclear if all of an athlete’s training data
is uploaded, whether sections are missing due to either technical issues or methodological differences in the
use of the pause functions. Also, little is known about additional loads (clothing, heat, terrain, elevation, fasted
training, and temperature) that might alter performance given a certain distance and pace. These issues
could easily lead to poor estimates for both slow and faster runners.
One approach to addressing this problem is to validate the equation using a new selection of runners.
Inspection of Figure 1 reveals that Strava data processed for female athletes perform as male data: it can be
concluded that Eq.(1) may apply to both male and female runners when their MPT expectation is in the
2:47−3:36 (hour:min) range, which corresponds to a large cohort of medium-level amateur marathoners.
6 | 2020 | ISSUE - | VOLUME -- © 2020 University of AlicanteTanda, G. / Predicting marathon performance from training JOURNAL OF HUMAN SPORT & EXERCISE
The processing of Strava data for 90 athletes with MPT < 2:47 (hour:min) poses some concerns, as it can be
inferred from inspection of Figure 2. In order to give a possible interpretation of the misalignment of data
predicted by Eq.(1) for faster marathoners, it is useful to remind the structure of the predictive formula, based
on two independent variables (the training indices K and P) and on four empirical constants (C1, C2, C3, C4)
whose values have been optimised on the basis of the original sample database provided by Tanda (2011):
Pm = C1 + C2 exp[−C3 × K] + C4 × P (2)
In the range of the marathon pace from 237 to 307 sec/km, corresponding to the MPT range between
2:47−3:36 (hour:min), the values of C1, C2, C3, C4 appear to be independent of the subjects (and gender),
and precisely C1 = 17.1, C2 = 140.0, C3 = 0.0053, C4 = 0.55. Conversely, the predictive correlation adapted
to faster runners should be probably corrected on the basis of individual characteristics. Among the four
constants, C1 is an offset value, C2 and C3 rule the relationship between race pace and weekly distance,
while C4 is related to the dependence of race pace on training pace. Figures 3 and 4 show that the relationship
between race pace and mean distance run per week is only slightly affected by the athlete performance (i.e.,
C2 and C3 are likely to be independent of individual characteristics), while faster runners seem to train at a
mean pace markedly higher than that calculated for the original author’s database (modelled on slower
runners). The value of constant C4 reflects the effect of training pace directly on the predicted race pace. If a
subject is able to run the marathon faster than prediction, probably its “personal” C 4 is lower than the
“universal” value (C4 = 0.55) adopted in Eq.(1). There is also a second, more intriguing explanation of the
apparent underestimation of MPT for faster marathoners: most elite athletes train in a so-called polarized
regime, in which most workouts are carried out at low intensities, and a few at very high intensity, or even
they markedly change the intensity during the same workout (interval training, fast short repeats on tracks).
This polarized training regime results in performance improvements as opposed to moderate (or steady)
intensity training, more typical of recreational runners (Esteve-Lanao et al., 2005, Laursen, 2020). Since the
predictive formula is based on an average training pace, it does not account for the positive effect of a
polarized training, leading to an underestimation of the race performance. A correction of the formula (by
adjusting constants C1 and/or C4) to take into account the pacing strategy (i.e., polarized training effect) is a
demanding task since probably a huge amount of training data, differentiated on the basis of each specific
workout, is required. This circumstance does not refute, in the author’s opinion, the possibility, even for faster
runners, to relate the marathon performance to K and P training indices by properly tailoring one or two
constants in Eq.(2).
CONCLUSIONS
The predictive formula for MPT (Eq.(1)), even though outlined on the basis of a limited sample group (but
with very accurate training data), has been proved to be robust and consistent with a new author’s database
and with a database extracted from Strava for marathoners (75% males, 25% females) having a MPT falling
in the validity range of correlation: MPT = 2:47 – 3:36 (hour:min); the RMSE of the predicted marathon pace
for the entire new database (74 points), sufficiently large to provide statistical significance, is 7.69 sec/km
(i.e., 5.4 min for MPT). As an important outcome of this finding, Eq.(1) could help coaches and athletes to
adjust the training programme to the marathon during the last two-month period and to adopt the correct pace
strategy during the race.
The extension of the correlation validity for MPT below 2:47 (hour:min) is possible but in this case the
predictive formula is affected by a larger RMSE (9.5 min for MPT). This can be probably ascribed to polarized
VOLUME -- | ISSUE - | 2020 | 7Tanda, G. / Predicting marathon performance from training JOURNAL OF HUMAN SPORT & EXERCISE
training performed by elite runners that introduces a sort of individual characteristic that Eq.(1) is unable to
take into account in its easy and practical formulation.
SUPPORTING AGENCIES
No funding agencies were reported by the author.
DISCLOSURE STATEMENT
No potential conflict of interest was reported by the author.
ACKNOWLEDGEMENTS
The author sincerely thanks C. Schwiening and J. Sambrook for discussing the strength and weakness points
of the predictive formula for marathon performance time.
REFERENCES
Altini, M. & Amft, O. (2018). Estimating running performance combining non-invasive physiological
measurements and training patterns in free-living. Proceedings of 40th Annual Int. Conf. of the IEEE
Engineering in Medicine and Biology Society (EMBC), Honolulu, USA, 2845−2848.
https://doi.org/10.1109/EMBC.2018.8512924
Barandun, U., Knechtle, B., Knechtle, P., Klipstein, A., Rüst, C.A., Rosemann, T., & Lepers, R. (2012).
Running speed during training and percent body fat predict race time in recreational male
marathoners. Open Access J. Sports Med. 3: 51-58. https://doi.org/10.2147/OAJSM.S33284
Doherty, C., Keogh, A., Davenport, J., Lawlor, A., Smyth, B., & Caulfield, B. (2020). An evaluation of the
training determinants of marathon performance: A meta-analysis with meta-regression. J. Sci. Med.
Sport. 23: 182-188. https://doi.org/10.1016/j.jsams.2019.09.013
Esteve-Lanao, J., San Juan, A.F., Earnest, C.P., Foster, C., & Lucia, A. (2005). How do endurance
runners actually train? Relationship with competition performance. Med. Science Sports Exe. 37:
496-504. https://doi.org/10.1249/01.MSS.0000155393.78744.86
Florence, S. & Weir, J.P. (1997). Relationship of critical velocity to marathon running performance. Eur.
J. Appl. Physiol. 75: 274−278. https://doi.org/10.1007/s004210050160
Hagan, R.D., Smith, M.G. & Gettman, L.R. (1981). Marathon performance in relation to maximal aerobic
power and training indices. Med. Sci. Sports Ex. 13: 185−189. https://doi.org/10.1249/00005768-
198103000-00007
Hagan, R.D., Upton, S.J., Duncan, J.J., & Gettman, L.R. (1987). Marathon performance in relation to
maximal aerobic power and training indices in female distance runners. Br. J. Sports Med. 21: 3−7.
http://dx.doi.org/10.1136/bjsm.21.1.3
Johansson, R.E., Adolph, S.T., Swart, J., & Lambert, M.I. (2020). Accuracy of GPS sport watches in
measuring distance in an ultramarathon running race. Int. J. Sports Sci. Coa. 15: 212-219.
https://doi.org/10.1177/1747954119899880
Laursen, P.B. (2020). Training for intense exercise performance: High intensity or high-volume training?
Scand. J. Med. Sci. Spor. 20: 1-10. https://doi.org/10.1111/j.1600-0838.2010.01184.x
Riegel, P.S. (1981). Athletic records and human endurance. Am. Sci. 69: 285-290.
Slovic, P. (1977). Empirical study of training and performance in the marathon. Res Quart. 48:769−777.
https://doi.org/10.1080/10671315.1977.10615491
8 | 2020 | ISSUE - | VOLUME -- © 2020 University of AlicanteTanda, G. / Predicting marathon performance from training JOURNAL OF HUMAN SPORT & EXERCISE
Tanda, G. (2011). Prediction of marathon performance time on the basis of training indices. J. Hum.
Sport Exerc. 6: 511-520. https://doi.org/10.4100/jhse.2011.63.05
Tanda, G. & Knechtle, B. (2013). Marathon performance in relation to body fat percentage and training
indices in recreational male runners. Open Access J. Sports Med. 4: 141-149.
http://dx.doi.org/10.2147/OAJSM.S44945
This work is licensed under a Attribution-NonCommercial-NoDerivatives 4.0 International (CC BY-NC-ND 4.0).
VOLUME -- | ISSUE - | 2020 | 9You can also read