The 1st International Conference on Local Resource Exploitation
←
→
Page content transcription
If your browser does not render page correctly, please read the page content below
Conférence Internationale LOREXP-2021 : « Chaines de Valeurs et Transformations Intégrales des Ressources Locales », Ngaoundéré, Cameroun, 20 au 23 Avril 2021.

                              The 1st International Conference on Local
                                         Resource Exploitation
                                           www.lorexp.org / info@lorexp.org
                                      REF: LOREXP_2021_A1214 Pages: 745–758

Optimization of green extraction of phenol and flavonoid from Glycine max seeds by the Microwave
                               Assisted Extraction (MAE) method.
     Optimisation de l’extraction des composés phénoliques de la graine de Glycine max par la méthode
                                     d’extraction assistée par microonde.
      Woumbo Cerile Ypolyte1, Kuate Dieudonné1,*, Klang Mathilde Julie1 and Womeni Hilaire Macaire1.
1
 Research unit of Biochemistry of Medicinal Plants, Food Science and Nutrition, University of Dschang/Cameroon.
* Corresponding Author: dkuatefr@yahoo.fr

ABSTRACT:
The present study aimed at determining the optimal conditions for extraction of polyphenolic and flavonoid
compounds from soybean seeds using a green protocol with Microwave Assisted Extraction (MAE). A Face
Center Composite Design (FCCD) was used for optimization. A 50 % hydro-ethanolic solution was used with
solvent/dry matter ratio (60/1 - 110/1), wavelength (120 - 270 W) and time (0 - 10 min) as factors while the
responses studied were polyphenolic and flavonoid contents. The factors that significantly influenced both
responses were individual effect of all factors, interaction between solvent/dry matter ratio and extraction
time, quadratic effect of solvent/dry matter ratio and wavelength for polyphenolic content, while only
quadratic effect of wavelength significantly influenced the flavonoid content. Highest contents of phenols
(6.87 mg GAE/g) and flavonoid (4.46 mg CE/g) were obtained at 150 W for 2 min with a solvent ratio of
70:1. RSM permitted us to develop a green protocol for maximum extraction of phenols and flavonoid using
less solvent, low wavelength and a reduced time in MAE.
Keywords: Optimization, Phenol, Flavonoid, Soybean, Microwave Assisted Extraction

RÉSUMÉ :
Le présent travail avait pour but de déterminer les conditions optimales d’extraction des phénols totaux et des
flavonoïdes des grains de Glycine max (soja) par la méthode d’extraction assistée par microonde. Le plan
composite centré a été utilisé avec pour facteurs le rapport solvant/matière sèche (60/1 - 110/1), la longueur
d’onde du microonde (120 - 270 W) et le temps d’extraction (0 - 10 min), tandis que les réponses étudiées
étaient les teneurs en phénols totaux et en flavonoïdes. Le solvant d’extraction était une solution hydro-
éthanolique (50 %). Tous les facteurs pris individuellement ont significativement influencés les deux réponses,
de même que l’interaction entre le rapport solvant/matière sèche et le temps d’extraction, l’effet quadratique
du rapport solvant/matière sèche et de la longueur d’onde pour les phénols totaux, tandis que seul l’effet
quadratique de la longueur d’onde a montré une influence significative sur la teneur en flavonoïdes. Les
teneurs maximales en phénols (6,87 mg GAE/g) et flavonoïdes (4,46 mg CE/g) ont été obtenues à 150 W
pendant 2 min un rapport solvant/matière sèche de 70/1. Le plan de surface réponse nous a permis de
développer un protocole ‘‘vert’’ pour une extraction optimale de phénols totaux et des flavonoïdes à partir des
graines de soja avec peu de solvant, à une faible longueur d’onde et en un temps réduit par la méthode
d’extraction assistée par microonde.
Mots clés : Optimisation, Phénols, Flavonoïdes, Soja, Extraction assistée par microonde.

    LOREXP-2021 International Conference: “Value Chains and Integral Transformation of Local Resources”, April 20 to 23, 2021, Ngaoundere, Cameroon.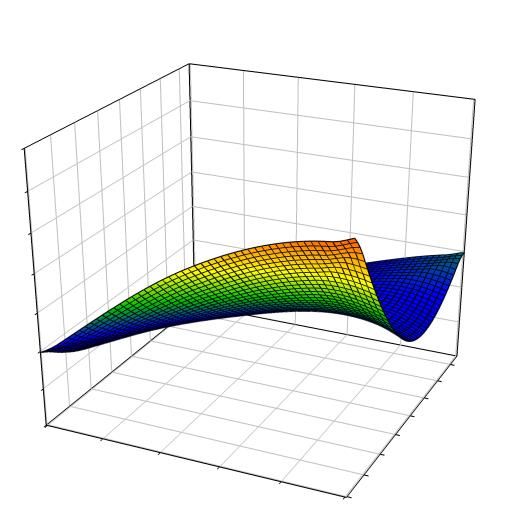
Conférence Internationale LOREXP-2021 : « Chaines de Valeurs et Transformations Intégrales des Ressources Locales », Ngaoundéré, Cameroun, 20 au 23 Avril 2021.

1.        INTRODUCTION
Glycine max (soybean) seeds have long been reported as one of the richest flavonoid sources known
nowadays; with up to 3 mg/g dry weight (Ajay et al., 2011; Babu et al., 2011). Flavonoid,as other
phenolic compounds are known to have antioxidants, anti-inflammatory, anti-cancer activities among
other (Sharma et Beluja, 2015). Common methods such as traditional maceration, soxlhet are often used
to extract phenol and flavonoid from leaves, seeds, bark and other parts. Recently the use of super critical
fluid, Ultrasound Assisted Extraction (UAE) and Microwave Assisted Extraction (MAE) methods for
extraction of phenols are been developped (Ali et al., 2013; Shadab, 2019). Nonetheless, UAE and MAE
are proven to be the most effective in terms of phenol and flavonoid yield, greener, respectful to the
environment (Mandal et al., 2007; Felipe, 2020). But trials to extract these bioactive compounds from
soybean seeds have lead to astonishingly disparate results: extraction yield and even the quality of the
molecules obtained are dependent on many factors including solvent type and proportion, extraction
method, and time. As a result, scientists started using very toxic solvent, high temperature and more
energy to maximize the extraction yield of phenols and flavonoid from soybean seeds, what unfortunately
contributed enough in pollution of our planet. Trying to reverse or at least limit the damages, exigencies
of the so called green chemistry nowadays appeal researchers to use ‘‘green’’ processes in science.
Microwave is the most accessible recent extraction technology compared to ultrasound or supercritical
fluid, thus explains our preference using it. It is noticed from the literature that yields of modern
extraction techniques likeUAE and MAE are conditioned by many factors including nature of the
extracting solvent, time of extraction, power of the equipment, dry matter/solventratio and the nature of
the matrix (Mandal etal., 2007). So, determination of experimental conditions for extraction of the highest
phenol and flavonoid content from soybean seeds using a green protocol is quite urgent since these seeds
are among the richest sources of the named compounds. This study aimed at determining the optimal
conditions for extraction of polyphenols and flavonoid using MAE.

2.        MATERIAL AND METHODS
2.1.      Material
Seeds of Glycine max (varietyTGX-1850-10E) were purchased from “Institut de Recherche Agricole pour
le developpement” (IRAD) Foumbot, West Cameroon and sorted.
2.2.      Method
2.2.1. Preparation of sample
Seeds of Glycine max were dried in an oven at 45 °C until constant weight, and then finely ground using
an electrical grinder (royalty line, 800 W, five cycles of 1 min each at full power). Powders were then
sieved (using a 500 µm sieve) and immediately used for extraction of phenols and flavonoid.
2.2.2. Screening of factors affecting the phenol and flavonoid contents
On the basis of the literature, variables retained for screening were: time of extraction, dry matter/solvent
ratio, proportion of ethanol, and wavelength. Factors influencing the yields of phenols and flavonoids
were determined from table 1:

 LOREXP-2021 International Conference: “Value Chains and Integral Transformation of Local Resources”, April 20 to 23, 2021, Ngaoundere, Cameroon.
Conférence Internationale LOREXP-2021 : « Chaines de Valeurs et Transformations Intégrales des Ressources Locales », Ngaoundéré, Cameroun, 20 au 23 Avril 2021.

Table 1: Experimental tests.

                             Tested factor
                                                           Experiment                  1      2     3
                             Wavelength
                                                           Wavelength(W)               120        180    240
                                                           Time (min)                  5          5      5
                                                           Ethanol (%)                 20         20     20
                                                           Solvent (mL)                30         30     30
                             Time (min)
                                                           Wavelength(W)               240        240    240
                                                           Time (min)                  2          4      6
                                                           Ethanol (%)                 20         20     20
                                                           Solvent (mL)                30         30     30
                             Solvent Proportion
                                                 Wavelength(W)                         240        240    240
                                                 Time (min)                            5          5      5
                                                 Ethanol (%)                           10         20     30
                                                 Solvent (mL)                          30         30     30
                             Dry matter/solvent ratio
                                                 Wavelength(W)                         240        240    240
                                                 Time (min)                            5          5      5
                                                 Ethanol (%)                           20         20     20
                                                 Solvent (mL)                          20         30     40

2.2.3. Extraction of phenol and flavonoid

     For each trial, 1g of seeds’ powder was mixed with the appropriate amount of solvent according to the
     experiment conditions as given by the chosen design. The mixture was stirred using a magnetic
     agitator, afterward, it was allowed to rest for 10 minutes at room temperature before being put in the
     indicated condition for extraction. The supernatant was collected after extraction by filtering through
     Watman paper n°4. Solvent was then evaporated in an air oven at 45 °C for 24 hours. Dry extracts
     were immediately used for determination of phenols and flavonoid content.

2.2.4. Determination of responses
Determination of total phenolic content

The total phenolic content was assessed according to the method proposed by Dohou et al. (2003).
Briefly, 0.2 mL of Folin reagent (tenfold diluted) was added to a tube containing 0.01 mL of plant extract
(5 mg/mL) and 1.39 mL of distilled water. The mixture was allowed to stand for 3 minutes before
addition of 0.4 mL of Sodium carbonate (20 % w/v), and then mixed using a vortex. The tube was then
incubated at 40 °C for 20 min in a water bath and absorbance was read at 760 nm against a blank using a
BIOMATE spectrophotometer. Gallic acid (0.2 g/L) was used to draw a calibration curve. All
experiments were carried out in triplicate and results were expressed as mg of gallic acid equivalent
(GAE) per g of dry extract (mg GAE/g dry weight).
Determination of flavonoid content

 LOREXP-2021 International Conference: “Value Chains and Integral Transformation of Local Resources”, April 20 to 23, 2021, Ngaoundere, Cameroon.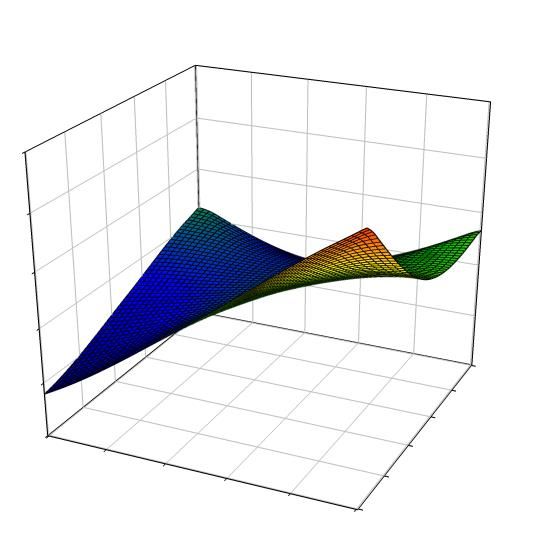
Conférence Internationale LOREXP-2021 : « Chaines de Valeurs et Transformations Intégrales des Ressources Locales », Ngaoundéré, Cameroun, 20 au 23 Avril 2021.

Flavonoid content was obtained using the method described by Padmadja et al. (2011). 0.03 mL of
sodium nitrite (5 %) wasadded to a tube containing 1.49 mL of water and 0.1 mL of extract solution (5
g/mL). After 5 min, a volume (0.003 mL) of aluminium chloride (10 %) was added to the tube and the
mixture was allowedto rest for 6 min.Afterward, 0.3 mL of NaOH (1M) and 0.24 mL of water was
introduced respectively in the tube and mixed with a vortex before absorbance was read at 510 nm against
a blank. Calibration curved was made using catechin. All experiments were made in triplicate and results
expressed as mg of catechin equivalent per g of dry extract (mg CE/g of dry weight).

                                                                Soybeanseeds

                                                             Sorting and drying

                                                              24 hours at 45 °C

                                                                    Grinding

                                            5 cycles of 1 min each at full power (Royalty
                                                             line, 800 W)

                                                                      Sieving

                                                              500 µm meshsieve

                                               Maceration: Soaking 1g of powder into
                                                        solvent for 10 min

                                                                   Extraction

                                                     MicrowaveAssisted Extraction

                                                                    Filtration

                                                                Whatman N° 4

                                                    Residue                             Extract

                                                                                        Drying

                                                                        Air oven at 45 °C for 24 hours

                                                                              Dried extract for
                                                                        determination of polyphenolic
                                                                           and flavonoid contents

                     Figure 1: Extraction flowchart of phenols and flavonoid from soybean seeds

 LOREXP-2021 International Conference: “Value Chains and Integral Transformation of Local Resources”, April 20 to 23, 2021, Ngaoundere, Cameroon.
Conférence Internationale LOREXP-2021 : « Chaines de Valeurs et Transformations Intégrales des Ressources Locales », Ngaoundéré, Cameroun, 20 au 23 Avril 2021.
2.2.5. Optimization of the responses using the Central composite design
All factors: time of extraction, dry matter/solvent ratio and wavelength were observed to influence the
responses. We used the center composite design and the studied responses were total phenolic content
(Y1) and flavonoid content (Y2). Ranges of different factors were taken according to the results of
preliminary experiments. Experiments were randomized and carried out in triplicate. The proposed
models were:
Y = a0+a1X1+a2X2+a3X3+a11X12+a22X22+a33X32+a12X1X2+a13X1X3+a23X2X3
Where Y is the response (phenols or flavonoid content), X1, X2, X3 are the studied factors, a0 is the offset
term while a1, a2, a3are linear effects, a11, a22, a33the quadratic effects and a12, a13, a14, a23, a34 are
interaction effects.
Verification of the model and optimum condition
Table 2: matrix of coded and real variables with responses obtained according to experimental conditions
and predicted values
Trials Matrix of real and coded variables Responses
Polyphenolic (mg Flavonoid (mg
GAE/g) CE/g)
Solvent Wavelenght Time Exp Pre Exp Pre
1 70.00(-1) 150.00(-1) 2.00(-1) 6.87±0.14 6.94 4.46±0.05 4.25
2 100.00(1) 150.00(-1) 2.00(-1) 3.66±0.10 3.87 3.31±0.07 3.20
3 70.00(-1) 240.00(1) 2.00(-1) 4.87±0.09 5.10 2.34±0.02 2.61
4 100.00(1) 240.00(1) 2.00(-1) 1.96±0.17 1.67 1.43±0.05 1.29
5 70.00(-1) 150.00(-1) 8.00(1) 2.09±0.15 2.83 1.25±0.15 1.45
6 100.00(1) 150.00(-1) 8.00(1) 4.24±0.18 4.46 2.11±0.05 1.91
7 70.00(-1) 240.00(1) 8.00(1) 1.75±0.02 1.99 1.70±0.07 1.88
8 100.00(1) 240.00(1) 8.00(1) 2.89±0.09 3.26 1.79±0.05 2.07
9 59.77(-1,68) 195.00(0) 5.00(0) 6.21±0.11 5.66 2.65±0.02 2.40
10 110.22(1.68) 195.00(0) 5.00(0) 4.24±0.06 4.14 1.55±0.07 1.67
11 85.00(0) 119.31(-1.68) 5.00(0) 5.80±0.14 5.27 3.21±0.10 3.42
12 85.00(0) 270.68(1.68) 5.00(0) 2.83±0.11 2.71 2.51±0.10 2.18
13 85.00(0) 195.00(0) -0.04(-1.68) 3.15±0.02 3.23 2.80±0.02 2.93
14 85.00(0) 195.00(0) 10.04(1.68) 1.84±0.09 1.11 1.48±0.07 1.23
15 85.00(0) 195.00(0) 5.00(0) 2.54±0.04 2.43 1.85±0.02 1.85
16 85.00(0) 195.00(0) 5.00(0) 2.42±0.05 2.43 1.92±0.05 1.85
17 85.00(0) 195.00(0) 5.00(0) 2.51±0.15 2.43 1.84±0.02 1.85
18 85.00(0) 195.00(0) 5.00(0) 2.30±0.05 2.43 1.84±0.02 1.85
19 85.00(0) 195.00(0) 5.00(0) 2.33±0.06 2.43 1.82±0.05 1.85
20 85.00(0) 195.00(0) 5.00(0) 2.39±0.06 2.43 1.84±0.02 1.85
Bold values are replicates of the center points. Pre are predicted values
LOREXP-2021 International Conference: “Value Chains and Integral Transformation of Local Resources”, April 20 to 23, 2021, Ngaoundere, Cameroon.Conférence Internationale LOREXP-2021 : « Chaines de Valeurs et Transformations Intégrales des Ressources Locales », Ngaoundéré, Cameroun, 20 au 23 Avril 2021.
2.2.6. Statistical analysis
Designing and analysis of the results were done using Minitab 18. Experiments were carried out in
triplicate. Statistical significance of the model variables was determined at 5 % probability level. Main
effects and contour plots were plotted using Sigma Plot v11.0 (c) systat. Data on phenol and flavonoid
contents were expressed as mean± SD and compared using Bonferroni test with the software SPSS
version 22.
3. RESULTS AND DISCUSSION
3.1. Screening factors
3.1.1. Results of the screening
Results of the screening factors were as indicated in table 3: usage of high wavelength lead to a reduction
in both the polyphenolic and the flavonoid content of the extracts. Long cooking time almost induced a
linear reduction of the two studiedresponses. Short times were seen to be best for highest responses.
Variation of ethanol proportion in the extracting solvent lead to a linear progression of both
responses.Thisobservation means ethanol may be more effective in extracting polyphenol and flavonoid
than a hydro-ethanolic solvent. Effect of dry matter/solvent ratio: we noticed that any increase in the
solvent proportion leads to an increase inboth polyphenolic and flavonoid contents.
Table 3: conditions and responses for the screening
Experiment
Conditions Phenols Flavonoids
(mg mg CE/g)
GAE/g)
Wavelength
W (120W) 1.9 1
W (180W) 1.3 0.8
W (240W) 0.8 0.4
Time (min)
T (2min) 2.9 1.3
T (5min) 1.5 0.7
T (8min) 1.3 0.6
Ethanol Proportion
E(20 %) 1.9 1.2
E(50 %) 4.3 2.4
E(80 %) 2.1 1.3
Dry matter/solvent ratio
DM/S (30) 1.2 0.4
DM/S (60) 3.9 1.3
DM/S (80) 2.1 1.8
While testing the influence of any factor, the others were respectively kept constant at: wavelength (180 W), time
(5 min), solvent /dry matter ratio (30/1) and ethanol proportion (20 %).
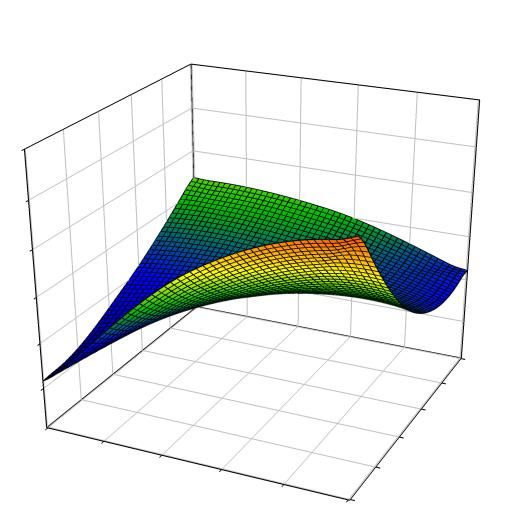
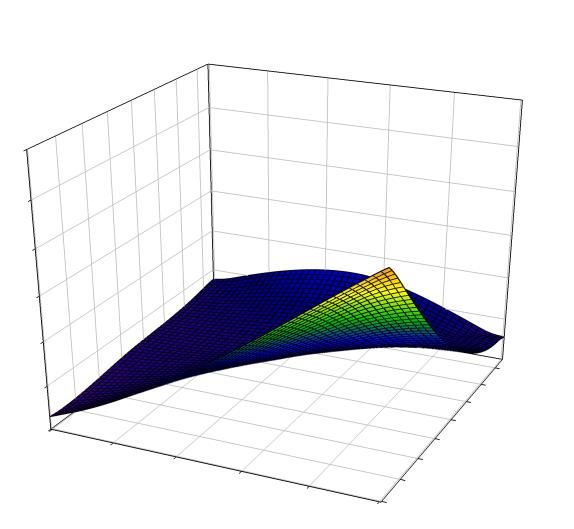
LOREXP-2021 International Conference: “Value Chains and Integral Transformation of Local Resources”, April 20 to 23, 2021, Ngaoundere, Cameroon.Conférence Internationale LOREXP-2021 : « Chaines de Valeurs et Transformations Intégrales des Ressources Locales », Ngaoundéré, Cameroun, 20 au 23 Avril 2021. 3.1.2. Optimization of the responses using the Central composite design Results of the screening permitted the optimization of the process using three (3) main factors for the production of phenol and flavonoid from soybean seeds, namely the microwave wavelength, the cooking time and the solvent/dry matter ratio. Ethanol proportion was decided to be 50 % since wehad noticed a maximal production with 50 % ethanol proportion (in the solvent) in the phenol and flavonoid contents during the screening. Also, literature indicates that, dielectric properties of the solvent should be highly taken into consideration when planning to extract phenolic compounds using MAE. Compared to water, ethanol or its mixtures with water have a lower dielectric constant, and are more transparent to microwave, thus not well converting them into heat. But its high capacity to dissolve and extract phenolic compounds (Inglett et al., 2010; Rafiee et al., 2011; Naima et al., 2019) and its greenness oriented our choice of an hydro-ethanolic solution as extracting solvent. Table 2 gives the different factors retained for optimization, in coded and real values with experimental and predicted values of the responses. 3.1.3. Analysis of main effects The entire experimental plan consisted of 20 trials. Responses were evaluated in triplicate. The highest polyphenolic content (6.87 mg of GAE/g of dry seed weight) was obtained at 150 W for 2 min of cooking time with 70 mL of solvent.The lowest content (1.75mg GAE/mg) is observed at 240W of microwave power with 70 mL of extracting solvent and a heating time of 8 min.Concerning the flavonoid content, the highest value (4. 46 mg QE/g of dry weight) was obtained at 150 W of microwave power, 2 min heating time in 30 mL of solvent.The lowest flavonoid content(1.25mg CE/g) is obtained with 70 mL of solvent at 150 W for a boiling time of 2 min. values ranging from 1.75 to 6.78 mg of GAE/g and 1.25 CE/g to 4.46 CE/g of extract for polyphenolic and flavonoid content respectively were similar to those obtained by Djordje et al. (2007), Sakthivelu et al.(2008) and Ana et al. (2016). Effect of solvent ratio Figure1shows that increase in the solvent ratio induces an almost linear reduction the polyphenolic content of extracts when going from 60/1 to 80/1 (mL of solvent/g of seed dry weight) solvent ratio. But the responses measured started increasing as the solvent ratio passed from 90:1 to greater values. Such results indicates that, the researcher is free to choose between less or more solvent to extract phenols from soybean seeds, even if less solvent is advised for a reduction of energy consumption and greenness of the method. Further research isneeded to know the types of phenolic compounds obtained at low and high solvent ratio since literature indicatesthat free or bound phenolic compounds are found in soybean and both are not extracted in the same experimental conditions, solvent ratio/dry matter included (Sanja et al., 2018). Nevertheless, it is well accepted nowadays that high solvent ratio increase mobility of compounds (mass transfer) from plants matrix, thus explaining the observed increase inthe polyphenolic content of extracts at certain solvent ratio, since previous research had already reported that (Mohamed & Chang, 2008). Increase in the solvent ratio only led to a progressive diminution of the flavonoid content. Effect of wavelength Figures 2and 3 depict the influence of wavelength on the polyphenolic and flavonoid contents of extracts. We can see from the figures that increase in the wavelength induces a reduction in the phenol and LOREXP-2021 International Conference: “Value Chains and Integral Transformation of Local Resources”, April 20 to 23, 2021, Ngaoundere, Cameroon.
Conférence Internationale LOREXP-2021 : « Chaines de Valeurs et Transformations Intégrales des Ressources Locales », Ngaoundéré, Cameroun, 20 au 23 Avril 2021.

flavonoid contents of soybean seeds extracts. This is a consequence of degradation of these compounds
exposed to high temperature, since high power in microwave induce a quick elevation of the solvent
temperature even when exposure is for a short duration. Sanja et al. (2018) made similar observation.
Effect of time

From the following figures, we can see that any increase in time of exposure also led to linear diminution
of the phenolic and flavonoid contents of extractsbecauseof progressive destruction of these thermo-
sensitive compounds under long exposure to heat. Previous authors also noticed the same effect (Rafiee et
al., 2011; Sanja et al., 2018 and Xuan et al., 2019).

                                                                          Graphic of principal effects for phenols
                                                                                        Ajusted means
                                                                Solvent ratio             Wavelenght                 Time
                                                   6

                                                   5
                            Means for Phenols

                                                   4

                                                   3

                                                   2

                                                   1
                                                          60      80         1 00      1 50      200       250   0    5      10

                         Figure 2: main effect plots of individual factors on polyphenolic content

                                                                         Graphic of principals effects for flavonoides
                                                                                         Ajusted means
                                                                 Solvent ratio                Wavelenght             Time
                                                   3,5

                                                   3,0
                           Means for flavonoides

                                                   2,5

                                                   2,0

                                                   1 ,5

                                                   1 ,0
                                                           60       80          1 00    1 50      200      250   0    5      10

                           Figure 3: main effect plots of individual factors on flavonoid content

 LOREXP-2021 International Conference: “Value Chains and Integral Transformation of Local Resources”, April 20 to 23, 2021, Ngaoundere, Cameroon.
Conférence Internationale LOREXP-2021 : « Chaines de Valeurs et Transformations Intégrales des Ressources Locales », Ngaoundéré, Cameroun, 20 au 23 Avril 2021. 3.1.4. ANOVA, regression equations for the responses Table 6 shows the ANOVA, the influence of each independent factor. We can see from the table that all independent factors significantly(p
Conférence Internationale LOREXP-2021 : « Chaines de Valeurs et Transformations Intégrales des Ressources Locales », Ngaoundéré, Cameroun, 20 au 23 Avril 2021.

Table 4: Evaluation of quadratic model: P value, F value, RC, CF (%), AADM and Bf for phenols and
flavonoid

Source                        Polyphenolic content                                Flavonoid content
                              P        F       RC                          CF (%) P       F         RC                            CF (%)
                              value    value                                      value   value
Solvent ratio(X1)             0.005    12.76 - 0.795                       6.18 0.011 9.74          - 0.087                       5.52

Wavelenght (X2)               0.000           36.45 - 0.121                17.65 0.000               28.32         - 0.083        16.04

Time (X3)                     0.001           24.96 - 2.693                12.09 0.000               53.08         - 1.715        30.06

  X1* X1                      0.000           50.79 + 0.003                22.72 0.346               0.98          + 0.000        0.11

  X2* X2                      0.001           20.27 + 0.000                10.24 0.001               24.64         + 0.000        13.43

  X3* X3                      0.473           0.56        - 0.010          0.27        0.258         1.44          + 0.009        0.81

  X1* X2                      0.601           0.29        - 0.000          0.14        0.482         0.53          - 0.000        0.30

  X1* X3                      0.000           51.09 + 0.026                24.74 0.002               17.19         + 0.008        9.74

  X2*X3                       0.158           2.33        + 0.001          1.13        0.000         32.37         + 0.003        18.33

Validation of the model

           R2                                   0.95                                                            0.94

        AADM                                    0.00                                                            0.00

           Bf                                   0.99                                                            0.99

Bold: individual factors that significantly (p
Conférence Internationale LOREXP-2021 : « Chaines de Valeurs et Transformations Intégrales des Ressources Locales », Ngaoundéré, Cameroun, 20 au 23 Avril 2021.
Contour-plot for Phenols: wavelenght; solvent ratio
Phénols
260 < 3
3 – 4
4 – 5
240
5 – 6
6 – 7
220 7 – 8
> 8
waelenght
200 constant value
time 5
1 80
1 60
1 40
1 20
60 70 80 90 1 00 110
solvent ratio
Figure 4: contour-plot for phenols function of avelength and solvent ratio
Contour-plot for Phenols: time; solvent ratio
10
Phénols
< 2
2 – 4
4 – 6
8
6 – 8
> 8
constant value
6 wavelenght 1 95
time
4
2
0
60 70 80 90 1 00 110
solvent ratio
Figure 5: contour-plot for phenols function of time and solvent ratio
LOREXP-2021 International Conference: “Value Chains and Integral Transformation of Local Resources”, April 20 to 23, 2021, Ngaoundere, Cameroon.Conférence Internationale LOREXP-2021 : « Chaines de Valeurs et Transformations Intégrales des Ressources Locales », Ngaoundéré, Cameroun, 20 au 23 Avril 2021.
Contour-plot for Phenols: time; wavelenght
10
Phénols
< 2
2 – 3
3 – 4
8
4 – 5
5 – 6
> 6
6 constant value
solvent ratio 85
time
4
2
0
1 20 1 40 1 60 1 80 200 220 240 260
wavelenght
Figure 6: contour-plot for phenols function of time and wavelength
0
7 5
1 1
2 2
3
CE/g)
6 3
CE/g)
4 4
4
5 5
5 6
Flavonoid (mg
Flavonoid (mg
3
7
4
2
3
110
260
240 1 100
2
220 90
200
1 0
t)
)
10 180 10 80
W
igh
8 160 8
(
6
we
6 70
ht
4 140 4
ng
y
2 2
dr
120 60
ele
Time 0 Time 0
/g
( min)
av
(min)
ml
W
(
tio
ra
nt
lve
So
1
2 10 0
8
3 2
4 4
7 5 8 6
/g)
E/g)
6 8
phenols (mgGAE
6 7 10
phenol (mg GA
8 6
5
4
4
2
3 110
260
240 100
2 0
220
90
200
1
)
)
10 180 10 80
(W
ht
8 8
eig
160
ht
6 6 70
yw
ng
4 140 4
2
ele
2
dr
120 Time 60
Time 0 (min 0
av
of
( min) )
W
l/g
(m
tio
Figures 7 a, b, c and d: responses surfaces curves for flavonoid and phenol content considering the different
ra
nt
lve
factors taken 2 by 2
So
LOREXP-2021 International Conference: “Value Chains and Integral Transformation of Local Resources”, April 20 to 23, 2021, Ngaoundere, Cameroon.Conférence Internationale LOREXP-2021 : « Chaines de Valeurs et Transformations Intégrales des Ressources Locales », Ngaoundéré, Cameroun, 20 au 23 Avril 2021.
3.2. Confirmation experiments
In order to verify the quality of our model to predict the optimal conditions for our responses,
experiments were made, replicating optimal conditions and results compared with the predicted maximal
values. So significant differences were noticed between optimal predicted values and experimental values
obtained both for polyphenolic and flavonoid contents, thus confirming the validity of the predicted
optimal values given by the software.
Table 5: Experimental, predicted values, desirability for phenol and flavonoid in optimal conditions
Optimal predicted value Optimal experimental value Desirability
Phenol (mg GAE/g) 13.09a 12.97±0.05 a 1.00
Flavonoid (mg CE/g) 7.39 a 7.42±0.09 a 1.00
On the same line, values with different letters significantly differ (p>0.05)
4. CONCLUSION
The study aimed at determining the optimal conditions for extraction of polyphenolic and flavonoid
compounds from soybean seeds using a green protocol. RSM was used to determine the conditions and
we found out that all factors, namely solvent ratio, time and wavelength significantly influenced both
responses. Apart from the solvent ratio which effect tended to reduce the responses when going on any
side (higher or lower) of the value 90/1, any increase in other selected factors lead to an almost linear
reduction of the responses, suggesting that low solvent, wavelength and time of exposure should be use
when attempting to obtain a high polyphenolic and flavonoid content extracts from soybean seeds with
MAE. RSM used in this research permitted us to define the conditions for a green extraction of high
phenols and flavonnoid from soybean as: 60/1 solvent/dry matter ratio, 120 W wavelength and 0.16 min
time.
5. AUTHORS CONTRIBUTION AND FUNDING
Woumbo Cerile Ypolyte and Kuate Dieudonné conceived the work, collected seeds, carried out
experimentations, analysed and interpreted data and wrote the paper. Klang Mathilde Julie followed up
the work, verified data analysis and read the paper for correction. Womeni Hilaire Macaire supervised the
work and read the paper.
All authors have approved the final article.
This research did not receive any specific grant from funding agencies in the public, commercial, or not-
for-profit sectors.
6. DECLARATION OF CONFLICT OF INTEREST
None.
LOREXP-2021 International Conference: “Value Chains and Integral Transformation of Local Resources”, April 20 to 23, 2021, Ngaoundere, Cameroon.Conférence Internationale LOREXP-2021 : « Chaines de Valeurs et Transformations Intégrales des Ressources Locales », Ngaoundéré, Cameroun, 20 au 23 Avril 2021.
7. REFERENCES
Ajay K., Antony J., Navin K., Sharma Rakesh K., 2011. Soybean constituents and their functional benefits, Chapter
12, in Book: Opportunity, Challenge and Scope of Natural Products in Medicinal Chemistry, ISBN: 978-81-
308-0448-4, 367–383.
Ali K., Meredith A., Thomas H., 2013. Techniques for analysis of plant phenolic compounds Molecules. 18, 2328–
2375.
Ana J., Rezica S., Aleksandra S., Vlatka J., Maja M., Antonela M., 2016. Total phenolic and total flavonoid content
variability of soybean genotypes in eastern Croatia. Croatian Journal of Food Science and Technology, 8(2)
60–65.
Babu S., Sathiyamoorth S., Palanisamy P., Boopathi S., Rajaram V., 2011. Antioxidant and antimicrobial
properties of Glycine Max-A review. I. J. C. B. M. S.; 1(2): 49–62.
Djordje M., Milan P., Jegor M., 2007. Phenolic Content and Antioxidant Properties of Soybean (Glycine max (L.)
Merr.) Seeds. Molecules,12, 576–581.
Felipe O., 2020. Recent advances and comparisons of conventional and alternative extraction techniques of
phenolic compounds. J. Food Sci.Technol., 57(12), 4299–4315.
Inglett G., Rose D., Chen D., Stevenson D., Biswas A., 2010. Phenolic content andantioxidant activity of extracts
from whole buckwheat (FagopyrumesculentumMöench) with or without microwave irradiation. Food Chem.,
119, 1216–1219.
Joglekar A., May A., 1987. Product excellence through design of experiments. Cereal Food World, 32, 857–868.
Mohamed A., Chang Y., 2008.Optimization of phenolics and dietary fibre extraction from date seeds. Food Chem.;
108, 977–985.
Naima R., Hannache H., Oumam M., Sesbou A., Charrier B., Pizzi A., Charrier-El Bouhtoury F., 2019. Green
extraction process of tannins obtained from Moroccan Acacia mollissima barks by microwave: Modeling and
optimization of the process using the response surface methodology RSM. Arab. J. Chem., 12, 2668–2684.
Rafiee Z., Jafari S., Alami M., Khomeiri M., 2011. Microwave-assisted extraction of phenolic compounds from
olive leaves; a comparison with maceration. J. Anim. Plant Sci., 21(4), 738–745
Sakthivelu G., Akitha M., Giridhar P., Rajasekaran T., Ravishankar G., Nikolova M., Angelov G., Todorova R.,
Kosturkova G., 2008. Isoflavone Composition, Phenolcontent, andantioxidant activity of soybean seeds from
India and Bulgaria. J. Agri. Food Chem., 56, 2090–2095.
Sanja D., Bogdan, N., Nevena L., Jelena J., Andrea S., Nataša Š., Dušan M., Zorica K., 2018. The impact of high-
power ultrasound and microwave on the phenolic acid
profile and antioxidant activity of the extract from yellow soybean seeds. Ind. Crops. Prod, 122, 223–231.
Shadab G., 2019. Extraction Techniques of Phenolic Compounds from Plants. DOI: 10.5772/intechopen.84705
Vivekananda M., Yogesh M., Hemalatha S., 2007. Microwave Assisted Extraction-An innovative and promising
extraction tool for medicinal plant research. Pharmacogn. Rev., 1(1).
Xuan T., Vo L., Tran Q., Long G., Tran T., Pham T., 2019. Extraction process of polyphenols from soybean
(glycine max l.) sprouts: optimization and evaluation of antioxidant activity. Processes, 7, 489.
LOREXP-2021 International Conference: “Value Chains and Integral Transformation of Local Resources”, April 20 to 23, 2021, Ngaoundere, Cameroon.You can also read