A SCIENCE POLICY REPORT ISSUED BY - the American Physical Society and Optica
←
→
Page content transcription
If your browser does not render page correctly, please read the page content below

A SCIENCE POLICY REPORT ISSUED BY
the American Physical Society and Optica
MAY 2022

ABOUT APS & POPA                                               APS STAFF
Founded in 1899 to advance and diffuse the knowledge           Jorge Nicolás (Nico) Hernández Charpak, Federal
of physics, the American Physical Society (APS) is now            Relations Senior Associate
the nation’s leading organization of physicists with more      Janay Oliver, Office of External Affairs Operations and
than 50,000 members in academia, national laborato-               Program Manager
ries and industry. APS has long played an active role in
the federal government; its members serve in Congress          Francis Slakey, Chief External Affairs Officer
and have held positions such as Science Advisor to the         Mark Elsesser, Director of Government Affairs
President of the United States, Director of the CIA, Direc-
tor of the National Science Foundation and Secretary of
Energy. Learn more: https://aps.org/about/index.cfm            OPTICA STAFF
This report was overseen by the APS Panel on Public            David Lang, Senior Director, Global Policy and Affairs
Affairs (POPA). POPA routinely produces reports on
timely topics being debated in government so as to
                                                               AUTHORSHIP
inform the debate with the perspectives of physicists
working in the relevant issue areas.                           The American Physical Society and Optica have sole
                                                               responsibility for the contents of this report and the ques-
                                                               tions, findings, and recommendations within. The views
ABOUT OPTICA                                                   expressed in this report do not necessarily represent
                                                               the views of the U.S. Department of Energy, U.S. Depart-
Optica (formerly OSA), Advancing Optics and Photonics
                                                               ment of Commerce, Lawrence Berkeley National Labora-
Worldwide, is the society dedicated to promoting the
                                                               tory, National Institute of Standards and Technology, or
generation, application, archiving and dissemination of
                                                               National Oceanic and Atmospheric Administration.
knowledge in the field. Founded in 1916, it is the leading
organization for scientists, engineers, business profes-
sionals, students and others interested in the science
                                                               ACKNOWLEDGEMENTS
of light. Optica’s renowned publications, meetings,
online resources and in-person activities fuel discover-       We acknowledge the help and support from APS and
ies, shape real-life applications and accelerate scientific,   Optica staff and leadership, as well as the contributions
technical and educational achievement. Learn more:             made by the external reviewers and members of the
https://www.optica.org/en-us/about/                            community that made themselves available to the report
                                                               committee.

REPORT COMMITTEE
                                                               PUBLICATION DATE: MAY 2022
William Collins (Co-Chair), Lawrence Berkeley National
   Laboratory, University of California, Berkeley
Raymond Orbach (Co-Chair), University of Texas                            American Physical Society
   at Austin
                                                               This report is available under the terms of a Creative
Michelle Bailey, National Institute of Standards
                                                               Commons Attribution 4.0 International License. Shar-
   and Technology
                                                               ing and adapting the material for any purpose, even
Sebastien Biraud, Lawrence Berkeley National                   commercial, does not require prior written permission.
  Laboratory                                                   Further distribution of this work must provide appropri-
Ian Coddington, National Institute of Standards                ate credit, provide a link to the license, and indicate if
   and Technology                                              changes were made. For more information, please visit
                                                               the Creative Commons website.
David DiCarlo, University of Texas at Austin
Jeff Peischl, Cooperative Institute for Research in            Cover and report designed by Travis Frazer.
   Environmental Sciences and the National Oceanic
                                                               For additional information, including the participant
   and Atmospheric Administration
                                                               bios and the workshop charge and agenda, please visit:
Anuradha Radhakrishnan, University of Texas at Austin          https://www.aps.org/policy/reports/popa-reports
David Schimel, Jet Propulsion Laboratory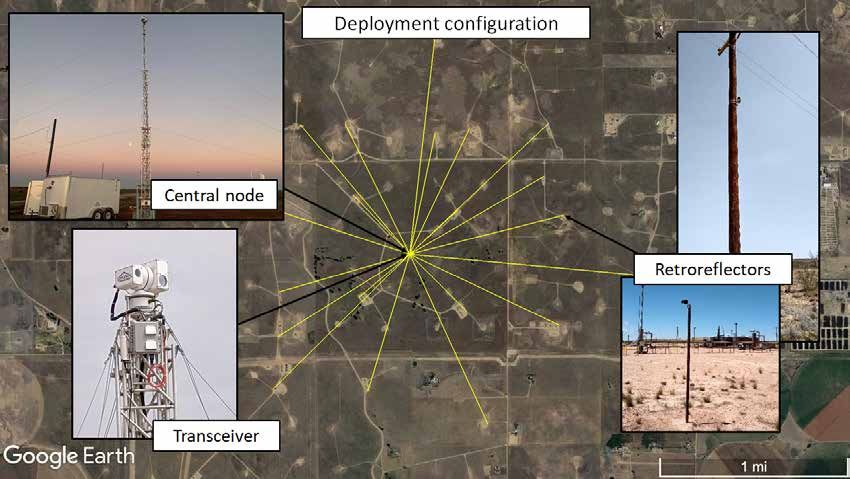
Table of Contents

I.      Executive Summary....................................................................................................................... 1

II.     Monitoring Methane and Flaring is Necessary........................................................................ 3

III. Current Capabilities for Measuring Methane Emissions........................................................ 8

IV.     Current State and Future Directions of Methane LDAR......................................................... 12

V.      Summary of Identified Needs.................................................................................................... 20

VI. Research Recommendations..................................................................................................... 21

VII. Policy Recommendations........................................................................................................... 24

VIII. Closing Summary......................................................................................................................... 26

IX. Bibliography.................................................................................................................................. 28
I. EXECUTIVE SUMMARY
Methane (CH4) is the second-most-abundant anthropogenic (human-created) green-
house gas and significantly contributes to global warming. Consequently, there is
an urgent need to reduce methane emissions to help reduce temperature increases
from anthropogenic greenhouse gases. An essential part of any strategy to mitigate
methane emissions is the ability to accurately measure and monitor the amount and
location of methane released by various sectors. This report identifies several policy
recommendations that can substantially enhance the detection of methane released
by the oil and gas sector. These recommendations could strengthen measures already
taken by that sector to manage methane and enhance worker safety.

The atmospheric concentration of methane has risen rapidly since the start of the
industrial revolution in the 18th century, from 730 parts per billion (ppb) in 1750 to
1866 ppb in 2019, due primarily to human activities. The recent increases in methane
concentrations appear to be equally contributed by the fossil-fuel sector and by a
combined contribution from agricultural activity and waste sources.

Quantifying emissions from the fossil-fuel sector has led to three consequences. First,
companies that are losing a valuable commodity to the atmosphere have begun using
the latest technology for leak detection and repair (LDAR). Second, with the global
community moving toward regulation of greenhouse gas emissions, the question of
how to verify emission decreases from the oil and gas industry has arisen. Lastly, the
scientific community has started to form a picture of how these emissions are distrib-
uted and how different components, sites, and processes contribute. It has become
clear that a small portion of methane sources (such as leaks) are contributing a signif-
icant fraction of the total emitted natural gas. Identifying and mitigating these large
leaks quickly can potentially reduce production costs while alleviating a large percent-
age of the emission problem.

For methane emission regulation to be most effective, it should specifically target the
small portion of leaks that are major emitters. Additionally, data should be publicly
available and with high enough spatial resolution to determine the source of the
emissions, especially in regions where well pads owned by different companies are
spatially collocated. Domestically, ground and aircraft measurements offer sensitive
and cost-effective approaches for frequent or continuous monitoring of individual
assets. At the same time, limiting methane emissions will need to be done globally.
Satellite measurements are uniquely capable of supporting international collabora-
tions to identify significant sources worldwide and informing international agreements
to mitigate emissions.

Three scientific and technological advances across several fields would appreciably
improve our ability to measure and monitor methane emissions. The first would be
the construction of improved high-resolution spectroscopic databases for methane,
especially for its near-infrared spectral bands commonly used for remote sensing. The
second would be the invention of improved methods for remote sensing of carbon

APS & Optica | Monitoring Methane Emissions from Oil and Gas Operations               1
isotopes, which would greatly facilitate identifying fuel source type. The third would
be the development of high quantum efficiency detectors to support methane LIDAR
(light detection and ranging instruments), which would be particularly advantageous
for resolving the three-dimensional distribution of methane in the Earth’s atmosphere.

To support emerging national and international efforts to mitigate emissions of meth-
ane, three areas of policy development would be beneficial:

Methane emissions detection:
 • The federal government should invest in research that seeks to improve the emis-
   sion detection limits for satellite instruments and to develop capabilities to resolve
   the spatial structure and isotopic composition of methane.

 • The federal government should require and/or incentivize a system of 24/7 continu-
   ous monitoring and quantification of methane emissions for U.S. oil and gas opera-
   tions based on the latest generation of methane monitoring technologies.

 • The federal government should establish national facilities for testing new technol-
   ogies and intercalibrating methane measurements that would support a tiered and
   federated observational network.

Reliable and systematized data and models to support mitigation measures:
 • A unified national repository of observations of methane concentrations and emis-
   sions open to the international climate community would help monitor progress
   towards mitigation targets.

 • A national operational methane hindcast and forecast model, especially in conjunc-
   tion with such a repository, would help identify the emergence of new significant
   sources of methane as well as project the long-term efficacy of policies to reduce
   its emission.

Effective regulation:
 • The federal government should equip agencies with adequate and appropriate
   methane measurement capabilities, empowering them to partner with the private
   sector as well as state and local public sectors on methane monitoring. The govern-
   ment should support federal agencies to improve the fidelity and increase the
   frequency of updates of their anthropogenic methane emissions databases, partic-
   ularly from the oil and natural gas sectors.

 • In partnership with public- and private-sector stakeholders, the federal government
   should design a regulation structure for a high-impact and cost-effective approach
   to reducing methane emission from oil and gas operations.

This report is deliberately focused on methane emissions from oil and natural gas oper-
ations. While agriculture and agricultural waste constitute the dominant sources of
emissions worldwide, the measures to mitigate emissions from agricultural and fossil-
fuel sectors can be quite different. The authors also recognize that the methane emis-

APS & Optica | Monitoring Methane Emissions from Oil and Gas Operations                2
sions from the leaks in the U.S. oil and gas supply chain are as much as 60% higher
than official inventory estimates. However, to focus on emissions that can be readily
addressed by targeted measures at significant point sources, this study is intentionally
delimited to methane released to the atmosphere from the production of fossil fuels.

II. Monitoring Methane Emissions and Flaring from
Oil and Gas Operations is Necessary
This report focuses on the gaps in our quantitative observations of the fossil-fuel sector’s
methane emissions. These gaps need to be addressed with advanced physics-based
methods to fully characterize their highly spatially heterogeneous and temporally inter-
mittent point sources. Meaningful progress to reduce anthropogenic methane emis-
sions requires the ability to monitor sources for years to decades in a scalable manner.

2.1 Methane Emissions are a Large and Addressable Component of
Anthropogenic Climate Change
Methane is the second-most-abundant and important anthropogenic greenhouse
gas (GHG). Methane has a global warming potential nearly 30 times greater than that
of carbon dioxide on centennial timescales [45, Appendix 8.A]. Addressing anthropogenic
sources of methane is a central part of current approaches to address Earth’s changing
climate, including international pledges like the ones made at the 2021 Conference of
the Parties (COP26) conference in Glasgow.

Anthropogenic methane emissions account for half of all methane emissions to the
atmosphere. Methane atmospheric concentrations have been rising rapidly since
the start of the industrial revolution in the late 18th century, including recent years
[63]
     . Today, the concentration of methane is at its highest in the last 800,000 years, as
confirmed by comparison against relic methane trapped in air bubbles in ice cores
from the Greenland and Antarctic ice sheets [9]. In the last decade, anthropogenic emis-
sions represent more than half of all methane emissions [59] [9].

Decisive actions on methane emissions can have short- and long-term benefits. During
the early 2000s, when global atmospheric concentrations of methane temporarily
ceased increasing, researchers demonstrated that methane concentrations can respond
rapidly to reductions in emissions [63]. Methane’s high global warming potential and its
short atmospheric lifetime of roughly a decade [46] imply that reductions in methane emis-
sions should be included as part of an overall mitigation strategy to measurably reduce
temperature increases from anthropogenic GHGs [49]. Currently, methane is the largest
reason for departures from the idealized pathways to constraining global warming below
2°C discussed in the Intergovernmental Panel on Climate Change (IPCC)’s Fifth Assess-
ment Report (AR5) [63]. The more ambitious limit of 1.5°C requires reductions in methane
emissions by nearly 2% per year over the next 20 years, a target unfortunately contra-
vened by the current increases in emissions by approximately 0.5% per year [63].

APS & Optica | Monitoring Methane Emissions from Oil and Gas Operations                   3
2.2 The Methane Emissions from the Oil and Gas Industry Present a Significant Opportunity for Swift Action Oil and gas account for 30% of anthropogenic emissions in the U.S. Globally, the anthropogenic emissions of methane are contributed by three principal source cate- gories: agriculture and agricultural waste (approximately 59% of global human emis- sions), the production and transport of fossil fuels (33%), and biomass and biofuel combustion (8%) [9]. Increases in the last decade in methane concentrations appear to be equally contributed by the fossil-fuel sector and by a combined contribution from agricultural activity and waste sources [21] [33] [63]. Oil and gas emissions are localized, frequently intermittent, and dominated by a relatively small number of super-emitters. There is compelling evidence of a long- tail distribution of emission sources, indicating that methane emissions across the natu- ral gas (NG) supply chain are dominated by a relatively small number of super-emitters; in numerous instances 1–10% of potential sources contribute more than half the meth- ane emissions [77] [5] [80] [40]. The 2016–2018 California Methane Survey [20] [21] observed the same behavior across all methane point source emission sectors. These studies were spatially extensive and provided an indication of stochastic activity. However, they lacked the continuous, high-frequency sampling necessary to constrain the distribution of intermittent emission processes as well as diffuse area sources. These uncertainties and limitations pose barriers to providing relevant and timely information to guide mitigation efforts—with implications for state and local agencies, businesses, commu- nities, and NG ratepayers. Identifying and monitoring methane super-emitters can be an efficient way to enable mitigation efforts in the short term if individual sources can be identified to the relevant stakeholders in a timely fashion. 2.3 Flaring is an Important Contributor of Methane Emissions Flaring is the controlled burning of natural gas, a common practice in oil and gas explo- ration and production. The issue of flaring of natural gas (and other volatile compounds) is worth examining separately from other emission source types for several reasons. Flaring contributes up to one-fifth of methane emissions in oil and gas operations. Flaring produces atmospheric carbon dioxide (CO2) under complete combustion and methane from incomplete combustion. The combustion of CH4 to CO2 during flaring is supposed to operate at an efficiency of 97% or greater. While most flare efficiencies are in the high 90 percent range, the sheer volume of flared gas results in significant methane emissions. Moreover, observations suggest that many flares burn with
Flaring is poorly monitored. It is challenging to measure the amount of methane
combustion from flares, as well as the issue of flare burning efficiency. This has led
monitoring stakeholders to rely on self-reporting from producers. Moreover, the satel-
lite observations of flares available today are episodic: they only can take pictures of
the same site a few times per month. Discrepancies from these two available data sets
(self-reporting and satellite data) reflect the incomplete nature of both approaches.
An example is shown in Figure 1, where observations from the visible infrared imag-
ing radiometer suite (VIIRS) flown on the NASA/NOAA (National Oceanic and Atmo-
spheric Administration) Sumo National Partnership satellite are compared with
self-reported flaring data at two representative sites in the Texas Permian Basin.

 Figure 1. Monthly flare volumes for two representative sites in the Permian Basin for the three-
 year period from February 2018 to February 2021, as reported by satellite observations (blue
 triangles) [64] [24] [22] and by the state regulator based on self-reported data from the operator to
 the state regulating agency (red circles). The overall averages are marked with solid horizontal
 lines, using the same color code. For the right-hand site, the overall satellite flare volume is
 nearly twice the operator-reported volume, while the reverse is true for the left-hand site. The
 dashed lines are guides to the eye. There is considerable scatter in the data, and it would be
 helpful to have a finer mesh to explore the relationship of the relative measurements.

                         420                                                                          40
  Flare Volume, MMCF/month

                                                                                 Flare Volume, MMCF/day

                                                                                                      35
                         350
                                                                                                      30
                         280
                                                                                                      25

                         210                                                                          20

                                                                                                      15
                         140
                                                                                                      10
                             70
                                                                                                          5

                             0                                                                            0
                                  0   5   10   15     20     25   30   35   40                                0   5   10   15     20     25   30   35   40
                                                    Months                                                                      Months

Monitoring flaring volume is complementary to the imaging spectrometers
currently used by most methane monitoring missions. Satellites can observe flar-
ing with visible spectrometers during nighttime hours, providing a complementary
approach to daytime observations using other technologies.

Flaring is visible from space-based observations, providing a path to global
monitoring. Flaring is not just an issue of concern for the United States. On a global
scale, the U.S. ranks only fourth in comparison to satellite-observed flaring from other
countries, as shown in Figure 2. Satellites make global monitoring of flaring possible,

APS & Optica | Monitoring Methane Emissions from Oil and Gas Operations                                                                                      5
Figure 2. The top 10 countries by satellite-retrieved volume of flared gas, 2012–2020. The World
Bank [28] reports that Russia, Iraq, Iran, the United States, Algeria, Venezuela, and Nigeria remain
the top seven gas-flaring countries for nine years running. These seven countries produce 40%
of the world’s oil each year, but account for 65% of global gas flaring.
although this methodology still faces technical challenges due to large uncertainties
in the volumes of flared gas retrieved from satellite imagery. The need to complement
satellites with lower-cost ground-based networks to enable continuous monitoring of
methane is elaborated on in §7.1.
2.4 Our Current Ability to Monitor Methane Does Not Match Present Needs
Current bottom-up emission inventories systematically underestimate true
emissions. Regulatory agencies need accurate methane inventories before they can
determine if methane emissions have decreased. Multiple studies have identified
significant underestimation of methane emissions from the fossil-fuel sector reported
by greenhouse gas inventories for the U.S., California, and other domains [71] [54] [44]
[34] [35]
. For example, emissions in California are up to 1.8 times higher than invento-
ries constructed by the California Air Resources Board [71] [34]. To determine accurate
emissions and changes in these emissions, regulatory agencies must either take the
measurements themselves, employ outside contractors, or rely on sporadic peer-re-
viewed literature.
APS & Optica | Monitoring Methane Emissions from Oil and Gas Operations 6Methane’s global warming potential was recently demonstrated to be greater than previously thought. Recent studies have shown that the absorption of near-in- frared sunlight by methane augments its infrared greenhouse effect by 25% [27] [12], an effect omitted in all Assessment Reports (ARs) of the IPCC prior to the sixth AR, completed in 2021. According to climate models, methane further warms the climate by increasing its own residence time in the atmosphere; increasing the production of ozone and stratospheric water vapor, two other GHGs; and increasing the lifetimes of hydrochlorofluorocarbons and hydrofluorocarbons both of which are families of potent GHGs [46] [45] [50]. 2.5 Our Current Ability to Model Methane Does Not Match Present Needs Existing models do not agree on the causes for observed regional and global trends in methane concentrations. As stated by the team that constructed a global methane budget for 2000 to 2017 [59], to date no consensus has been reached in explaining the observed trends in atmospheric methane concentrations since 2007. Present-day simulations from state-of-the-art models also do not agree on emis- sions from the oil and natural gas sector. Estimates of annual emissions from this sector using global models constrained by observations are uncertain to roughly 25% worldwide. The spread between the 5th to 95th percentile estimates is 66% for the U.S., and the corresponding spread in the latitude band of 30–60oN that includes most of the heavily industrialized countries exceeds 40% [59 and sources therein]. The large range in these top-down estimates using methane models complicates interpretation of current and future observations as well as projections of methane reduction from possible mitigation measures. 2.6 Methane Emissions Impose a High Societal Cost The social cost of methane per metric ton far exceeds that of carbon dioxide. Policymakers use economic metrics to guide their decision-making process toward reducing greenhouse gas emissions. The Social Cost of Carbon (SCC), an estimate of the total future economic damage resulting from the present-day emission of one ton of CO2 into the atmosphere, is one such metric. Similarly, one can construct an analogous Social Cost of Methane. The social costs of CO2 and methane temporarily adopted by the Biden administration are $51 and $1,500 per ton, respectively, and, like global warming potential, are separated by a factor of roughly 30 on a 100-year timescale [4]. The SCC on a time horizon of 2050 is much smaller than that of meth- ane, ranging from $26 to $95 per metric ton [48]. It should be noted that these metrics have large uncertainties because social costs are inherently functions of a variety of societal factors, including socioeconomic projections, estimates of future benefits and costs, and discount rates relating present to future financial benefits. The fact that harms and costs are likely to be highly heterogeneous worldwide leads to even larger estimates of the social cost of methane for the United States than those used by the federal agencies [26]. APS & Optica | Monitoring Methane Emissions from Oil and Gas Operations 7
2.7 Lessons Learned from Observing Methane Emissions from Oil and Natural
Gas Operations are Transferable
It is worth noting that while we focus here on upstream oil and gas emissions, there
are other significant global sources of methane. Landfills and the agricultural sector
will be important to consider in the future, and both present a range of challenges
and opportunities for monitoring and mitigation. Agricultural methane emitters are
particularly diverse. They include diffuse sources, such as rice production or exten-
sive livestock husbandry, and intense point sources, such as feedlots, dairy farms, and
manure digesters. The observational approaches described in this report have clear
applications to agricultural and landfill point sources and super-emitters, and remote
sensing has been used to detect and quantify such emissions [21]. Other principles
articulated in the report are generally applicable to monitoring agricultural methane;
for example, the need for well-calibrated and precise yet deployable instruments, the
need for enhanced knowledge of methane spectroscopy for remote detection, and
the need for careful and systematic observations tuned to the emitter characteris-
tics of the sector. Therefore, while some outcomes of this report are quite specific to
the energy sector, there is considerable potential for application in other important
sectors as well.

III. Current Capabilities for Measuring Methane
Emissions
3.1 Brief History of Methane Monitoring Technology
The U.S. Environmental Protection Agency (EPA) has published a GHG inventory, which
includes a methane inventory, each year since the 1990s [25] under the United Nations
Framework Convention for Climate Change (UNFCCC).

Commercial instrumentation for the measurement of methane improved significantly
during the 2000s. Current in situ instrumentation for measuring methane is borrowed
from the success of the telecommunications industry. With advancements in near- and
mid-infrared lasers [72], by the mid-2000s this technology led to commercialized instru-
ments using integrated-cavity-output spectroscopy (ICOS) [52] [3], cavity ring-down spec-
troscopy (CRDS) [51] [16], and other multi-pass absorption techniques [76]. These instru-
ments significantly improved quantitative measurement of atmospheric methane
concentration, both in intensity and in geographical location with high spatial resolu-
tion. The instruments were easily installed aboard aircraft and flown to oil- and gas-pro-
ducing regions of the U.S., where the mass balance technique was used to quantify
emissions [73]. These advances led to measurements during the 2010s [38] [55] that made
evident the disparity between the methane inventory maintained by the EPA and
measured methane emissions. However, although those flights cover large geograph-
ical areas, they only collect measurements at short, specific times during the day and
can miss intermittent methane sources.

APS & Optica | Monitoring Methane Emissions from Oil and Gas Operations                 8
Additional studies and a decade of quantification in the 2010s of oil and gas methane
emissions from the component level up to regional scale have shown that oil and gas
companies are losing a valuable commodity to the atmosphere, that there are signif-
icant discrepancies between methane inventory estimates and actual methane emis-
sions, and that the distribution of the leaks have a “fat tail,” i.e., a handful of large leaks
at the high end of the distribution contribute a significant fraction of the total emitted
methane (as shown in Figure 3).

3.2 Challenges Facing Effective Methane Monitoring
Methane monitoring technologies for oil and gas operations must be tailored to the
needs of the industry and the public regulators. The following topics are critical to
consider for a successful adoption of monitoring technologies and systems.

Methane emissions in oil and gas operations are dominated by a relatively small
number of super-emitters. Methane emissions from oil and gas operations originate
from many different sources of various sizes. The amount of methane released in the
atmosphere is most commonly measured in kilograms per hour (kg/hr), with the follow-
ing somewhat arbitrary definitions [78] [21]:

• Small leaks: 30 kg/hr

Many studies of methane emissions in oil and gas operations have shown that a few
emitters are the source of a large quantity of methane released into the atmosphere.
Figure 3 shows a summary of existing literature results on the cumulative emission of
methane as a function of size of the source (often, leaks). It shows that large leaks, often
referred to as super-emitters, are the source of 60% to 80% of all methane emissions
in important oil and natural gas production regions. For example, in the Permian Basin
of West Texas and New Mexico, super-emitters associated with just 37 plumes in a
30,000-square-kilometer area contribute between one-third and one-half of the esti-
mated emissions [32]. One must be careful when interpreting the data as, in some stud-
ies, observed “super-emitters” correspond to complete facilities where the emission is
likely made up of contributions from many sources. However, even studies that have
focused on individual components find a similar distribution, as seen in the orange
curve of Figure 3. Based on the component data, targeting leaks greater than 30 kg/hr
for repair would reduce emissions by ~70–90% while keeping the number of leaks at
an actionable level for industry.

Oil and gas operations operate in low density, over very large areas. Any monitor-
ing approach needs to be scalable in cost and operation to go from a single well to a
large basin area. This makes field-of-view and spatial resolution key parameters to
consider in order to detect and attribute a leak to a specific site or component.

APS & Optica | Monitoring Methane Emissions from Oil and Gas Operations                      9
Figure 3. Component and facility emissions and measurement detection threshold. Magnitude of
 oilfield methane emissions is plotted vs. the cumulative emission, i.e., the fractional contribution
 of all leaks of a given size or larger. Four distributions of emissions are plotted from published
 studies representing Barnett emissions in 2013 (red trace) [78 Figure 2c], a compilation of published
 emissions between 2011 and 2016 (component-level: yellow trace [6, Figure 5]; all sources: purple
 trace [6, Worksheet S1]), and Permian emissions in late 2019 (blue trace) [18, Figure 2B]. Also plotted is a
 scaled distribution of the Permian emissions (green dashed trace) to approximately correct
 for the higher detection limit of the Cusworth et al. method, which may not fully account for
 medium-sized leaks. For comparison, approximate detection limits for satellite-, aircraft-, and
 ground-based emission quantification are shown. Where the detection limit lines cross the
 emission distribution traces indicates the fraction each method can detect of the total emission.
 We note that some of these studies occurred several years ago and may not reflect emissions
 under current regulatory or infrastructure regimes.

   * The aircraft detection limit is for LIDAR at wind speeds
It is standard practice that oil and gas emission monitoring is performed by
personnel from local industry or local regulating agencies. Any monitoring
approach needs to be available to, and usable by, personnel currently on the ground.
Although collected information on leaks is currently proprietary and not readily shared
with all stakeholders, it should be quantitative, location-specific, and timely to integrate
effectively into industry LDAR.

Methane fugitive emissions from the oil and gas sector are episodic in nature.
Leaks can start at any point and vary in their leak rate significantly over the course
of hours or even minutes. Any robust monitoring approach cannot rely on flybys and
noncontinuous monitoring.

Accurate methane source apportionment is critical for LDAR and emissions inven-
tories. Observing platforms with adequate spatial resolution and field-of-view can
identify the physical origin of methane releases. Chemical approaches that measure
the abundance of carbon isotopes (e.g., 13C) [15] or other species (e.g., ethane) can be
employed to disentangle emissions from oil and gas production sites from those orig-
inated at other nearby sources, such as, for example, agricultural lands [39].

The current understanding of the methane absorption spectrum is incomplete. The
ICOS, CRDS, and multi-pass absorption techniques, typically used for in situ measure-
ments, have avoided this issue by focusing on a single absorption feature, allowing for
high-precision measurements. As for remote sensing, our lack of knowledge of meth-
ane’s absorption features, and hence some of the uncertainties in our calculations of
methane shortwave forcing, is due to the remarkable complexity of methane spectros-
copy [7]. Its current derivation from laboratory measurements and theory is known to be
deficient [7] [11] [19]. This limits the sensitivity of spectroscopy techniques, which are the main
airborne and spaceborne methane-sensing methodologies.

Based on current technology, global fugitive emissions of methane cannot be moni-
tored effectively with a single observing platform. As illustrated by Figures 3 and 4,
different platforms (space-based, airborne, ground-based) have different sensitivities to
the leak rate of methane emissions. Furthermore, the different platforms also offer differ-
ent fields-of-view, different spatial resolution, local versus global coverage, and different
time resolutions. A tiered approach combining multiple types of sensors and platforms
is necessary to both provide the information necessary to mitigate leaks locally (in partic-
ular the super-emitters) and understand global emissions.

3.3 Importance of Transparency in Monitoring
Private companies have a financial incentive to reduce methane emissions from oil
and gas operations. However, public interest and private interest may not be perfectly
aligned. There is little incentive for companies of any size to share methane emission
information with competitors or the public. At the same time, there are significant
advantages to this data being publicly available. For example, the industry’s under-
standing of fugitive emissions is evolving as scrutiny by stakeholders and monitor-
ing technologies improve and provide more insight. Requiring companies to share

APS & Optica | Monitoring Methane Emissions from Oil and Gas Operations                        11
information on LDAR responses (currently proprietary) could greatly accelerate the
industry-wide understanding of best practices regarding leak mitigation.

Similarly, public trust in the oil and gas industry and the ability of public institutions
to regulate the sector should be a high priority. For greenhouse gas emission regu-
lation to be effective, data should be validated, be publicly available, and have high
enough spatial resolution to determine the source of the emissions, especially in
regions where well pads owned by different companies may be as close as 50 meters
(m) apart. Although ground- and aircraft-based measurement techniques are effective
ways to monitor and quantify emissions within the United States, they are predicated
on access to either the ground or airspace. If binding international accords were ever to
be implemented, satellite measurements may be an invaluable method for verification,
even given their limited sensitivity and intermittent observation times as compared to
ground and aircraft measurements as discussed/highlighted in Section IV.

IV. Current State and Future Directions of Methane LDAR
Fully understanding methane emission sources and location at oil and natural gas sites
in a production basin is a nontrivial problem. On top of the complexity and physical
distribution (covering very large areas of land) of the methane sources, the episodic
nature of the emissions requires 24/7 sensing and monitoring. It is critical to catch
super-emitters that are responsible for large fractions of the emissions from drilling
sites as fast as possible to guide LDAR efforts.

Effective national or global continuous monitoring cannot rely on a single technology.
Instead, it is necessary to use a combination of ground, aircraft, and satellite platforms
that together can allow the rapid detection of fugitive methane emissions.

4.1 Critical Parameters for Methane LDAR
While there are numerous approaches for methane LDAR, effective detection methods
should share the following qualities:

• Full or partial autonomy: One of the biggest cost drivers in conventional moni-
  toring—often based on optical gas imaging (OGI) cameras—is the need for an
  inspector to drive to each well. The U.S. alone has over 1 million active wells, most
  in remote locations. Sending a ground crew to each site is unscalable.

• Low or zero false positive rate: The background concentrations of methane at an
  oil and gas production site can vary significantly and rapidly. Sensors will need to
  identify leaks while rejecting these background fluctuations. The cost of a false posi-
  tive resulting in sending a LDAR crew to a remote site is a deterrent for industry.

• Leak quantification: As noted in Figure 3, most emissions come from only a small
  percentage of leaks. Conversely, if a production company is repairing all leaks, it
  is spending most of its resources addressing a negligible fraction of the problem.
  Systems that allow rapid prioritization of large leaks will greatly improve efficiency.

APS & Optica | Monitoring Methane Emissions from Oil and Gas Operations                12
• Leak localization: Oil and gas systems are complex. Once a leak is detected,
LDAR crews will still likely have to search for the exact leak location. Localizing the
leak to within a few meters will decrease search time and may limit the need for
expensive OGI cameras.
• Continuous monitoring and low latency: Natural gas leaks can be highly
episodic in nature and may last only days or hours. Infrequent monitoring can
easily miss even very large leaks. Significant latency in identifying these leaks
could lead an LDAR crew to mistakenly assume a false positive.
• Oil patch integration: While this is not strictly speaking a sensor quality, it bears
mentioning that industry management and LDAR teams will be critical to any large-
scale leak mitigation. A successful sensor will be far more effective in its purpose if
the data are easily digestible and integrate with existing industry workflow. More-
over, tight integration with industry will be necessary to differentiate standard
process emissions, to speed leak repair of fugitive emissions, and to spur devel-
opment of better industry practices.
Table 1 lists attributes of common sensing modalities and Figure 4 shows the detec-
tion limits of each type of LDAR method, compared to the measured emission rates
from various components of natural gas production in the Barnett Shale region of
Texas [78]. The following sections will further detail the measurement capabilities and
use cases.
Table 1. Key attributes of common sensing modalities (ground-based, airborne, and spaceborne).
Key Attributes
Autonomous
Continuous
Component-Scale/
Leak Quantification Component Scale Facility-Scale
Pad-Scale
25 Meters –
Leak Localization 1 – 10 Meters 1 – 50 Meters
7 Kilometers
Cost $–$$ $$–$$$ $$$$
APS & Optica | Monitoring Methane Emissions from Oil and Gas Operations 13Figure 4. Component emissions and measurement detection threshold. Single-source methane emissions are plotted for various components of natural gas production in the Barnett Shale region of Texas [78]. The average emissions are shown with red bars; the maximum expected emissions are shown with blue bars. Overlaid are the detection limits for emissions using ground-, airborne-, and satellite-based technologies. Note the breaks in the scale of the y-axis. Detection limits are determined from peer-reviewed literature for ground-based [1], airborne [2] [61] [37] and spaceborne [36] emission detection. * Note that the spaceborne detection limit shown here is based on predicted capabilities of next generation GHGSat systems. The current detection limit demonstrated in practice is 500 kg/hr [32]. 4.2 Automated Ground-Based Monitoring The most sensitive way to detect fugitive methane emissions from oil and gas sites is at ground level. Ground-based platforms are capable of high spatial resolution, 24/7 operation, and electronic data transmission to mobile or stationary receivers. The cost of ground-based detection arrays has dropped, and large-scale trials in both indus- try and academia are beginning [56]. Ground-based monitoring is likely the only solu- tion for truly continuous monitoring of infrastructure. The sensitivity of ground systems easily exceeds monitoring needs, and sub-pad localization of leaks is often possible. While these systems do have installation costs, the associated sensors are also easier to make autonomous, and it is likely that in the future, operating costs will be competitive. An example of ground-based monitoring is illustrated in Figure 5. APS & Optica | Monitoring Methane Emissions from Oil and Gas Operations 14
Figure 5. Example of the standoff ground-based emissions monitoring approach (image provided
 by LongPath Technologies). A single laser spectrometer sequentially measures along several
 kilometer-scale beam paths to look for leaks in an oil and gas region. Cost reduction is achieved by
 the fact that a single system can sensitively monitor many assets in a 1- to 2-mile radius [1].

Ground sensor design and measurement approaches vary greatly. At one extreme are
low-cost chemical point sensors which are prone to drift and have limited sensitivity, but
this can be overcome by employing dense networks of these devices around possible
sources. Laser-based detection systems are generally more expensive per device, but
also more stable and sensitive, allowing them to be deployed in smaller numbers for the
same coverage. An extreme example is shown in Figure 5, where a single laser system
can monitor assets in a 2-mile radius. It is not clear yet which approach would operate at
a lower cost per well in the long term, but all seem to be garnering industry interest.

In combination with measurements of local wind data and an atmospheric transport
model, these ground-based instruments can give a good estimation of both leak size
and location. Evaluations at the Methane Emissions Technology Evaluation Center
(METEC) have shown that these systems can reliably detect small leaks and identify
leak location within 1–5 m (3–15 feet) [1] [70] [79].

4.3 Airborne Monitoring
Airborne sensing for leak detection has recently garnered considerable attention. An
instrumented aircraft can be deployed relatively quickly (within days to weeks) with
modest cost, and can achieve better sensitivity than satellite measurements. While
not autonomous, a single aircraft can observe many wells in a short period of time

APS & Optica | Monitoring Methane Emissions from Oil and Gas Operations                                 15
and can enable more frequent revisit times. However, as with satellites, they repre-
sent a single “snapshot in time” for each well that limits the detection of intermittent
emissions. Low-flying drones, helicopters, and planes have illuminated a great deal
of information about methane releases through measurements of methane plumes
in oil and natural gas production regions, especially those not easily accessible by
ground-based sensors.

Currently, three main airborne sampling approaches are widely used:

• Mass balance measurements, where an instrumented aircraft records methane
  concentrations as it flies through a plume. Flight patterns and local meteorology
  are combined with the data to determine an emission rate and location. The mass
  balance approach is attractive in its ability to identify local small leaks as well as
  recover facility-scale leak rates [60]. Such measurements informed much of the early
  understanding of methane emissions. The downside of this approach stems from
  the fact that the aircraft must pass through the emission plumes, requiring low-alti-
  tude flights as well as the right meteorological conditions to loft the plume. Night-
  time and cold weather operation is often difficult or impossible. Leak location at the
  sub-pad level is also impractical, though it may be possible with unmanned aerial
  systems (UAS).

• Airborne imaging spectrometers use reflected sunlight to measure a column-inte-
  grated methane concentration. Much like similar satellite instruments, this provides
  a top-down view of the emission plume, with the additional advantage that the
  airplane is much closer to the plume than a satellite. This relative proximity allows
  for greater sensitivity and higher spatial resolution. Compared to mass balance,
  this approach relaxes the constraints on meteorology and can be performed at
  higher flight altitudes. The sensitivity is lower, however, at around 10 kg/hr [66] [60].
  This approach was recently shown to enable repeated, high-resolution mapping
  of large areas with large methane emission sources. Including an example where a
  campaign detected 3,067 plumes of methane above the 10 kg/hr detection limit in
  a 50,000 kilometers-squared (km2) area [17] [10]. Spatial resolution is also often on the
  order of 3–10 m (10–30 feet). Sub-pad leak localization is possible at the low end of
  this range but is difficult at 10 m.

• Light detection and ranging (LIDAR) is the most recent emerging technology in
  methane detection. Like imaging spectrometers, LIDAR provides a bird’s-eye view
  of an emission source (Figure 6). Methane absorbs in an eye-safe wavelength of 1.65
  microns, greatly relaxing eye safety concerns that can be a problem at other wave-
  lengths for LIDAR. LIDAR systems have detection sensitivities similar to mass balance
  approaches (1–3 kg/hr, depending on wind speed) and very fine ~1 m spatial reso-
  lution. This high spatial resolution allows precise leak location [37] [57], though this
  does come at the cost of a narrower viewing swath (100 m) and may require more
  complex aircraft flight patterns. Additionally, these systems can be used from higher
  flight altitudes, like the imaging spectrometer. At the same time, they are not reliant
  on sunlight, which allows for their operation at night or days with high clouds.

APS & Optica | Monitoring Methane Emissions from Oil and Gas Operations                16
Figure 6. Example leak detected from an airborne gas mapping LIDAR system provided by
 Bridger Photonics. High spatial resolution and overlaid aerial photography greatly simplify the
 process of identifying the leak source [37].

• Autonomous systems: Virtually all the methane detection technologies employed
  by aircraft are also being considered for UAS. The potential advantages are obvious.
  Such systems could in principle fly much closer to facilities, offering improved sensi-
  tivity to leaks and improved spatial resolution for leak location. Additionally, UASs
  are often envisioned as being fully autonomous, flying pre-programmed inspection
  routes and alleviating the expense of a pilot.

  Unfortunately, there are also significant hurdles faced by this technology that make
  it hard to know when it will be practical. On the technological side, UAS platforms
  often struggle with limited battery lifetime, greatly limiting range and up-time, which
  in turn impacts the economics of this approach. Regulation is also a challenge. In
  much of the U.S. these systems cannot operate autonomously and must be flown by
  a qualified pilot with line-of-sight to the aircraft, further impacting the costs. There
  are also some practical concerns. A UAS flying close to oil and gas infrastructure
  would likely have to meet strict safety criteria such as not producing sparks, even
  in the event of a crash. Lastly, most upstream oil and gas infrastructure is in remote

APS & Optica | Monitoring Methane Emissions from Oil and Gas Operations                            17
areas where the security of an unattended and inherently visible UAS system is a
   potential concern.

4.4 Spaceborne Monitoring
Spaceborne methane monitoring is an active and growing field. There are two relevant
spaceborne methods for monitoring methane emissions from oil and gas operations: 1)
infrared imaging spectrometers for direct measurement of methane through its distinct
absorption of specific electromagnetic frequencies, and 2) visible and infrared imaging
of flaring at night. For flaring observations, the principal instrument of interest is the VIIRS
visible infrared imaging radiometer suite. As discussed in Section II, there are challenges
associated with flaring retrievals, but these measurements do provide a global picture of
flaring, which would be challenging to collect by other means. The PRISMA satellite has
also been used to simultaneously retrieve carbon dioxide and methane concentrations,
which is an interesting new approach allowing one to derive emissions and quantify the
combustion efficiency of the flared blowout [18].

There is an increasing abundance of direct measurements of methane using imag-
ing spectrometers as well. Satellites such as GOSAT, GOSAT-2, TROPOMI, and SCIA-
MACHY [65] [79] [8] paved the way for satellite remote sensing of methane, but in general,
these satellites provide too coarse a picture for monitoring individual wells. TROPOMI,
for instance, provides column atmospheric methane measurements with 7 km × 7 km
spatial resolution but near-daily global coverage with its large 2,600-km-wide swath
[79]
    . This is well suited for understanding regional methane emissions but poorly suited
for resolving 10 m × 10 m well pads. Near-term follow-ons to GOSAT and TROPOMI
satellites as well as the new Copernicus Carbon Dioxide Monitoring (CO2-M) and
MERLIN will offer further enhancements but not well pad imagery. CO2-M, for instance,
is expected to reach an image resolution of 2 km × 2 km. MERLIN, a satellite-based
LIDAR instrument, is expected to have a minimum image resolution of 150 m × 150 m
but a 28-day revisit time.

Where the picture starts to get interesting for leak detection is with a handful of
private-sector missions. In 2016, a privately funded satellite, GHGSat, was launched
with the purpose of monitoring methane emissions from space [36]. The imaging spec-
trometer aboard this satellite measures backscattered solar radiation with a high spec-
tral resolution (0.1 nanometers [nm] at 1650 nm) and with a spatial resolution of 50 ×
50 m2 in a 12 km × 12 km region. Oil and gas emissions were one of the key targets
of this satellite. Similarly, the DigitalGlobe land imaging satellite WorldView-3 was
recently shown to be sensitive to methane plumes from oil and gas [58], as was the Euro-
pean Sentinel-2 satellite [23], both at high spatial resolution. The ability to observe emis-
sions from these land imaging satellites is particularly exciting since they are often well
funded and widely deployed, helping ensure the long-term availability of this data.

The challenges for oil and gas monitoring with satellites. Observing the world from
space has obvious advantages for identifying global emission irrespective of borders.
However, there are also downsides to observing sources from several hundred kilome-

APS & Optica | Monitoring Methane Emissions from Oil and Gas Operations                     18
ters away. First, the sensitivity of these systems is much poorer than aircraft and ground systems, which limits them to detecting only large and super-emitter sources (30%– 50% of emissions, as illustrated in Figure 3). Second, satellites provide a single snap- shot in time and long delays between overpasses, making it hard to locate intermittent sources. The problem is worsened by the fact that the imaging spectrometers require clear sky and may be frequently blocked by clouds in certain parts of the world. On the plus side, there seems to be some commercial appetite for deploying constellations of these systems, which should relax the revisit time concerns. The ability to fold in land imager data will further help in this regard. Global monitoring challenges for satellites. Understanding the global and regional methane concentration is also desirable with satellite systems, though the accuracy requirements are challenging. Typically, one would track methane changes at the 0.1% level (2 ppb), but intercomparisons between satellites looking at CO2 (for which the spectroscopy is better understood than methane) show variations on the 1% level [41]. Better calibrations of these systems will be needed as we seek to track smaller changes in methane. 4.5 Understanding Both the Well Pad and the Global Picture While we focus heavily on observing and mitigating oil and natural gas infrastructure emissions, it is worth noting that there are two separate questions that we need to address to solve this problem. Specifically, there is the little picture (e.g., is a given well pad leaking?) and the big picture (e.g., is a given basin/region/nation improving?). The little picture addresses the immediate problem of leaking infrastructure, but the big picture is also critical in identifying missed sources and understanding climate impact. As such, it may be helpful to consider how different technologies address both pictures and how such systems can be combined. • Satellite systems can uniquely monitor the global picture. Methane is a global problem, and verification will necessarily transcend national boundaries. Satellites would be a critical piece to any “trust but verify” approach to international meth- ane emission reduction. Additionally, different satellites observe at different length scales. A tiered approach combining measurements from multiple satellites will allow both global identification of super-emitters and observation of regional meth- ane enhancements. • Airborne monitoring offers a relatively sensitive means to detect leaks over a broad region, though it is also a snapshot in time. While aircraft and pilots drive up the cost, this is balanced by the fact that aircraft are a very versatile measurement approach. These systems work well to fill gaps in ground systems or for large-scale verification of ground-based deployments. Additionally, their low cost of redeployment makes them ideal for rapidly addressing new monitoring challenges as they come up. Lastly, aircraft can be instrumented to measure regional emissions with high accuracy. • Ground-based monitoring currently offers the only option for truly autonomous, continuous monitoring that can provide rapid feedback to industry partners. They APS & Optica | Monitoring Methane Emissions from Oil and Gas Operations 19
are well suited for monitoring upstream oil and natural gas (O/NG) infrastructure.
  However, while ground-based sensors are sensitive, they are necessarily tuned to
  the specific asset they monitor and tend to “tune out” the surrounding environ-
  ment. These systems will likely be less useful in understanding the regional picture.
  While not discussed here, there also exists an important array of ground-based
  sensors (e.g., The Total Carbon Column Observing Network (TCCON) [75]) tuned
  specifically to the regional and global methane picture. These sensors provide
  critical long-term accuracy, allowing observation of multi-year trends and also cali-
  brating many satellite missions.

V. Summary of Identified Needs
Sections II through IV uncover several areas of need in the monitoring of methane
emissions from oil and gas operations. A number of policy-related and physics- and
optics-based research needs are summarized here, and recommendations to address
them are presented in sections VI and VII.

Research needs:

1. Improved high-resolution spectroscopic databases to support methane sens-
   ing. Both passive and active remote sensing of methane are reliant on accurate,
   laboratory-validated databases of near-infrared methane absorption lines, which
   are currently incomplete (§3.2).

2. Sensors for remote sensing and in situ measurement of carbon isotopes and
   remote sensing of ethane. The ability to measure methane isotopes and ethane,
   especially from satellite-borne instrumentation, would help differentiate between
   fossil-fuel-derived and biogenic emissions of methane, thereby reducing the risk
   of “false positive” attributions to nonnatural sources (§3.2 and §4.1).

3. High-quantum efficiency photodetectors to support methane LIDAR and oth-
   er methane detection technologies. LIDAR systems are preferable for measur-
   ing lateral transects and vertical profiles of methane. Such detectors could greatly
   reduce the cost and size of these systems, and would help close gaps between
   satellite, airborne, and ground-based observational platforms (§3.2 and §4.3).

Policy-related needs:

1. Currently, many state and federal regulatory agencies lack adequate and
   appropriate methane measurement capabilities. Existing inventories of O/NG
   emissions developed by state and federal regulatory agencies systematically un-
   derestimate emissions because they fail to capture the distribution of sources that
   includes super-emitters. Robust studies have consistently found that state and fed-
   eral bottom-up methane emissions inventories routinely and appreciably under-
   estimate real emissions by a factor of 1.6 or more (§2.4).

APS & Optica | Monitoring Methane Emissions from Oil and Gas Operations             20
You can also read