A remote sensing based evaluation of channel morphological characteristics of part of lower river Niger, Nigeria - Springer Link
←
→
Page content transcription
If your browser does not render page correctly, please read the page content below
Research Article

A remote sensing‑based evaluation of channel morphological
characteristics of part of lower river Niger, Nigeria
M. O. Ibitoye1

Received: 1 May 2020 / Accepted: 14 January 2021 / Published online: 17 February 2021
© The Author(s) 2021  OPEN

Abstract
River bank erosion, accretion and lateral channel migration are important geomorphological processes, which attract
a great deal of attention of river engineering scientists in many parts of the world. The present study assesses the
morphological characteristics of parts of the lower section of River Niger, where field data are scarce and difficult to
access for security and cost implications. Multi-date (1990, 2002 and 2017) Landsat imageries were used for the study,
the imageries were corrected for geometric and radiometric errors, classified and analysed for changes in major land
cover classes within the river channel, to assess river planform, riverbank pattern, channel width, bankline migration
and centreline using ArcGIS software. The results revealed a decrease in water body and riparian vegetation by 27.64%
and 9.77%, respectively, between 1990 and 2017. Sediment yield, however, increased by 75.61%. In addition, the river
channel exhibited significant spatial changes within the study period; centreline at left flange shifted eastwards by about
1347.3 m at the upper section but westward at the lower section by 123.1 m. The bankline shifted prominently eastwards
at right flange and westwards at the right flange. The study concluded that the studied channel had actually undergone
some critical morphological changes greatly affected by erosion and accretion processes that are easily captured with
remote sensed imageries.

Keywords Remote sensing · Niger River · Morphology · Channel planform · Bankline

1 Introduction                                                              in river channel system [4, 5]. Changes in river channel may
                                                                            be slow and progressive or rapid in a sense of geologic
River morphology refers to the field of science that deals                  time, due to natural and anthropogenic influences [7, 8].
with changes of river planform and cross section due to                     Given increasing human activity affecting river basins, at
sedimentation and erosion processes [1–3]. Every river                      global scale, studies of channel morphology have inter-
channel has its own unique characteristics, but variation                   ested relevant spatial scientists [8–10]. Urbanization, graz-
in river channel morphology is a result of an expansive                     ing and faming activities have impacted severely on river
range of hydrological conditions, sediment characteristics                  basins, causing instability in river channels, and conse-
and geologic histories of the river [4]. The continuous flu-                quently threatening livelihoods within river basins [7–11].
vial processes of erosion and sedimentation patterns have                       Over the years, the downstream morphology of River
reportedly reduced the capacity of river to contain incom-                  Niger has been a subject of great concern to environmen-
ing flow from the upstream, under different conditions [3,                  talists and vulnerable residents in the basin. River Niger
5, 6]. Consequently, sedimentation and degradation are                      plays an important role in water transportation, supply,
enhanced in river beds causing alteration and instability                   and it is a backbone for wet and dry season faming in the

* M. O. Ibitoye, moibitoye@futa.edu.ng; geomattim@gmail.com | 1Department of Remote Sensing and Geoscience Information System
(GIS), Federal University of Technology, Akure, Nigeria.

        SN Applied Sciences (2021) 3:340 | https://doi.org/10.1007/s42452-021-04215-1

                                                                                                                         Vol.:(0123456789)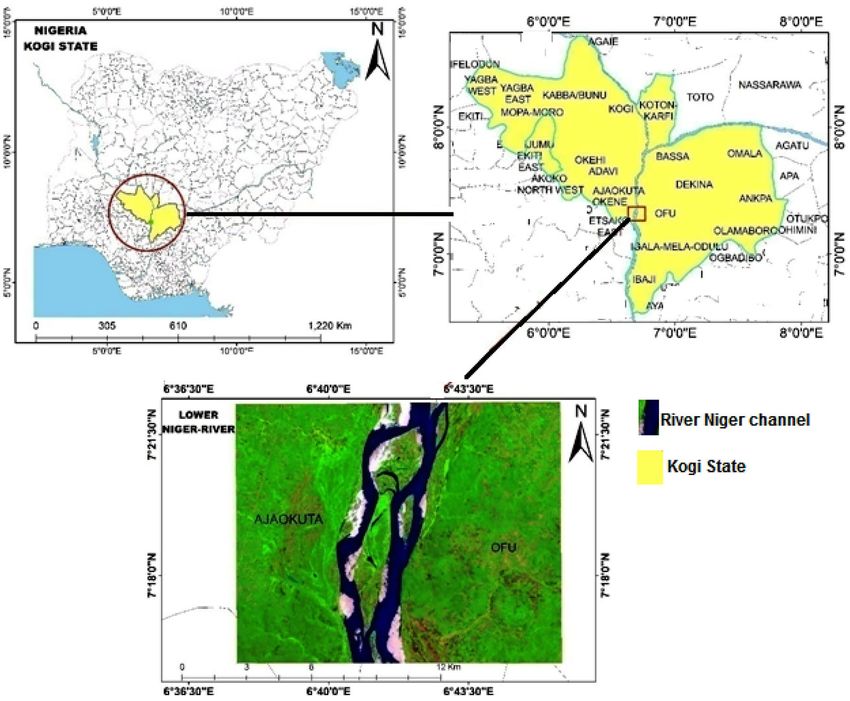
Research Article SN Applied Sciences (2021) 3:340 | https://doi.org/10.1007/s42452-021-04215-1
area [12]. The Niger River basin is so important that the improved information for planning purpose. Application
Nigerian government in 1999 under the Petroleum Trust of the techniques in this study will therefore project a
Fund directed an Ecological endowment for the dredg- template for more studies, especially given the fact that
ing of 573 km distance (00 m width by 2.5 m depth) of the imageries are mostly free and accessible to most
its lower section, while a number of inland ports (such as researchers, and that software for geographical informa-
Idah, Lokoja, Baro and Onitsha) along the river bank were tion analysis are available in both proprietary (e.g. ArcGIS,
targeted for improvement [13]. The river channel has been IDRIS and MATLAB) and open-source (e.g. QGIS and Scilab)
severely impacted by sedimentation, which has reduced types. Consequently, specific objectives of this study are
its carrying capacity and created many channel planforms. to evaluate selected morphological characteristics of part
Morphological analysis of river streams is required for of lower Niger River from multi-date satellite imageries.
planning purposes for both disaster preventive and pre- Results from the study will provide decision-support infor-
dictive measures, including ensuring navigation safety and mation to relevant governmental and non-governmental
appropriate allocation of intake structures and scour cal- agencies as well as relevant individuals that are concerned
culations at bridges. It also plays an important role in the with blue economy development agenda of the United
basin delineation and planning for sustainable manage- Nations Sustainable Development Goals (SDG 14) [24, 25].
ment [14]. In the field of fluvial geomorphology, river chan-
nels are typically studied with measurements of widths
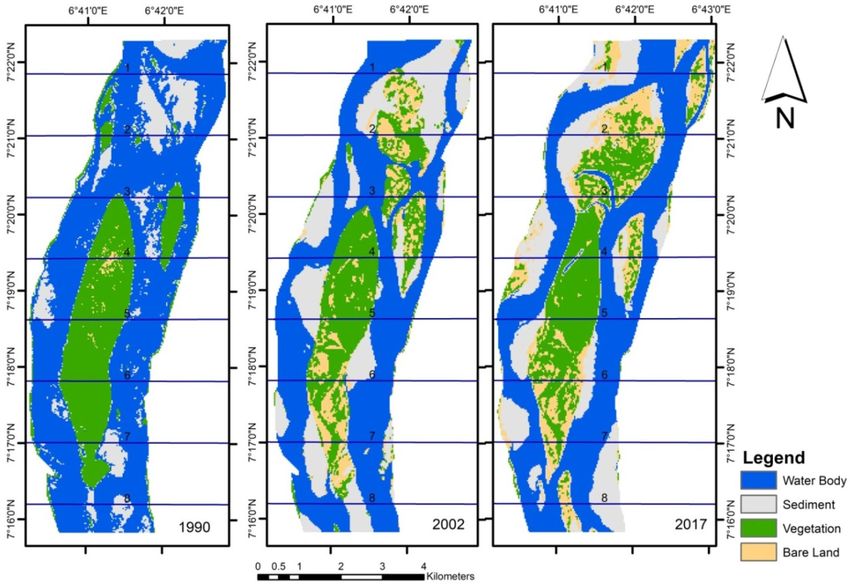
and water volume, both variables that are dynamic (vary 2 Study area
temporally) but which are difficult to measure without
appropriate field and safety equipment [1, 4]. On the other River Niger is the third longest river in Africa, after the
hand, the study area (River Niger channel) being an impor- Nile and the Congo [26], covering 4,180 km. The river
tant component of the drainage system in Nigeria and flows from its origin in the Fouta Djallon highlands in
West Africa [4, 12, 15] deserves studying in some details Guinea through Mali, Niger, Benin Republic before reach-
to enhance river basin management in the region. There is, ing Nigeria [27]. The portion earmarked for the study is
however, little or no coordinated study of the morphologi- the lower part of the river, below the confluence of rivers
cal characteristics of River Niger and many other rivers in Niger and Benue where erosion and deposition processes
Nigeria, except those of Jeje and Ikeazota [16], and Fashae are obvious and regarded as problem in terms of flood-
and Faniran [4] on Ekulu and Ogun rivers in East and West- ing occurrence and inability to serve as an economic hub
ern Nigeria, respectively. These studies are too few, and of the government and local communities along the river
their conclusions may not be generalized to a larger river channel. The study area covers a distance of about 11.5 km
like Niger, whose influence is beyond Nigeria, since it flows (Fig. 1). This portion of the river channel forms the bound-
through some other West African countries. In addition, ary between Ajaokuta and Ofu Local Government Areas,
given the improvement in computer and spatial systems Kogi State. Major towns and villages around the channel
that has resonated the importance of remote sensing as are Ajaokuta town, Okene, Egayin Ogwoawo, Gbake and
a sound complement in environmental analysis, the pre- Okpo and Okokenvi villages located at the left and right of
sent study is privileged over the previous studies that have the river bank, respectively. The river is a major source of
involved a limited use of the technology in their studies. economic activities for inhabitants across the river banks
Also, there have been cases of persistent flood with severe and a natural habitat for aquatic animals. River Niger is
impact on communities around the Niger basin, and a a source of water for irrigation, and water supply, power
study as this will provide decision-support information production for both industrial and community uses and
for environmental planning in the area. water transportation; it also has many fishing points for
The use of remote sensing-based decision-support surrounding communities.
information is an improvement over the essentially local-
ized and strictly equipment-based assessment of river
channel conditions [17, 18]. Remote sensing and geo- 3 Materials and methods
graphical information system (GIS) are evolving in Nigeria
and other African countries, and they have been found Secondary data such as multi-temporal Landsat image-
to be very useful for hydrological and geomorphological ries of 30 m resolution obtained from the United States
studies [8, 19, 20]. Several authors including [3, 8, 21–23] Geological Survey (USGS) Agency (https: //www.usgs.
have applied the techniques in parts of River Nile, Qingji- gov/) were used. The data which include Landsat 5 TM
ang River basin in China, Brahmaputra–Jamuna River, (1990), Landsat 7 ETM + (2002) and Landsat 8 (OLI) (2017)
Bangladesh, and in many other countries of the world, the were images corresponding to the dry season of the year
techniques found to be reliable and capable to providing (January and December). The dry season image data for
Vol:.(1234567890)
SN Applied Sciences (2021) 3:340 | https://doi.org/10.1007/s42452-021-04215-1                                   Research Article

Fig. 1  Map of the study area

                                                                     the administrative map was obtained from the office of
Table 1  Description of the secondary data used
                                                                     the Surveyor-General of the Federation of Nigeria.
Image              Resolution   Date of acquisi-   K/J scene path/
                                tion               row               3.1 Image processing and classification
Landsat 5          30 m         01/01/1990         189/55
Landsat7 ETM +     30 m         12/01/2002         189/55            The Landsat images used for the research were restricted
Landsat 8 OLI      30 m         12/12/2017         189/55            to study area only and in that instance; the image files
Administrative     –            2017               –
 map
                                                                     were reduced and extraneous data in the file were not only
                                                                     eliminated, but speeds up processing due to the smaller
                                                                     amount of data to process. Band combinations adopted
                                                                     for the false composite images were 5, 4 and 3 and were
the three years (1990, 2002 and 2017) were adopted                   used in the identification of the features of interest. The
as a result of the assurance that such data will be free             choice of these combinations was as a result of the impor-
of cloud cover and also to avoid seasonal variations of              tance of bands 4 and 3 in the definition of the land/water
topographic details such as vegetation cover and land                interface and in differentiating vegetation.
use cover. In addition, the Nigeria administrative map of               The images were projected to Universal Traverse Mer-
Scale 1:5,000,000 was used to extract a shape file for the           cator (UTM) coordinate system Zone 31 N using World
study area (Table 1).                                                Geodetic System (WGS) 1984 datum for uniformity and
   Landsat imageries were downloaded from the archive                to correct for radiometric and geometric errors with the
of the United State Geological Survey (USGS.gov), while              view of bringing the location of element on the images
                                                                     to ground equivalence. The corrections were conducted

                                                                                                                 Vol.:(0123456789)
Research Article SN Applied Sciences (2021) 3:340 | https://doi.org/10.1007/s42452-021-04215-1
using calibration tool and Fast Line-of-Sight Atmospheric using raster to polygon conversion tool in ArcGIS. Reason
Analysis of Hypercubes (FLAASH) algorithm in ENVI 5.1 for converting to polygon was that the “Polygon to cen-
software environment [28, 29] and also were the origi- treline” only recognizes a shape file to produce the cen-
nal digital number (DN) of the raw Landsat images were trelines which were either right or left flange of the river
converted to top-of-atmosphere reflectance values. channel. After delineation of the centrelines, they were
Through image visual interpretation and ground-truth- digitized on screen manually to produce maps of the cen-
ing approaches, different land use/land cover types were trelines both right and left flanges of the river channel.
identified. Forty (40) training sample sites were selected The distances of channel migration between the centreline
from each land use and classified to produce land use/land of two consecutive years (1990–2002; 2002–2017) were
cover maps for the study periods using supervised classifi- calculated using Dm = T1 − T2; where Dm is the distance
cation approach in the maximum likelihood classification of channel migration, and T1 and T2 are the time period
algorithm, where land coverage is classified into areas of of the successive channel migration [32].
similar spectral characteristics for the study period [8]. The The occurrence of erosion along the channel bankline
analysis classified land use/land cover in the study area was estimated from the coordinates of each section of
into four broad groups, namely sedimentation, vegetation the bankline on the images and compared with bankline
(riparian), bare surface and water body. A confusion matrix migration positions in the three images covering the
analysis was carried out on all the images used to assess study period (1990, 2002 and 2017) [33]. In the same vein,
the accuracy of the classification. lengths of deposition along the bankline were estimated
from the coordinates of the positions of the bankline.
3.2 Morphological change detection When the shifting of the channel is negative value, it
indicates that the shifting is due to erosion and when the
The change estimation technique was used to identify the value is positive, it indicates a shifting due to deposition
change of land cover and quantify the rates and magni- [20, 23]. The schematic diagram of the method used for
tudes of change. The changes among the various land use this study is presented in Fig. 2.
types as classified for 1990, 2002 and 2017 were identified
and quantified based on the spectral characteristics and
was estimated on annual basis. The extent of erosion and
accretion-related changes in the channel were assessed
and the phases of exchange between the related classes
were deducted from the results. The persistent change in
each of the land use classes was noted through the period
of study.
In order to calculate the changes that have occurred in
the channel width over selected years, the channel length
was divided into 8 lines in E-W aligned at right angle (90°)
from North to South ([8, 30]. The channel widths were
measured at bankfull (bank to bank) using Cartesian
coordinate method in ArcGIS where the coordinates of
the right and left channel edge positions in the section
lines were measured and the bankfull widths were calcu-
lated from the coordinates using basic geometry [8, 31].
The river centreline was obtained from the respective
images for the study period with reference to major chan-
nel (channel exhibited a dominant flow path) [8] using an
external extension on ArcGIS called the Polygon to centre-
line. As shown in the images (Fig. 3), two major channels
formed dominant flow path, (referred to in this study as
left and right flange centreline). The given images were
automatically converted from raster format to polygon
using raster to polygon algorithm in ArcGIS to enable the
delineation of the midpoint from top to bottom of the
river channel. The water surface was extracted from the
classified image and converted from raster to polygon Fig. 2 Procedure for analysis of the image data
Vol:.(1234567890)
SN Applied Sciences (2021) 3:340 | https://doi.org/10.1007/s42452-021-04215-1 Research Article
4 Results and discussion all the years (1990–2002, 2002–2017) accounted for the
decrease observed in the water body in the same years.
4.1 Spatio‑Temporal pattern of land cover The changes observed in this period are not unexpected
between 1990 and 2017 as similar studies by Ashrafi, et al. [23], Mahammad et al.
[8] confirmed a decrease in water body as a result of
The results of land cover analysis of the channel are increase in deposition within a channel reach. In addi-
presented in Table 2. As shown in Table 2, four (4) land tion, the huge deposition at the middle of the channel
cover types were identified, namely bare surface, sedi- indicated a greater degree of obstruction to flow path
ment, vegetation (riparian) and water body. In the table, of the river (Fig. 3), thus, diverted river flow sideways
water body takes the largest proportion of the channel that resulted to river bank erosion in the adjourning
with a total area of 21.71 km2 (62.49%) in 1990, while land/flood plain as observed by Takagi et al. [30] and
in 2002 and 2017, the proportion reduced to 16.15 km2 Mohammad, et al., [8]. Though with marginal decrease,
(46.58%) and 15.71 km 2 (42.66%), respectively. There the riparian vegetation particularly those within the
was considerable decrease of 5.56 km 2 in the water channel reach (Fig. 3) not only encouraged high rate of
body between 1990 and 2002 and a further decrease sedimentation but served as a break to water flow and
of 0.44 km2 between 2002 and 2017. The total loss of thus hold back the particles (sediments) to a place and
water body to other categories of land (channel) cover encouraged the stabilization of the sediment [8]. In addi-
was 6.0 km2 which translated to the annual decrease of tion, the high rate of deposition in the study area may be
0.2 km2 /year. The riparian vegetation occupied 8.19 km2 attributed to the aftermath of large floods that occurred
(23.57%) in 1990 and decreased to 7.03 km2 (20.28%) in in the lower section of river Niger in 2012 where greater
2002 but increased to 7.39 km2 (20.07%) in 2017. How- portion of the channel were left with huge sediments
ever, notwithstanding the increase (0.36 km2) observed after a flooding occurrence [34]. The large portion of
between 2002 and 2017, there was an overall decrease mid-channel bar cum riparian vegetation no doubt
of 0.8 km2 (1990 and 2017) which translated to an annual obstructed the flow path which consequently diverted
decrease of 0.03 km2/year. sideways, thus leading to increase in bank erosion and
In 1990, the sediment occupied 4.68 km2 (13.48%) but widening of the channel corridor (Fig. 3). Generally, the
increased drastically to 7.89 km2 (22.76%) and 8.22 km2 development of riparian vegetation in this study may
(22.32%) in 2002 and 2017, respectively. Between 1990 be a result of the nutrients and seeds deposited along
and 2002, the increase was 3.21 km2 (0.267 km2/year), with the sediments that supported the growth of plants
while between 2002 and 2017 there was an increase and trees in the study channel. This lends credence to
of 0.331 km 2 (0.02 km 2 /year). The overall increase the observation made by Mahendra et al. [35] that car-
(1990–2017) was 3.54 km2 (0.13 km2/year). The bare sur- ried out a similar study along the Kuzuryu River, Japan,
face cover had a total area of 0.16 km2 (0.46%) in 1990 and reported a strong interaction between ecological
but astronomically increased to 3.60 km 2 (10.38%) in dynamics of riparian areas and sediment transportation
2002 and 5.50 km2 (14.94%) in 2017. This pattern shows in river systems. Thus, confirmed sediment as one of the
that in the space of 27 years, the bare surface has an major factors that contributed to the channel dynamics
overall increase of 5.34 km 2 (0.2 km 2/year) about 33 and pattern changes in the study area [36].
times the value in 1990. The changes observed in the bare surface land cover
The land cover pattern observed in the study channel in the study area, 0.46%, 10.38% and 14.94% in the three
as shown in Table 2 revealed that the increase in the pro- years period (1990–2017), predominantly fell within the
portion of the bare surface and sediment land cover in riparian vegetation land cover. This suggests human
activities responsible for the removal of the vegetation
Table 2 Land Cover types of the study area
Class Area (Km2) Diff (Km2) Changes per k m2/year
1990 2002 2017 1990–2002 2002–2017 1990–2017
Bare surface 0.16 (0.46%) 3.60 (10.38%) 5.50 (14.94%) 3.44 1.90 5.34 (0.2 k m2/y)
Sediment 4.68 (13.48%) 7.89 (22.76%) 8.22 (22.32%) 3.21 0.33 3.54 (0.13km2/y)
Vegetation 8.19 (23.57%) 7.03 (20.28%) 7.39 (20.07%) − 1.16 0.36 − 0.80 (0.03km2/y)
Water Body 21.71 (62.49%) 16.15 (46.58%) 15.71 (42.66%) − 5.56 − 0.44 − 6.00 (0.2 km2/y)
34.74 (100%) 34.67 (100%) 36.82 (100%)
Vol.:(0123456789)Research Article SN Applied Sciences (2021) 3:340 | https://doi.org/10.1007/s42452-021-04215-1
Fig. 3 Land cover classification over the study period
for farming activities bearing in mind that this section of the classification of the four land use types is shown
was the most fertile portion of the channel [37]. Dil- in Table 3 and the result showed a strong agreement
laha et al. [37] reported that worldwide, agriculture is between the classified images and the ground truth for
probably the largest contributor to the decline of ripar- the three years period (1991, 2002 and 2017) with overall
ian quality and functioning. He concluded that some of accuracy values ranged between 92.5 and 97.5, while
the most fertile soils are often located in riparian areas overall Kappa values ranged between 0.90 and 0.97. The
and that the areas also provide a convenient source of result further explained that the ground-truthing and
water for irrigation of adjacent cropland. The reliability land use type selection was carefully done.
Table 3 Accuracy assessment Accuracy assessment
of images used for land use/
land cover classification in the Land use/land cover 1990 2002 2017
study area
Producer User Producer User Producer User
Vegetation 100 91 90 90 100 100
Water body 90 82 100 100 100 91
Sediment 100 90 100 91 100 100
Bare surface 80 100 90 100 90 100
Overall accuracy 92.5 95 97.5
Overall Kappa 0.90 0.93 0.97
Vol:.(1234567890)SN Applied Sciences (2021) 3:340 | https://doi.org/10.1007/s42452-021-04215-1 Research Article
4.2 Channel bankline migration between 1990 while the eastwards shift ranged from 0.01 m (point 8)
and 2017 and 360 m (point 2) with total distance shift of 809.1 m.
Similarly, at the right flange (west) of the channel,
The evidence of lateral migration of river bank positions considerable shift to either westwards or eastwards
for the left and right flanges is shown in Tables 4 and was observed (Table 5). From Table 5, between 1990
5, respectively. As revealed in the tables (Tables 4 and and 2002, there was a prominent westwards shift
5), there was considerable migration in the channel as ranged from 20.9 to 378.1 m with a total distance shift
evident in the shift observed at the bankline on both of 707.57 m. All the other points at the right flange for
flanges of the channel. For instance, in Table 4, between the year (1990–2002) exhibited eastwards shift ranged
1990 and 2002, the left flange (east) of the channel was from 9.0 to 248.9 m, with a total distance shift of 428.1 m.
dominated with a eastwards shift in the bankline ranged Between 2002 and 2017, there were minimal eastwards
from 6 m (point 6) to 128 m (point1), with a total distance shifts but with a very high value of 689.3 m at the lower
shift of 315.25 m, while only point 3 shifted westwards section of the channel, specifically, at point 8. It is also
by 382.5 m. Between 2002 and 2017, the left flange (east) worth to mention that there was stability at points 1
of the channel also exhibited shift in both directions. For and 2 sections of the bankline. Studies (e.g. [20, 23, 38])
instance, a westwards shift ranged from 0.01 m (point 6) observed that the negative values depict a shift due to
to1348m (point 1) with a total distance shift of 2636.8 m,
Table 4 Positional coordinates of section of the bankline points along the left flange (east) of the study channel in 1990–2017
Sect Northings (m) Eastings (m) Difference in lateral shift (m)/annual migration rate
1990 2002 2017 1990–2002 2002–2017 1990–2017
1 814,669.051 244,916.036 244,788.025 246,136.373 128.011 (10.67) − 1348.348 ( − 89.89) − 1220.337 ( − 45.20)
2 813,176.959 244,436.029 244,368.503 244,008.932 67.526 (5.63) 359.571 (23.97) 427.097 (15.82)
3 811,677.474 243,896.077 244,278.657 243,949.002 − 382.580 ( − 31.88) 329.655 (21.98) − 52.925 ( − 1.96)
4 810,195.881 243,206.030 243,169.939 243,978.967 36.091 (3.01) − 809.028 ( − 53.94) − 772.937 ( − 28.63)
5 808,712.398 242,906.012 242,870.301 242,750.439 35.711 (2.98) 119.862 (7.99) 155.573 (5.76)
6 807,234.678 242,936.035 242,930.256 242,930.264 5.779 (0.48) − 0.008 ( − 0.00) 5.771 (0.21)
7 805,743.073 242,966.021 242,930.230 243,409.649 35.791 (2.98) − 479.419 ( − 39.95) − 443.628 ( − 16.43)
8 804,250.533 243,386.034 243,379.693 243,379.685 6.341 (0.53) 0.008 (0.00) 6.349 (0.24)
Westwards shift ( − ve) ∑ = 382.58 ∑ = 2636.803 ∑ = 2489.827
Eastwards shift (+ ve) ∑ = 315.25 ∑ = 809.096 ∑ = 594.70
The negative value indicates westward direction of shift; positive value indicates eastward direction of shift. Values in bracket are lateral shift
per year
Table 5 Positional coordinates of section of the bankline points along the right flange (west) of the study channel in 1990–2017
Sect Northings (m) Eastings (m) Difference in lateral shift (m)/annual migration rate
1990 2002 2017 1990–2002 2002–2017 1990–2017
1 814,669.051 247,556.060 247,934.201 247,934.166 − 378.141 ( − 31.5) 0.035 (0.002) − 378.106 ( − 14.0)
2 813,176.959 247,166.045 247,364.906 247,364.899 − 198.861 ( − 16.57) 0.007 (0.00) − 198.854 ( − 7.36)
3 811,677.474 246,956.033 246,795.590 246,885.279 160.443 (13.37) − 89.689 ( − 5.98) 70.754 (2.62)
4 810,195.881 246,656.000 246,765.627 246,675.726 − 109.627 ( − 9.14) 89.901 (5.99) − 19.726 ( − 0.73)
5 808,712.398 246,176.000 246,166.286 246,256.236 9.714 (.081) − 89.950 ( − 5.99) − 80.236 ( − 2.97)
6 807,234.678 245,725.838 245,716.835 245,746.850 9.003 (0.081) − 30.015 ( − 2.00) − 21.012 ( − 0.78)
7 805,743.073 245,726.020 245,477.107 245,417.245 248.913 (20.74) 59.862 (3.99) 308.775 (11.44)
8 804,250.533 245,695.935 245,716.877 245,027.628 − 20.942 ( − 1.75) 689.259 (45.95) 668.317 (24.75)
Westwards shift ( − v) ∑ = 707.571 ∑ = 209.654 ∑ = 697.934
Eastwards shift (+ v) ∑ = 428.073 ∑ = 839.064 ∑ = 1047.846
The negative value indicates westward direction of shift; positive value indicates eastward direction of shift. Values in bracket are lateral shift
per year
Vol.:(0123456789)Research Article SN Applied Sciences (2021) 3:340 | https://doi.org/10.1007/s42452-021-04215-1
erosion process along the channel bankline, while the 4.3 Lateral shifting of the channel centreline
positive values indicate shifting due to deposition. 1990–2007
The study further revealed that erosion was more
dominant along the left flange of the channel in all the The lateral shifting (directional) of the centreline of the
time period for this study (1990–2002, 2002–2017) with channel is shown in Table 6. As previously revealed, the
the higher value of 2636.8 m recorded in the 2002–2017 study channel has dual centrelines due to effect of deposi-
time period (Table 4). At the right flange (west), erosion tion and consequent development of riparian vegetation
was dominant in the time period 1990 and 2002 with a
total length of 707.6 m as compared to 428 m total length
covered by deposition process. By 2002–2017 time period,
erosion covered a total length of 209.6 m, while deposi-
tion covered 839 m which was about 4 times the value
of erosion (Table 5). As much as the total lengths of the
shift (inner or outer) along the channel were significant
when compared with deposition of 32 m–640 m recorded
by Mohammad, et al. [8], yet the values were far below
2678 m and 3378 m recorded as erosion and deposition,
respectively, at two different sections along the right
bank side of river Jamuna, Sirajganj district, Bangladesh
[23]. However, the total area covered by the deposition
due to eastwards shift of bankline was not determined
in this study, but has no doubt contributed, no matter
how negligible, to the overall percentage of sediment
land cover type for the study channel. This observation
thus confirmed that bank erosion is an important source
of sediment yields in lowland catchments [39]. The study
further confirmed observations of some scholars [8, 30,
40] that rates of bank erosion and deposition were vari-
able depending on the position of the channel bend, sedi-
ment and vegetation characteristics of the channel. If the
migration continues in this pattern for decades, there is
every possibility that the river channel will eat into the
surrounding floodplain.
Fig. 4 Lateral shifting of the channel centreline between 1990 and
2007
Table 6 Lateral shift of the Sect 1990–2002 2002–2017
centreline of the left and right
flanges of the study channel Left flange shift Right flange shift Left flange shift Right flange shift
between 1990 and 2017
Dist (m) Direction Dist (m) Direction Dist (m) Direction Dist (m) Direction
1 208.829 west 80.121 west − 1347.299 East − 722.098 East
2 529.38 west − 223.601 East 375.708 west 107.084 west
3 − 2.912 East 56.976 west 226.146 west 123.308 west
4 250.958 west − 67.475 East − 732.898 East 89.287 west
5 452.907 west 63.479 west 129.219 west − 414.03 East
6 − 110.463 East − 57.741 East 144.602 west 25.317 west
7 339.318 west 112.023 west − 387.468 East 393.595 west
8 87.577 west 151.105 west − 123.111 East 568.27 west
∑ = 1868.969 West ∑ = 463.704 West ∑ = 875.675 West ∑ = 1306.86 West
∑ = 113.375 East ∑ = 348.792 East ∑ = 2590.776 East ∑ = 414.03 East
Vol:.(1234567890)SN Applied Sciences (2021) 3:340 | https://doi.org/10.1007/s42452-021-04215-1 Research Article
that bifurcated the channel into two major water flow changes of the width along the channel reach in 1990
paths (Fig. 4). In all the time period 1990–2002 and ranged from 2309.9 m at Sect. 8 (lower part) to 3449.97 m
2002–2017, there were noticeable variations in the centre- at Sect. 4 with a mean value of 2876.2 m. By 2002, the
line shift. For instance, between 1990 and 2002, at the left width had an increase ranged from 2337.184 m at Sect. 8
flange of the river flow path, there was high centreline shift (lower part) to 3595.688 m at Sect. 4 with mean value
with a total length of 1868.969 m towards the left hand of 2,902.728 m. In 2017, there was a decrease in the
side of the river as against 113.375 m that shifted towards width ranged from 1647.943 m at Sect. 8 (lower part) to
right of the channel. During the same period (1990–2002) 3505.797 m at Sect. 5 with mean value of 2595.59 m. The
at the right flange of the river flow path, migration length result of the temporal width changes revealed very mini-
was prominence at the either side of the centreline with mal change in all the years similar to the observation of
463.704 m (left shift) and 348.792 m (right shift). By the Takagi, et al. [30] on the braided-belt channel width of
2002–2017 time period, the shifting pattern at the left Brahmaputra River, Bangladesh. However, there are sig-
flange of the river flow path was quite different when com- nificant spatial changes observed at each section of the
pared with the pervious time period (1990–2002), as there channel reach in 1990–2002 and 2002–2017 time periods.
was high rate of shift with a total length of 2590.776 m For instance, between 1990 and 2002, there was consistent
towards the right hand side of the centreline as against increase in the channel widths, though varied in distances
total length of 875.675 m that shifted left of the centreline. along the river reach (26 m –506.2 m), except at Sect. 3 that
At the right flange of the channel, a shift of 1306.861 m a decrease of 543.0 m was observed (Fig. 5). Between 2002
was recorded at left side of the centreline, while a total and 2017, channel widths increased significantly in some
length of 414.03 m was recorded at the right side of the sections, i.e. Sects. 2, 3 and 5, while the channel widths at
centreline (Table 6). The lateral shifting experienced in the Sects. 1,4, 7 and 8 exhibited significant decrease ranged
centreline of the two river flow paths in the study area may from 539.3 to 1348.4 m, along the channel reach (Fig. 5).
be attributed to the erosion and accretion activities at the Considering the time period 1990 and 2017, the channel
river banks and bends as observed by many scholars [8, widths exhibited significant increase at Sect. 2 (625.9 m)
30]. These activities have a consequent effect on the posi- and Sect. 5 (235.8 m), while Sects. 1,4, 7 and 8 exhibited
tional stability of the river centreline [41]. As exhibited in significant decrease ranged from 123.7 m at Sect. 3 to
Fig. 3, the study area was characterized with braided chan- 842.2 m at Sect. 1of the channel reach. Specifically as
nels which occurred as a result of deposition at some river/ shown in Fig. 4, in 1990–2002 time period, the width exhib-
channel bends. However, this pattern was not unexpected ited though with varied length, increase at Sects. 1,2,4 and
as the study area falls within the lower course of River 7 but exhibited notable decrease in length at Sect. 3. In
Niger where geomorphological process was dominantly 2002–2017 and 1990–2017 time periods, there was promi-
depositional as a result of weak in the carrying capacity of nent decrease in width length at Sects. 1,4, 7 and 8, while
sediment load within the channel [30, 40]. positive length increase was observed at Sects. 2 and 3.
Considering the morphological and land cover
4.4 The river width morphology observed in the study, the channel revealed some impacts
of human activities as well as climate change and overall
The temporal and spatial changes of the channel width degradation, thus confirmed that the river was not in its
over the study period are shown in Table 7. The temporal natural state. The implication of increased sediment both
Table 7 River widths at various sections Channel widths (m) Diff. in channel widths (m)
sections along the channel in
1990, 2002 and 2017 1990 2002 2017 1990–2002 2002–2017 1990–2017
1 2640.009 3146.176 1797.793 506.167 − 1348.383 − 842.216
2 2730.016 2996.403 3355.967 266.387 359.564 625.951
3 3059.956 2516.933 2936.277 − 543.026 419.344 − 123.682
4 3449.970 3595.688 2696.759 145.718 − 896.929 − 753.211
5 3269.988 3295.985 3505.797 25.997 209.812 235.809
6 2789.803 2786.579 2816.586 − 3.224 30.007 26.783
7 2759.999 2546.877 2007.596 213.122 − 539.281 − 752.403
8 2309.901 2337.184 1647.943 27.283 − 689.241 − 661.958
∑ 23,009.645 23,221.825 20,764.718
Mean 2876.205 2902.728 2595.590
Vol.:(0123456789)Research Article SN Applied Sciences (2021) 3:340 | https://doi.org/10.1007/s42452-021-04215-1
Fig. 5 Variations in channel 1000
widths between 1990 and
2017 along the measured
Variations in chennel widths (m)
sections 500
0
1990-2002
1 2 3 4 5 6 7 8
2002-2017
-500
1990-2017
-1000
-1500
Measured points along the horizontal axis of the channel
within and at the bank of the river channel will hinder the both at the left and right flange of the river flow paths
free flow of waterways transportation of goods and pas- throughout the years as the centreline shifted towards
sengers, mostly traders, by ferry. Once sediment entered the east in the earlier years of study(1990–2002) but
waterway, it is difficult and expensive to remove except migrated greatly in the later years of study (2002–2017)
through engineering solution. This therefore explains the in the westward direction.
reason why Federal Government committed billions of The study further showed that remotely sensed data
Naira (266 million US dollar) to the dredging of the lower such as Landsat imageries which are freely available for
part of river Niger few years ago. Going by the consist- research in developing countries like Nigeria played a
ent reduction in the water component of the channel, prominent role in the analysis and evaluation of river
most of the aquatic life such as Tilapia, Synodontis, Labeo channel morphology in terms of cost and time if field
and Cithafisnus to mention but a few, will be scarce and surveying techniques are to be used. In addition, remote
inaccessible to the local fishermen whose livelihood were sensing techniques clearly offer significant potential to
limited to subsistent fishing similar to the observation of facilitate a number of river related application for effec-
Solomon et al. [42] at Idah area of Kogi State, Nigeria. The tive river management and water resource strategies.
lower channel of river Niger as revealed by this study did There is no doubt that the results of this study will con-
not portray a sustainable used of the channel as recom- tribute meaningfully to the strategies needed for effec-
mended by the United Nation in the Sustainable Develop- tive river and ecosystem-based management model.
ment Goals 14 (SDGs 14) agenda that may eventually lead
to sustainable inland waterways development and other Acknowledgements The author acknowledges the contribution
of Mr. N. K. Gimba of the Department of Remote Sensing and GIS,
blue economy development in Nigeria [43]. School of Earth and Mineral Science, Federal University of Tech-
nology Akure who assisted in the field work and analysis of the
imageries.
5 Conclusion
Author contributions The author conceptualized and designed the
research framework. He also supervised the research and wrote the
The study has revealed the morphology and land manuscript.
cover of lower course of river Niger in the past 27 years
(1990–2017). The temporal assessment of the river mor- Data availability The data used are satellite images from opened
phology between 1990 and 2017 showed considerable source and field observation.
changes in all the land cover and morphological attrib-
utes with conspicuous decrease in riparian vegetation Code availability ArcGIS from ESRI made available to the University
was used.
and water body. The sediment in all the years increased
greatly to the detriment of the water body. The river
(channel) width also exhibited varied decrease and
Compliance with ethical standards
increase at various sections of the channel reach in all Conflict of interest There is no conflict of interest while carrying out
the time period. Furthermore, it was observed that the this research.
nature of the river channel centreline was not constant
Vol:.(1234567890)SN Applied Sciences (2021) 3:340 | https://doi.org/10.1007/s42452-021-04215-1 Research Article
Open Access This article is licensed under a Creative Commons Attri- international river symposium and environmental flows con-
bution 4.0 International License, which permits use, sharing, adap- ference, Brisbane, Australia, 2–6
tation, distribution and reproduction in any medium or format, as 14. Moussa A, ElMoustafa A (2010) Morphological changes analy-
long as you give appropriate credit to the original author(s) and the sis for Nile Bed at Aswan Bridge area using GIS. Ain Shams J
source, provide a link to the Creative Commons licence, and indicate Civ Eng (ASJCE) 2:599–610
if changes were made. The images or other third party material in this 15. Porter MD, Masson TM (2004) Analysing changes in river chan-
article are included in the article’s Creative Commons licence, unless nel morphology using GIS for Rio Grande Silvery Minnow hab-
indicated otherwise in a credit line to the material. If material is not itat assessment. GIS/Spatial Anal Fish Aquat Sci 505:433–446
included in the article’s Creative Commons licence and your intended 16. Jeje LK, Ikeazota SI (2002) Effects of urbanization on channel
use is not permitted by statutory regulation or exceeds the permitted morphology: the case of Ekulu River in Enugu, Southeastern
use, you will need to obtain permission directly from the copyright Nigeria. Singap J Trop Geogr 23(1):37–51
holder. To view a copy of this licence, visit http://creativecommons 17. Thornton E, Neave M, Rayburg, S (2007) Hydraulic geometry in
.org/licenses/by/4.0/. river channel networks as a method for the assessment of river
condition. Proceedings of the 5th Australian stream manage-
ment conference. Australian rivers: making a difference. Charles
Sturt University, Thurgoona, New South Wales, pp. 401–406
References 18. Fuller I (2007) River and channel morphology: technical report
prepared for horizons regional council, measuring and moni-
1. Manjusree P, Satyanarayana P, Bhatt CM., Sharma SVSP, Srini- toring channel morphology. Messy University, New Zealand
vasa RG (2014) Remote sensing and GIS for river morphology 19. Treitz PM, Howwarth PJ, Gong P (1992) Application of satellite
studies. National Remote Sensing Centre ISRO, Department of and GIS technologies for land-cover and land-used mapping
Space, Hyderabad 1–10. https://www.researchgate.net/publi at the rural fringe: a case study. Photogramm Eng Remote
cation/260317105 Sens 58:439–448
2. Novica L, Radislav T (2016) Assessment of bank erosion, accre- 20. Longoni L, Papini M, Brambilla D, Barazzetti L, Roncoroni F,
tion and channel shifting using remote sensing and GIS: case Scaioni M et al (2016) Monitoring riverbank erosion in moun-
study—Lower course of the Bosna river. Quaestiones Geo- tain catchments using terrestrial laser scanning. Remote Sens
graphicae 35(1):81–92 8:241. https://doi.org/10.3390/rs8030241
3. El-sayed RM, Abdelazim MN, Ghaly S, Ali KA (2017) Morpholog- 21. Du Z, Linghu B, Ling F, Li W, Tian W, Wang H et al (2012) Esti-
ical variation of the Nile river fourth reach. Twentieth interna- mating surface water area changes using time-series Landsat
tional water technology conference, IWTC20 Hurghada, 10p. data in the Qingjiang River Basin, China. J Appl Remote Sens
https://www.researchgate.net/publication/310327662 6(1):063609–063609
4. Fashae OA, Faniran A (2015) Downstream morphologic char- 22. Negm A, Elsahabi M, El-Sayed R, El-Basset NA, Ghaly S, Ali
acteristics of the alluvial section of Lower river Ogun,Nigeria. K (2016) Morphological variation of the Nile River first and
J Environ Geogr 8(1–2):1–10. https://doi.org/10.1515/jenge second reaches using RS/GIS techniques. Nile River Hdb Env
o-2015-0001 Chem. https: //doi.org/10.1007/698_2016_126,©Spring erIn
5. Surian N (1999) Channel changes due to river regula- ternationalPublishingAG
tion: the case of the Piave River, Earth surface processes 23. Ashrafi TJ, Sikdar MS, Islam MK (2018) River change detec-
and landforms. John Willy Online Library, Italy. https://doi. tion and bank erosion identification using topographical
org/10.1002/(SICI)1096-9837(199911 )24:12%3C1135 ::AID- and remote sensing data. 4th international conference on
ESP40%3E3.0.CO;2-F advances in civil engineering, 19–21 December CUET, Chit-
6. Haron NA, You GQ, Sulaiman MS, Yusuf B (2017) Abood MM tagong, Bangladesh
(2017) evaluation of river stability by morphological assess- 24. World Bank (2016) Blue Economy development framework—
ment. Infrastruct Univ Kuala Lumpur Res J 5(1):11–20 Growing the Blue Economy to combat poverty and accelerate
7. Ghoshal S, James LA, Singer BM, Aalto R (2010) Channel and prosperity. http://pubdoc s.worldb ank.org/en/446441 4733
floodplain change analysis over a 100-year period: lower 490790 68/AMCOEC C-Blue-Econom y-Develo pment -Framew ork
Yuba river, California. Remote Sens 2:1797–1825. https://doi. 25. United Nations Economic Commission for Africa (2016) Africa’s
org/10.3390/rs2071797 Blue Economy: a policy handbook. Addis-Abba, Ethiopia
8. Mohammad AH, Bhuiyan TK, Shigeyuki S (2014) Application 26. Mabogunje AL (2019) Niger River. Encyclopædia Britannica
of remote sensing and GIS for evaluation of the recent mor- https: //www.britan nica. com/place/ Niger- River/ Hydrol ogy. Last
phological characteristics of the lower Brahmaputra-Jamuna Updated: Dec 25, 2019
River, Bangladesh. Springer-Verlag, Berlin Heidelberg, p 18p 27. Meseko AA, Obieje DI, Karpenko O (2018) Tourism potential of
9. Adediji A, Jeje LK (2004) Channel erosion in the Opa Basin, the confluence between river Niger and river Benue in Nigeria:
Southwestern Nigeria. J Environ Hydrol 12:1–11 implication for project finance. J Glob Entrep Res 8(6):1–14
10. Ibitoye MO, Aboyeji OS, Adekemi SOA (2016) Spatio-temporal 28. Hester DB, Cakir HI, Nelson SAC, Khorram S (2008) Per-pixel
analysis of landuse dynamics in upper Opa catchment. South- classification of high spatial resolution satellite imagery for
western Nigeria. Ethiop J Environ Stud Manag 9(6):780–792 urban land-cover mapping. Photogramm Eng Remote Sens
11. Eludoyin AO, Adewole AO (2019) A remote sensing-based 74:463–471
evaluation of an unguaged basin in Southwestern Nige- 29. Lui GV, Coomes DA (2015) A comparison of novel optical remote
ria. Int J River Basin Manag. https://doi.org/10.1080/15715 sensing-based technologies for forest-cover/change monitor-
124.2019.1640226 ing. Remote Sens 7:2781–2807
12. Ali AD (2013) The colonial economy in the Lower Niger Region. 30. Takagi T, Oguchi T, Matsumoto J, Grossma MJ, Sarker MH, Matin
Arab J Bus Manag Rev (OMAN Chapter) 2(7):47–54 MA (2007) Channel braiding and stability of the Brahmaputra
13. , Akegbejo-Samsons Y (2017) The inner Niger Delta Pro- River, Bangladesh, since 1967: GIS and remote sensing analyses.
ject: environmental, social and economic consequences of Geomorphology 85:294–305
dredging the Lower Niger river on the Communities. 10th 31. Mount NJ, Louis J, Teeuw RM, Zukowskyj PM, Stott T (2003) Esti-
mation of error in bankfull width comparisons from temporally
Vol.:(0123456789)Research Article SN Applied Sciences (2021) 3:340 | https://doi.org/10.1007/s42452-021-04215-1
sequenced raw and corrected aerial photographs. Geomorphol- accretion in the Marala Alexandria reach of the River Chenab,
ogy 56:65–77 Pakistan. Sains Malaysiana 46(3):413–420
32. Giardino JR, Lee AA (2011) Rates of channel migration on the 39. Veihe A, Jensen NH, Schiøtz IG, Nielsen SL (2011) Magnitude and
Brazos River, Final report submitted to the Texas water develop- processes of bank erosion at a small stream in Denmark. Hydrol
ment board, Texas A & M University, 8–9 Process 25:1597–1613
33. Akhtar MP, Sharma N, Ojha CSP (2011) Braiding process and 40. Sarker MH, Thorne CR, Aktar MN, Ferdous MR (2014) Morpho-
bank erosion in the Brahmaputra River. Int J Sed Res 26:431–444 dynamics of the Brahmaputra-Jamuna River, Bangladesh. Geo-
34. Nwosu PC, Olayinka DN, Nwilo PC (2013) Generation of flood morphology 215:45–59
maps and drainage basin of Umueze Anam, Nigeria. Environ- 41. Soar PJ, Wallerstein NP, Thorne CR (2017) Quantifying river
ment for sustainability, FIG working week, Abuja, 6–10 May, channel stability at the basin scale. Water 9:133. https://doi.
1–15 org/10.3390/w9020133
35. Mahendra BB, Takashi A, Takeshi F, Senavirathna MDHJ, Guligena 42. Solomon SG, Okomoda VT, Aladi SL (2012) Fish fauna in lower
M et al (2019) Mechanism of riparian vegetation growth and river Niger at Idah in Kogi state. J Agric Vet Sci 4:34–43
sediment transport interaction in floodplain: a dynamic ripar- 43. Elisha OD (2019) The Nigerian blue economy: prospects for eco-
ian vegetation model (DRIPVEM) approach. Water. https://doi. nomic growth and challenges. Int J Sci Res Educ 12(5):680–699
org/10.3390/w12010077
36. Church M, Rice SP (2009) Form and growth of bars in a wander- Publisher’s Note Springer Nature remains neutral with regard to
ing gravel-bed river. Earth Surf Process Landform 34:1422–1432 jurisdictional claims in published maps and institutional affiliations.
37. Dillaha TA, Reneau RBM, S, Lee, D, (1989) Vegetative filter strips
for agricultural non-point source pollution control. Trans Am Soc
Agric Eng 3:513–519
38. Hamid CHM, Ashraf M, Hamid Q, Sarwar SM, Saqib ZA (2017)
Geospatial techniques for assessment of bank erosion and
Vol:.(1234567890)You can also read