A Novel Framework for Highlight Reflectance Transformation Imaging
←
→
Page content transcription
If your browser does not render page correctly, please read the page content below
A Novel Framework for Highlight Reflectance Transformation Imaging

    Andrea Giachettia , Irina Ciortana , Claudia Daffaraa , Giacomo Marchioroa , Ruggero Pintusb , Enrico Gobbettib
                                                       a Universityof Verona, Italy
                                                           http://www.univr.it/
                                                 b CRS4, Visual Computing Group, Italy

                                                          http://www.crs4.it/vic/

Abstract
We propose a novel pipeline and related software tools for processing the multi-light image collections (MLICs)
acquired in different application contexts to obtain shape and appearance information of captured surfaces, as well
as to derive compact relightable representations of them. Our pipeline extends the popular Highlight Reflectance
Transformation Imaging (H-RTI) framework, which is widely used in the Cultural Heritage domain. We support, in
particular, perspective camera modeling, per-pixel interpolated light direction estimation, as well as light normaliza-
tion correcting vignetting and uneven non-directional illumination. Furthermore, we propose two novel easy-to-use
software tools to simplify all processing steps. The tools, in addition to support easy processing and encoding of pixel
data, implement a variety of visualizations, as well as multiple reflectance-model-fitting options. Experimental tests
on synthetic and real-world MLICs demonstrate the usefulness of the novel algorithmic framework and the potential
benefits of the proposed tools for end-user applications.
Keywords: Multi Light Image Collections, Highlight Reflectance Transformation Imaging, Photometric Stereo,
Image Enhancement

1. Introduction

    Multi-light image collections (MLICs) are an effective mean to gather detailed information on the shape and
appearance of objects. They are, thus, widely used in many application contexts.
    The basic idea of the approach is to visually characterize objects by capturing multiple images of the surface
of interest from a fixed point of view, changing the illumination conditions at each shot. The acquired data is then
processed to extract shape and material information. While some techniques exist for general variable environmental
illumination [1, 2], the most widespread approach in most application fields, including Cultural Heritage (CH) [3],
medical interventions [4, 5], and underwater data gathering [6], considers a single calibrated camera taking multiple
images of a scene illuminated by a single moving light. A large variety of efficient computational tools have been
devised in this context to extract information from the captured image stack in order to effectively solve different
problems, such as feature detection and enhancement, reconstruction of normals and 3D shapes, and creation of
relightable images.
    Photometric Stereo (PS) is probably the most widely known technology based on MLICs. It exploits priors on
reflectance functions to derive local normals and global 3D shapes [7]. Reflectance Transformation Imaging (RTI) [8,
9, 10, 11] extends the PS idea by interpolating MLIC reflectance data with parametric functions (Polynomial Texture
Maps, PTM; Hemispherical Harmonics, HSH; Discrete Modal Decomposition, DMD), which can be used to estimate
and display images relighted from arbitrary angles and incorporating other image enhancements for visually revealing
surface details not detectable from a single view [10, 12, 13]. Other techniques try, rather, to improve understanding
by highlighting specific making surface and material properties. For instance, Raskar et al. [14] exploited multi-
light images to extract depth edges with a simple heuristics and used the result to create non-photorealistic rendering
methods, while Fattal et al. [15] used them to generate enhanced images emphasizing shape and surface detail.
    RTI is possibly the most widely applied MLIC technique. This kind of imaging has rapidly become a widely used
solution for the documentation, recording and decoding of Cultural Heritage (CH) objects, as it supports an offline
analysis of the artifacts, supporting and going beyond simulated raking light analysis, and allows the estimation of
Peer-reviewed version - Computer Vision and Image Understanding       Received 15 Dec 2016, Revised 18 May 2017, Accepted 29 May 2017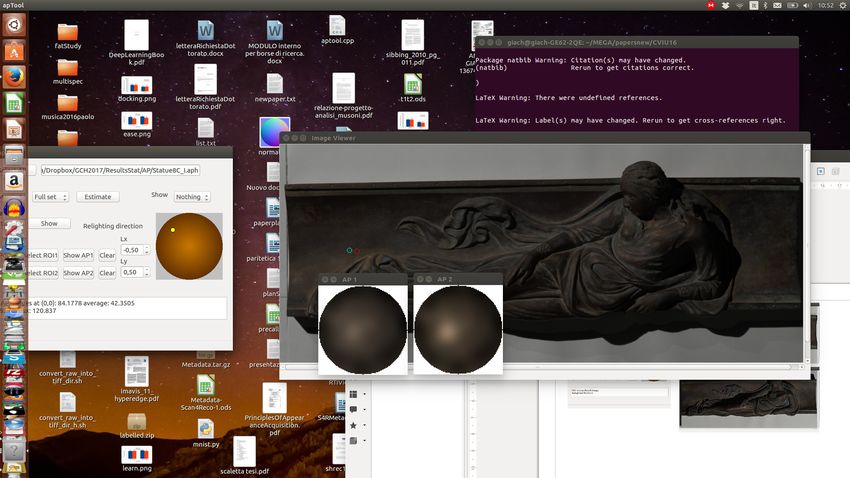
image enhancements emphasizing details [16, 17]. Furthermore, the reflectance interpolation coefficients derived
from MLIC processing, or the image features extracted from the image stack, can be used to characterize and classify
materials, as shown in a number of works [18, 19, 20].
    The widespread use of RTI for visual surface characterization, especially in the CH domain, is also due to the
fact that it can be performed with a low-cost, flexible, and easy to use setup based on freehand light positioning and
highlight-based light direction estimation (H-RTI) [3]. In the H-RTI image-capture technique, the reflection of the
light source on one or more reflective spheres visible in each shot enables the processing software to calculate the
light direction for each image, providing great robustness and flexibility in subject size and location.
    The classic H-RTI acquisition setup and processing pipeline, however, are based on strong assumptions on lights
(ideally constant in direction and intensity) and camera model (orthographic), not necessarily matching typical ac-
quisition conditions [3, 21]. In particular, due to the lack of uniformity in illumination intensity and direction, the
results obtained with this simple setup may vary widely between acquisitions, and may be unsuitable for quantitative
analyses, which include normal estimation, roughness or material segmentation/classification, as well as monitoring
over time. Exploitation of H-RTI data is thus often limited to rough qualitative analysis of single acquisitions.
    In this article, we revise the H-RTI approach, presenting a novel practical setup and a set of tools that relax the
aforementioned strong assumptions. Our solution offers a better support for qualitative analysis of MLICs and enables
the addition of quantitative analysis on top of the classic RTI method. Our main contributions are the following:

   • a novel practical setup and processing pipeline that can cope with the effects of perspective camera distortion,
     non-point lights, spatially varying illumination, variable light distance, as well as camera vignetting. Per-pixel
     light directions are estimated from highlights on multiple reflective spheres, taking into account perspective cor-
     rection and performing direction interpolation, while illumination variations are compensated by an algorithm
     exploiting light intensity measured on matte white targets positioned around the object of interest.

   • An easy to use tool to perform/control all the processing pipeline, not requiring to rely on external image
     processing applications and storing reordered pixel information with associated light directions in a dedicated
     structure that can be effectively used for post-processing (e.g. Photometric Stereo, RTI, feature detection, and
     visualization).
   • An easy to use tool to complete the pipeline with enhanced visualizations, as well as with shape and material
     information recovery operations.
    Our novel combination of several flexible auto-calibration techniques into a single framework aims to provide a
significant step towards a practical quantitative and repeatable analysis using simple and low-cost free-form acquisi-
tion strategies.
    The paper is organized as follows. Sec. 2 provides a quick overview of existing RTI acquisition setups and
light calibration approaches, while in Sec. 3 our algorithmic contribution is described. The tools that implement
the proposed approach are presented in Sec. 4. Sec. 5 demonstrates, with experimental tests, the advantages of our
improved pipeline, as well as the potential advantages of its use for practical applications.

2. Related work

     Multi-light acquisition, processing, and analysis are broad research subjects, and a full review is out-of-scope for
this article. We concentrate here only on the most-related methods to perform RTI acquisition and processing. For
a wider coverage, we refer the reader to established surveys in surface reflectance capture [22], multi-light computa-
tional frameworks [7], digital modeling of material appearance [23], and geometric analysis in cultural heritage [24].
     A wide variety of RTI acquisition setups exist, ranging from low-cost and transportable kits [21] to different sizes
of fixed light domes[21, 25, 26]. Recently, some dome solutions have been presented that use both visible and invisible
light wavelengths [27, 28]. Dome solutions allow for pre-calibration of lights, but they are, in general, expensive and
not flexible, thus limiting the potential changes in light numbers, positions and types, and the size of captured surfaces.
     Our goal is, rather, to improve the classic hand-held light capture, which is low-cost, simple to implement, and
allows for a more flexible choice of the number and the positions of the light sources; these factors are very important,
for example, when dealing with non-Lambertian, shiny materials. Moreover, it is easy to extend the presented pipeline
                                                            2
to the multi- or hyper-spectral domain at a much lower cost than multiple-light setups, which can easily require
hundreds of illuminators or filters.
    Free-form hand-held setups are widely used in the Cultural Heritage domain as powerful Computational Photog-
raphy tools by many end users, especially to create relightable images and for detail enhancement. This large diffusion
is mainly due to publicly available packages such as RTIBuilder and RTIViewer [21], which employ the H-RTI cap-
ture setup and use manual annotation of reflective spheres and highlight-based light direction estimation. However,
these tools rely on limiting assumptions about lighting and camera, i.e., uniform and far point light (collimated rays)
and orthographic camera with an ideal lens. Since the computation of surface attributes leads to significant errors and
provides variable results for each acquisition, the applications of this method for geometrical reconstruction, material
acquisition, and quantitative analysis are limited. Conversely, we want to adopt here more realistic lighting and cam-
era models, taking into account optical effects such as vignetting, non-uniform light emission, and light attenuation
with distance.
    The calibration of real illumination is a well-known topic in Computer Vision, and, specifically, in the Photometric
Stereo (PS) field [7]. While some methods try to implicitly consider real light sources within the particular PS
framework [29, 30], others are more focused on the explicit calibration of various lighting properties. Some methods
make assumptions on light form factor, e.g., near point light [31] or linear light source [32], and try to exploit the
illuminated scene to extract the light position and direction. For instance, Ahmad et al. [31] exploit diffused maxima
regions in the framed model, and derive from them the light directions. Others perform calibration by sampling light
on calibration targets of known shape and albedo (e.g., reflective spheres or diffuse targets). Corsini et al. [33] use
high-dynamic range images of two reflective balls to acquire the spatially-varying illumination of a real-world scene,
and it focuses more on the environment light effect rather than of the computation of a per-pixel light direction and
intensity. Ackermann et al. [34] present a study and validation through error statistics of both a forward and backward
geometric point light source calibration by using sets of different numbers of reflective spheres. Although it proposes
a very simple and robust way to compute light direction, it considers a point light model without taking into account
non-uniform light intensity. Other methods strongly rely on a specific, fixed light form factor (e.g., LED light [35, 36],
and model the intensity with the corresponding fall-off due to both distance and angle to the light principal axis. Xie
et al. [36] also consider vignetting effects. Unfortunately, those methods are not applicable to the case of a general
variable illumination due to non-ideal lamps or lenses. Some works thus try to cope with non-uniform intensity
without imposing an analytical light model [37, 38]. Similarly to us, they use a flat reference object with known
albedo to sample an arbitrary lighting vector field and to calibrate it using a flat-fielding approach. They don’t use
polynomial interpolation, but they exploit measured spatially-varying intensities to compensate the input images, and
to convert the problem into a standard collimated case. Differently to our work, they require different acquisitions for
the calibration step and the actual capture; this is possible only with a fixed light configuration, but it is not applicable
to a more general free-form, hand-held multi-light acquisition. In our approach, we use multiple spheres to estimate
a light direction field, and use measures on a planar white target to estimate the intensity of each light ray, infilling
missing data with a low-degree interpolation, thus reconstructing an approximation of the entire light field illuminating
the scene.
    The pipeline presented here was preliminarily proposed in our previous conference papers [39, 20]. The pipeline
improves the classical highlight-based RTI capture framework by estimating per-pixel interpolated light direction and
creating intensity-corrected images simulating constant illumination on a reference plane. We here provide a more
thorough exposition, but also significant new material, including the support for a non-orthographic camera model,
a new organization of data that facilitates processing and display, the presentation of easy-to-use software interfaces
to perform all the processing steps and novel experiments to demonstrate the advantages of the proposed methods.
Finally, we have attempted to further clarify the steps in our methods to facilitate their implementation and to make
the transfer between abstract concepts and actual code as straightforward as possible.

3. Improved Highlight RTI pipeline

    Our complete acquisition and processing pipeline is shown in Fig. 1. We acquire and take as input a Multi-
Light image collection. Light information may be in principle known for each image if coming from a calibrated
system (light dome). If lights are not known and calibrated, as in hand-held light acquisition, the classical solution

                                                             3
Figure 1: The proposed MLIC processing pipeline.

is to assume uniform intensity and direction and use a reflective sphere for estimating light direction from highlight
position (H-RTI).
     Our first contribution is a more complete setup (Fig. 2(a)) to characterize lights directly from images, improving
H-RTI. This setup includes, in addition to several (typically four) reflective spheres, a matte white planar frame around
the object being captured. The multiple spheres are used to derive a more accurate per pixel interpolated direction,
while the frame is used to estimate a correction for light non-uniformity and vignetting, as described in Sec. 3.4.
Several instantiations of this concept are possible. In particular, if an object is captured in a typical laboratory setup,
the white frame can be replaced by a Lambertian surface covering the plane supporting the object. Moreover, in
outdoor acquisitions of large objects, spheres at the corner of the visual fields and multiple co-planar Lambertian
targets on the acquisition reference plane could be placed, as well, and used for the subsequent calibration procedures.
In order to simplify generic on-site acquisitions, we realized a modular frame building set, which combines 3D-printed
supports for spheres with aluminum bars of different lengths covered by approximately Lambertian coating (Fig. 2(b)).
This allows the creation of rigid frames that can be placed in horizontal, vertical or arbitrary orientations. The current
version holds 5cm wide spheres, but we plan to realize sets of different sizes.
     Before the acquisition, we assume that we have already (and once) calibrated the internal characteristics of the
camera, in order to obtain the radiometric response function and the lens parameters. The capture process outputs
an image stack, which is preprocessed and semi-automatically annotated with custom software (see Sec. 4) to find
the position of the spheres and rectangular regions of the white frame (Fig. 3). From the positions of highlights,
the incident light direction is estimated at the highlight location and interpolated across the whole image. Then,

                                                               4
(a) Setup                                                      (b) Scene

Figure 2: Capture setup. (a) The acquisition setup consists in a stationary DSLR digital camera, a hand-held light source, some calibration
targets (a Lambertian white background/frame and four black reflective spheres), and the object being acquired positioned on a planar support
perpendicular to the camera axis. (b) Camera view of the scene.

illumination intensity is corrected at each pixel location. This is done by multiplying the local value by the factor
that would make the locally interpolated white frame intensity match a reference value multiplied by the cosine of the
local light direction elevation angle.
    After that, each pixel is associated with a calibrated reflectance profile (appearance profile), coupled with cali-
brated light parameters. Those are used to provide the user with an interactive data visualization, and to perform
various processing operations on reflectance data. For instance, as in typical RTI settings, we fit reflectance data to a
low-dimensional analytic representation, in order to extract a small set of coefficients that can compactly describe the
image stack at each pixel. Then, we use this information to relight the object, to compute geometric attributes (e.g.,
normal maps or 3D surface reconstruction), or to extract meaningful appearance features and descriptors for material
classification and recognition.
    All the procedures can be controlled by two software tools that will be described in detail in Sec. 4: one dedicated
to the preprocessing and reorganization of pixel data (RTITool), one to reflectance data fitting, normals estimation,
visualization and analysis (APTool).
    In the rest of this section, we provide details on the major pipeline components: preprocessing to prepare data
for further elaboration (Sec. 3.1), perspective light direction estimation from highlight on a single sphere (Sec. 3.2),
reconstruction of lper-pixel light direction by interpolation of results on multiple detected highlights (Sec. 3.3), light
intensity correction by exploiting interpolated directions and measures on a matte planar target (Sec. 3.4), storage
of the calibrated per-pixel information in a 3D appearance profile array (Sec. 3.5), and, finally, basic processing of
appearance profile data to recover shape and reflectance parameters (Sec. 3.6).

3.1. Preprocessing
    Image preprocessing consists mainly in the removal of ambient light and undistortion. These two transformations
are applied to all the images in the collection before they are fed to the light direction estimation step. The ambient
light is captured by acquiring an extra image of the scene with the handheld light source turned off. The undistortion
is performed according to the intrinsic camera parameters estimated a priori with a standard calibration procedure.
Auxiliary to the annotation of the black reflective spheres and the white Lambertian frame, stand the maximum image
and respectively, the minimum image estimation. The maximum of the image collection discards the shadow around
the spheres, hence improving the visual acuity, while the minimum image maps the projected shadows areas that
should be avoided when selecting consistent highly reflective regions (Fig. 3).

                                                                     5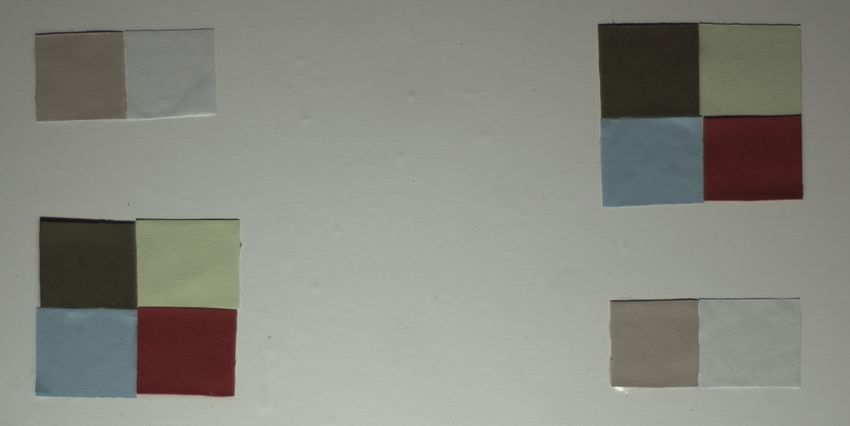
Figure 3: Snapshots of the RTITool interface during the annotation of reflective spheres (left) over the maximum image estimated from the MLIC
stack, and the annotation of the Lambertian frame performed on the minimum image estimates from the stack (right).

3.2. Perspective Light direction estimation
       In the general case of free-form RTI acquisition without known lights, we compute the highlight-based light
direction by releasing the orthographic projection hypothesis used in previous classic solutions [3] and implemented
in the well-known RTIBuilder package. This allows the computation of light direction when the reflective spheres are
at the margin of the image and appear relevantly distorted (elliptical) in the image.
       In the current algorithm and implementation, we assume known intrinsic parameters of the camera: optical center,
o~x , o~y , pixel size, s~x , s~y , and focal length f~. They are loaded from files in the software tool. However, if we have
a scene with multiple reflective spheres, we could, in principle, exploit them also to calibrate the camera including
distortion parameters [40]. We plan to include this feature in future version of the package.
       Once we have identified the projected sphere outline, that is an ellipse, we can easily locate the extrema of the
major axes, with known coordinates in camera frame ~p = ((p x − o x )s x , (py − oy )sy , f ) and ~q (Fig. 4). Note that
the knowledge of the pixel size s~x , s~y is not necessary. We can only add knowledge of aspect ratio s to the focal
length expressed in pixels. From ~p and ~q, we can easily compute the direction of the vectors ~a, ~b pointing to the
corresponding tangent points on the sphere P,          ~ Q~

                                                                     ~ p − Ok
                                                          ~a = (~p − O)/k~ ~

                                                          ~b = (~q − O)/k~
                                                                     ~ q − Ok
                                                                           ~
                                                                                       ~
                                                ~ pointing to the center of the sphere C:
This also allows us to estimate the unit vector w

                                                          ~ = (~a + ~b)/k~a + ~bk
                                                          w
                 ~ C~ P
    The triangle O    ~ has known angles arcsin(~a · w
                                                     ~ ), arccos(~a · w
                                                                      ~ ), π/2) and a known side R. We can, thus, estimate the
distance D of the sphere center from the camera center, and the coordinates of the sphere center in camera coordinates
C = D~ w.
    Since we have multiple spheres on a plane, we can then estimate the plane orientation/position from the estimated
centers with a simple fit.
    Once we estimate the position of the projected highlight ~h, we can solve for the 3D highlight position and the light
direction estimation, by computing the view unit vector

                                                           ~v = (~o − ~h)/k~o − ~hk

and the equation of the line from the origin to the highlight
                                                                  ~ = −t~v
                                                                  X
                                                                      6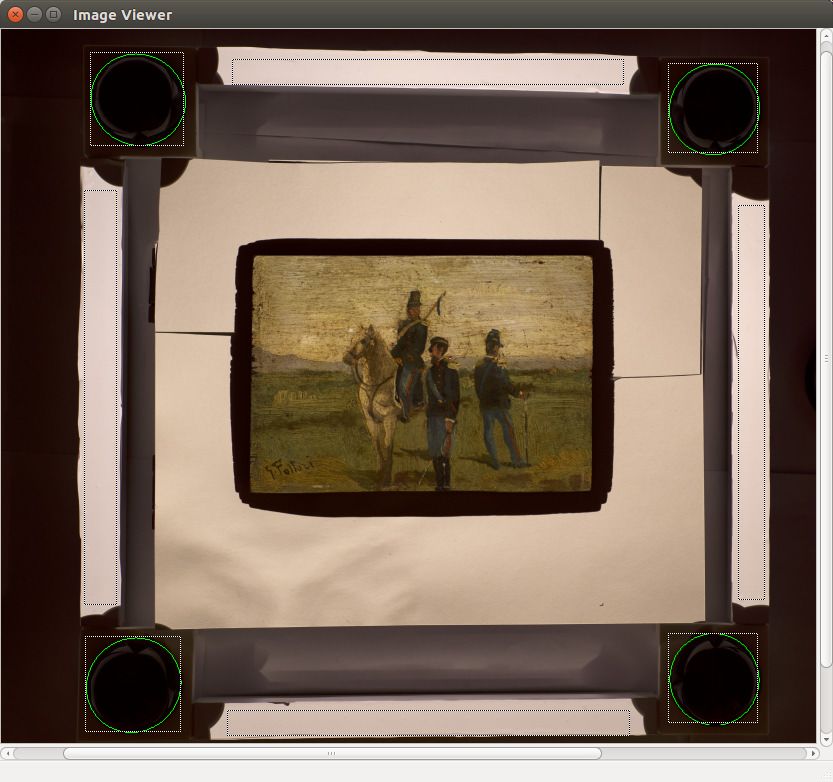
Figure 4: Light direction can be easily computed also assuming releasing the orthographic projection constraint.

   Solving the equation system that combines this equation and the sphere equation

                                           (X1 − C1 )2 + (X2 − C2 )2 + (X3 − C3 )2 = R2
                                                                                             ~ The unit normal in the
we can find two intersections. The one closest to the origin is the highlight position in 3D H.
point is then
                                                     ~ − C)/k
                                               ~n = (H    ~ H   ~ − Ck
                                                                     ~

and reflecting ~v with respect to ~n we can estimate the light direction ~l.
   In our tool, we implemented this algorithm coupled with a simple ellipse detector based on local image binarization
and ellipse fitting obtained with OpenCV implementation of Fitzgibbon’s method[41].

3.3. Multiple spheres setup and light direction interpolation
    By putting a sphere at the margin of the image, we reduce the odds that it casts shadow on the object. The
perspective model allows us to do this even in non-ideal conditions and wide field of views.
    For most light sources, in addition, the assumptions of a parallel and uniform beam across the entire scene is also
far from being fulfilled, and errors introduced in this case are not negligible, as shown in the experimental section.
We, therefore, strive to obtain, when possible, a better per-pixel light direction estimation by using multiple (typically
four) spheres placed close to image corners, estimating directions for the various highlight positions, and linearly
interpolating estimated light direction across the image.
    If this configuration is chosen, rather than just estimate and store a light direction for each image, we estimate
for each image the coefficients of a linear interpolation of the directions that are later used to recover per pixel light
direction values. Coefficients are saved in our specialized data structure (appearance profile array, APA) and used to
support a better estimation of reflectance parameters.

                                                                     7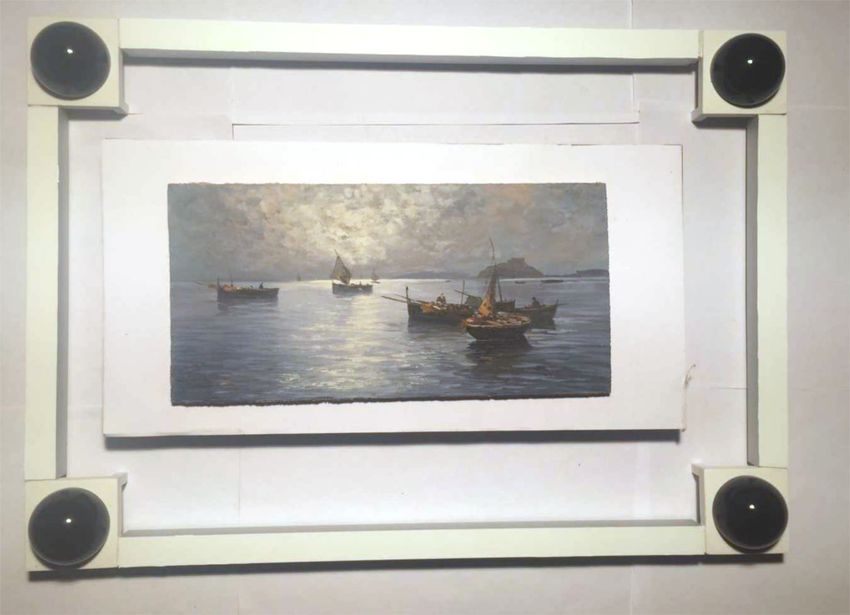
(a)                                         (b)                                         (c)

                                        (d)                                                          (e)

Figure 5: Intensity correction procedure of image with only white background: from the annotated planar frame (not visible in the cropped image)
at the border of the original image (a), a polynomial estimate of the illumination in the whole image is performed (b), and used to estimate a
corrected image (c). Intensity profiles along the central line and column in the original and corrected images are compared in (d),(e).

3.4. Light intensity correction
    The non-uniformity of the beam intensity can be reasonably corrected with a solution that can be applied in
many practical acquisition scenarios. The idea, here, is to place a planar frame around the object of interest, with an
approximately Lambertian coating. By detecting the region in the images where the target is illuminated, excluding
the parts that can be shadowed in some images, we can use the measured pixel values on the target to calibrate the
pixel values on the acquired objects, in order to simulate an acquisition made with a truly constant light intensity, at
least on the plane of the frame. Ideally, for a Lambertian surface, the brightness of the region should be constant (if
the light direction is constant). In practice, we measure a non-negligible non-uniformity using common lights and
cameras, due to non-uniformity of the light beam, as well as to vignetting effects of the lenses.
    By fitting a polynomial function of the light direction over the brightness estimated in the frame regions, we
can compute a correction factor for the estimated light, making the image illuminated as if the light intensity has a
standard reference value, and the local light direction estimated at each pixel location (we obtain this by weighting
the expected Lambertian reflectance of paper by the actual local cosine factor). This light normalization can correct
different non-uniformity causes. Of course it assumes that the light intensity is not changing with depth in the region
of interest. Since beam variations are expected to be smooth, we use a quadratic interpolation of the reflectance to
extend the reference illumination to the entire plane of interest starting from the reference values on the target. It
should be noted that even if the current software fits a quadratic model, a more complex function will be investigated
in the future. Fig. 5 shows the effect of the correction procedure in an image with only a planar diffusive surface
(spheres and calibration frames were outside the cropped region of interest). The procedure successfully flattens the
intensity profiles due to spotlight shape and vignetting.

3.5. Appearance profile array files storage
    In order to simplify data processing steps, we store the data stack after in a reorganized array structure, where all
the per-pixel information is represented sequentially to allow model fitting or pixel processing without the necessity
of loading all the data in memory or to allocate large array in processing software. The file structure used (appearance
profile array, APA) is composed of a header and data section. The header describes the encoding choices (8 or 16
bits, RGB or chromaticity+luminance, constant or interpolated light directions) and the light direction information
(vector elements or interpolation coefficients). The data section stores pixel values in a 3D array. Fig. 6 shows the
information encoded in appearance profile: all the brightness information of a pixel location is stored together and
can be represented in l x , ly coordinates and interpolated for a better display. The shape of the resulting function is
characteristic of both shape and material properties. We tested both Delaunay Triangulation based interpolation and

                                                                       8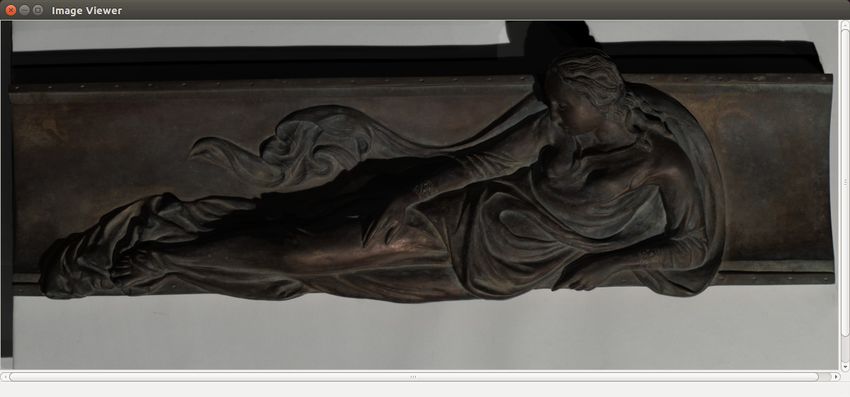
Figure 6: Appearance profile visualization using Delaunay Triangulation based interpolation of the intensity values at the pixel location in the l x , ly
plane.

Radial basis functions to obtain visualizations of the local appearance map. Using these interpolation algorithms,
relighted images can thus also be directly displayed without the need for simplified parametric representations of the
local reflectance as a function of light direction.

3.6. MLIC data basic processing: Photometric stereo, PTM/HSH fitting
    Apart from creating relighted images with interpolation in the light direction space, the MLIC stacks encoded
as (intensity-corrected) appearance profiles can be processed with the standard algorithms
                                                                                                 used to recover shape and
reflectance parameters. Given for each pixel the light direction l x (i), ly (i), lz (i) and the (corrected) reflectance L(i)
known for N light directions ~l(i), basic Photometric Stereo estimates albedo a and normals ~n assuming the Lambertian
model and solving the overconstrained system
                                                       h             ih                      iT
                                               L(i) = a n x , ny , nz l x (i), ly (i), lz (i) i = 1...N                                              (1)

     PTM fitting approximates the reflectance function with a polynomial function, also using a least squares solution
to find coefficients. The classical form [10] is
                                                        h                                                  iT
                                 L(i) = a, b, c, d, e, f l2x (i), ly2 (i), l x (i)ly (i), l x (i), ly (i), 1

                                                                                                                   (2)

    but different polynomial function have been proposed, as well as different fitting functions, such as Hemispherical
Harmonics or Discrete Modal Decomposition [12, 13]. Implementing different function fitting is quite simple, and
their ability to represent the real reflective behavior of the material depends clearly on the kind of material analyzed.
    Furthermore, it must be considered that non-local effects, such as interreflections and projected shadows, create
local anomalous behaviors of the laws directly linking light angle and reflected color. To cope with these effects, and
also to separate diffusive behavior from specular highlights, robust fitting methods have been proposed [42, 43], trying
to remove outliers from the parameters estimation procedure.

4. Simple tools for RTI data processing

   We designed two software tools to process image stacks captured by a camera in RTI settings.
   The first tool, RTITool, is aimed at performing all the preprocessing steps to transform acquired images to appear-
ance profile array data cropped in the region of interest, prepared so that they can be used easily to estimate normals,
                                                                           9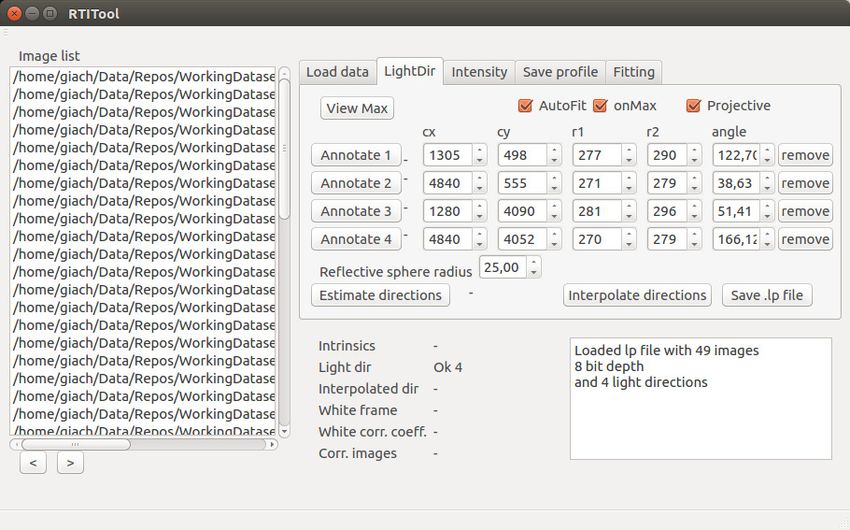
Figure 7: Annotation of reflective spheres on a synthetic dataset. With the orthographic assumption, automatic segmentation is not accurate and
annotated circles cannot, in any case, match exactly the real object contours (left). With the perspective mode the segmentation is more accurate,
and this results in a quite higher accuracy of the estimated light direction, as shown in Sec.5.1

relightable images and feature maps both with our own tools or other photometric stereo and RTI fitters. RTItool takes
as input image and calibration information, and is able to perform all the calibration steps described in the previous
section to cope with the difficulties of free-form acquisitions.
     The second tool, APTool, is aimed at processing appearance profile array data using different algorithms, creating
and exporting albedo, normal maps, relightable RTI files (e.g., PTM files), as well as displaying derived images (multi-
light image enhancements, relighted images from novel illumination directions) on a canvas window. Both tools are
still a work in progress, but current versions, with all the capabilities described in the paper are available at the web
site http://www.andreagiachetti.it/rtitools. Code has been developed on a Linux platform, but, as it has been realized
in C++ using Qt and OpenCV libraries, it could be easily ported on a variety of computing architectures.

4.1. RTITool
    This program allows the user to load image sets, both trough image lists or through files with filenames and
associated light directions typically used in current RTI tools. Users can then perform all the processing pipeline with
various option, working with both 8-bit and 16-bit depth images and generating APA files for the entire image size
or cropped regions. The interface is designed to simplify all the annotating tasks. For example, in order to easily
annotate reflective spheres, annotation and automatic fitting algorithms are by default done on the maximum image,
showing the highest luminance pixels over the stack, removing shadows and evidencing the black object (Fig. 3, left).
In the same way, the annotation of the white frame is done by showing the minimum image, displaying the lowest
per-pixel luminance, so as to easily avoid annotating regions that can be shadowed from some light directions (Fig. 3,
right).
    The annotation of reflective spheres is semi-automatic. The user is asked to draw a rectangle including each sphere
image. The circles (in case of orthographic assumption) or the ellipses (in case of perspective) are automatically
estimated and drawn. Users can also visually refine the segmentation by interactively changing the curve parameters
on the interface. Fig. 7 shows the inaccuracy of classical circular annotation (left), fixed on the same image by the
ellipse fitting. In both cases, light directions can be estimated and stored. Note that even an apparently small deviation
from the orthographic model, as the one shown in the figure, may result in an increase of one order of magnitude of
error in light direction estimation (see Sec.5.1).

4.2. APTool
    The processing of the raw MLIC stack performed with the RTITool ends by the storage of the data structure
allowing the sequential processing of pixel information (light directions and associated corrected or non corrected
                                                                       10
intensity values). This information can be used to estimate normals and albedo using photometric stereo, creating
novel relighted or enhanced images by interpolating or mixing the different pixel values, fitting reflectance models
storing relightable images like PTM or HSH standard files, and more. We developed, for these purposes, a second
software tool called APTool, which loads preprocessed arrays and allows the generation of normal and albedo maps
derived from PS or the estimation of PTM coefficients. Robust versions of the fitters are also available. The idea
is to include, in the future, different fitting and visualization algorithms to the software in order to support different
kinds of end-user applications. Apart from fitting models and saving classical RTI files, the tool currently allows
direct visualization of relighted images given a novel light direction, through direct interpolation of samples based on
radial basis functions (Fig. 8). By selecting image locations (single points or rectangular regions), it is also possible
to visualize a 2D intensity map represented in l x , ly space of the local appearance profile, obtained by scattered data
interpolation of the known samples (Fig. 8(b)). We have experimented with a Delaunay triangulation based and a
Radial Basis Function interpolation of the samples, and provide an RBF implementation in the delivered tool.
(a)
(b)
Figure 8: APTool used to show directly a Radial Basis function interpolation simulating direct relighting from (l x = 0.5, ly = −0.5) (a) and from
(l x = −0.5, ly = 0.5) (b). In the second case, we also selected and compared AP profiles in selected image points.
5. Experimental results
In order to demonstrate the usability of our pipeline and the effects of new algorithms, we performed a series of
experiments covering different kinds of MLIC capture and processing. Our tests include both synthetic datasets and
11(a) Synthetic MLIC with directional lights
(b) Synthetic MLIC with spot lights
Figure 9: (a) Two images of a synthetic dataset simulating a white plane with some large bumps and 4 reflective spheres, acquired by a fixed camera
under different parallel and constant illumination. (b) Two images of a synthetic dataset with the same geometry, but illuminated by simulated spot
lights.
real-world ones. The real-world experiments were performed using a DSLR Nikon D810 camera with an architecture
based on a CMOS sensor with removed IR cut-off filter. The size of the sensor is 36x24mm and the spatial resolution
of the full format image area is 36MP. To the digital camera a full frame AF-S FX Nikkor 50mm f/1.8G lens was
attached. As in this paper we present results using visible light, an IDAS-UIBAR III optical filter was used to gather
only the signal from the visible range of the electromagnetic spectrum. The sensor of the digital camera was checked
for linearity, by taking images covering a wide range of exposures, from very low to very high and then plotting the
brightness as a function of exposure. The camera was geometrically calibrated by computing the intrinsic parameters,
two radial and two tangential distortion coefficients with the GML Camera Calibration Toolbox. However, any other
calibration tool can be used for this purpose.
5.1. Accuracy of light direction estimation
In order to evaluate the errors in light direction estimation when the orthographic camera model is not perfectly
followed, we created a synthetic RTI dataset by rendering a scene with 4 reflective spheres near image corners, placed
on top of a white Lambertian surface not exactly perpendicular to the camera axis, and with some spherical bumps,
illuminated with perfectly parallel rays along 50 known directions (Fig. 9 a) or with the same number of simulated
spot lights (Fig. 9 b). Using RTItool, we annotated the elliptic sphere profiles and estimated the light directions at each
sphere position as described in Sec. 3.2. We compared the results with those obtained with our tool in the orthographic
approximation, by annotating the circle circumscribed to the ellipse. We also compared our results with those obtained
similarly with the widely used RTIBuilder package [21]. Note that the circular annotation cannot be precise, as the
sphere mask is actually elliptic, as shown in Fig. 7, and this happens in most real images.
A comparison of the errors obtained (difference between the average of the four sphere estimations and ground
truth) reveals that, despite the limited eccentricity of the ellipses, with the perspective model we have the error reduced
by an order of magnitude. The average errors for the 50 directions of Fig. 9 a are, in fact, 0.02 radians for the per-
12Figure 10: Angular errors due to wrong orthogonal camera assumption can be quite relevant. The use of a perspective model makes the values
quite accurate.
spective estimation, 0.21 for the orthographic estimation done with RTITool, and 0.23 for the orthographic estimation
done with RTIBuilder. Fig. 10 shows errors for each of the 50 single light directions sorted by elevation.
The local accuracy of light direction estimation is then improved by estimating local values by interpolating the
values of the sphere at the corners. In order to show the amount of error reduction, we conducted two experiments.
First, we created another synthetic dataset similar to the previous one, but where the images are illuminated with
simulated spot lights approximately pointed towards the center of the target. Light direction and intensity for each
pixel are thus not uniform, as in most typical real-world scenarios. In this case, the per pixel average error in the
constant estimation (average of the values of the four spheres) is significantly higher than the error value coming from
interpolation. Fig. 11 shows the average errors for the single images plotted versus elevation angle of the spotlight
orientation. With interpolation, the error, averaged on all pixels of all images, is reduced from 0.17 to 0.05 degrees.
We also performed experiments on a real acquisition of a calibration target. In this case, we captured images of
a flat plane perpendicular to the camera axis, putting four reflective spheres at the corners of the image area and a
fifth in the center. In the set of images captured, the average difference between the direction measured in the top left
corner and the one measured in the image center was 0.146 radians. Fig. 12 shows that, for small elevation angles, the
error is higher due to the larger effect of quantization error in highlight localization. If we estimate a per-pixel linear
interpolation of light direction, we reduce the average error to 0.121 radians.
Angular err (rad) Std. Dev
Single Directions, no light correction 0,482 0,271
Interpolated directions, no light correction 0,417 0,249
Single Directions, light correction 0,262 0,188
Interpolated directions, light correction 0,252 0,183
Table 1: Angular errors reduction in per-pixel normal estimation with Photometric Stereo on the synthetic ”spotlight” dataset of Fig. 9 b using
interpolated light direction estimation and intensity correction.
13Figure 11: Angular errors of light direction estimated on a sphere with respect to real one in the simulated ”spotlight” dataset of Fig. 9 b, plotted
against elevation of the principal ground truth spotlight direction. Interpolation strongly increase the average accuracy of the per-pixel estimation.
5.2. Accuracy of normal reconstruction
The improved per-pixel light direction estimation and the procedure to correct illumination increase the quality
of the MLIC-based reconstructions, as demonstrated, for instance, by our tests with Photometric Stereo and normal
estimation. Using the same simulated dataset with spotlight illumination, we estimated surface normals (and albedo)
by solving the classical least-squares problem under the assumption of Lambertian surfaces. We then compared per-
pixel reconstructed normals with the ground truth values. Table 5.1 shows that the average angular error is strongly
reduced both by the light direction interpolation and the light intensity correction.
The effects of light correction can be also appreciated when reconstructing normals of challenging real-world
objects from MLICs using Photometric Stereo. To show this, we acquired images of a set of coins placed over a flat
background. We used our reconstruction pipeline and the RTITool to recover the appearance profile arrays and then
used our APTool to reconstruct normal maps.
The set is composed by a bronze Roman coin (quadrans) dated 9 B.C. and damaged by scratches, and two 10 cent
Italian coins. One exemplar, dated 1931 is made of copper and is severely degraded, while the second exemplar, dated
1939, is made of a special alloy with nickel, called Bronzital, which has been used to improve corrosion resistance.
Normal maps obtained with Photometric Stereo have been compared with an (approximate) reference solution
derived from a high resolution 3D reconstruction of the same coins made with an optical microprofilometer based
on conoscopic holography [44]. This device is able to capture reliable profilometric measurements down to the scale
of micron on different kinds of materials, reflective or diffusive. Our microprofilometer is based on an Optimet
conoscopic probe mounted on sub-micrometric linear stages in order to scan a region up to 30x30cm2 in one session.
Reference coin models have been reconstructed with a transversal resolution (XY grid) of 50 microns.
Depth maps derived from these models were finally registered with the estimated RTI normal maps using a sim-
ilarity transform optimized to match the correspondence of manually selected points (12 landmarks). This initial
registration was then refined by locally optimizing mutual information in image space.
Fig. 13 shows the three coins and the related differences between RTI-based normal maps and the reference
normal maps estimated from microprofilometric data, both in case of non-corrected image brightness, and with the
light correction procedure described in Sec. 3.4. It is evident that light correction sensibly improves the reconstruction
quality, as quantitatively reported in Table 5.2. The light correction procedure reduces the median errors, on average,
by 27%.
14Figure 12: Angular difference of the direction estimated on a sphere near the corner with respect to the one estimate on a sphere near the image center
(blue dots), plotted as a function of elevation for a complete MLIC scan (50 photos). Replacing the corner estimate with the linear interpolation of
the four corner values in the central position, we can get reduced errors (red squares).
Median angular distance (rad.)
Non-corrected Corrected
Bronzital 10c 0.117 0.079
Copper 10c 0.068 0.053
Quadrans 0.171 0.108
Table 2: Median angular distances of the RTI estimated normals from the reference microprofilometer normals. The calibration procedure reduces
the errors on average of 27 percent.
5.3. Recovery of reflectance properties of materials
Our intensity correction methods are also important to better recover material properties. To demonstrate this fact,
we placed a matte paper target with different albedo regions in different positions on a flat planar background (Fig.
14).
If we visualize the interpolated appearance profiles estimated on a pixel in a selected region, in this case with
flat perpendicular surface and approximately Lambertian behavior, we should see a function that, represented in l x , ly
coordinates, should present a regular and symmetric function. Fig. 15 shows that plots of interpolated appearance
profiles on non-corrected images are not symmetric and different in different regions of the same material if images
are not corrected with our procedure. Conversely, light correction results in profiles similar to those expected and
similar in different parts of the image where the material is the same.
This effect can be quantitatively measured by evaluating the average albedo of the patches of the same paper types
put in two different positions in the scene of Fig. 14. Without corrections, the albedo of paper patches of the same
type placed in different image position differs up to 7%. The difference is strongly reduced with the light direction
and intensity correction procedure, as shown in Table 5.3.
By matching the reflectance of the Lambertian frame to a reference value, we can also estimate the consistency of
albedo measurements among different image captures. Table 5.3 shows that the measurements obtained in a second
acquisition are largely different (often more than 30% of the value), even if a similar protocol and the same light
source has been used. It is actually sufficient to change the distance of the source to have different results. However,
the use of the correction procedure results in similar albedo values (difference lower than 2.5% of the value)
15Figure 13: Angular errors. Color-coded angular errors (degree) of RTI estimated normals wrt ground truth from microprofilometry. Left: non-
calibrated results. Right: results with light calibration.
Another important effect of the light correction procedure is the repeatability of reflectance parameters estimation
in different MLIC captures without light calibration. Table 5.3 shows the albedo of the same paper types of the
previous experiment estimated on a different MLIC capture of a plane with paper targets glued on it. Without light
correction, the light intensity is quite different, even if we tried to use a similar configuration. Clearly a small difference
in light distance results in different illumination and estimated albedo. The light correction procedure, by contrast,
makes the estimated parameters similar.
Processed RTI data is often used to segment different materials not easily recognized in color images [18]. Such
kind of results can be improved by our light correction procedures. To show this, we have performed two RTI acquisi-
tions of a polished silver sample partially covered by a coating, see Fig. 16(a), and applied unsupervised classification
to segment regions with or without coating. For each RTI sample, we compute a 7-dimensional descriptor of a 30
pixels neighborhood. The descriptor is the average albedo value, to account for material color, plus the 6 standard
deviations of the standard RTI polynomial coefficients, to account for the roughness of the sample surface.
Unsupervised classification is achieved by performing two-class k-means clustering. We measured the similarity
of the classification outcomes obtained from the two different acquisitions, without and with light calibration, see
Fig. 16. The only difference between the two acquisitions of the same sample is the different lighting pattern caused
by the free-form approach. The coated area is in red, while the uncoated area is in green. In the absence of light
calibration, the clustering outcome is unstable, as it has only a 20% overlap, while, by performing light calibration,
16Figure 14: Three images of a MLIC capture of a planar surface with flat paper targets with different albedo regions.
Albedo Albedo
std std diff/mean
Pos. 1 Pos.2
corrected 0,557 0,003 0,559 0,004 0,39%
Paper1
non-corrected 0,726 0,009 0,708 0,009 2,53%
corrected 0,406 0,003 0,411 0,003 1,38%
Paper2
non-corrected 0,515 0,007 0,539 0,018 4,54%
corrected 0,391 0,003 0,391 0,005 0,17%
Paper3
non-corrected 0,501 0,009 0,514 0,007 2,73%
corrected 0,157 0,004 0,156 0,003 0,55%
Paper4
non-corrected 0,206 0,005 0,203 0,006 1,30%
corrected 0,551 0,003 0,545 0,005 1,08%
Paper5
non-corrected 0,734 0,008 0,685 0,010 6,96%
corrected 0,138 0,006 0,135 0,003 2,10%
Paper6
non-corrected 0,184 0,004 0,173 0,007 6,18%
Table 3: Albedo measured on planar patches of the same material can be quite different in different image regions if estimated with classic
photometric stereo on non-corrected multi-light image stacks. Our brightness and light-direction correction procedures clearly result in more
consistent values.
we improve it up to 99.5% of pixels that have been assigned to the same class, showing that with our approach
free-form RTI can be used for surface characterization.
5.4. Visual analysis of RTI enhancements
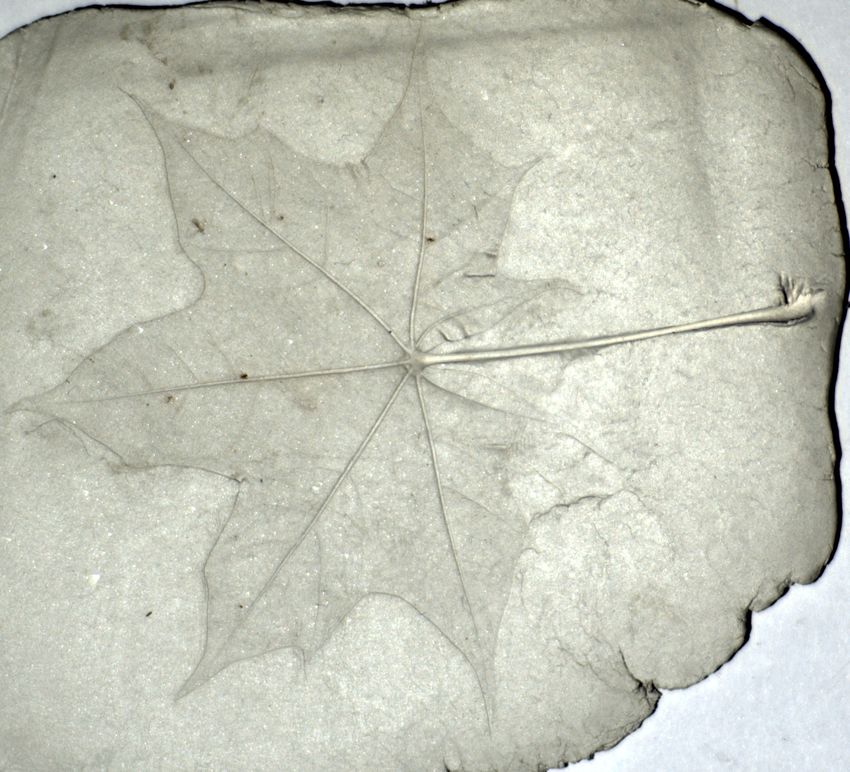
The typical use of MLIC data done in the Cultural Heritage domain consists in estimating relightable images
and analyzing them to improve the visualization of object details. To simulate this application, we created a mock-
up of a complex structure with fine relief details by imprinting a leaf on modeling paste, then acquiring the photos
with our pipeline supporting light correction. We exported both corrected and non corrected appearance profiles
with RTITool and estimated and exported PTM files with APTool. The files have been analyzed with RTIViewer to
visualize interesting detail [21]. Fig. 17 shows a detail of a relighted image with the specular enhancement proposed
in [10]. The result on top right is obtained from the non-corrected data, while the one on the bottom right is obtained
with the corrected pipeline. In the corrected images, it is possible to appreciate a better enhancement of detail and a
clearer visualization of nervatures and scratches, hardly visible on the uncorrected image.
This effect is even more visible in the example of Fig. 18, where specular enhancements obtained from PTM fitting
of the non-corrected and corrected appearance profiles derived from the acquisition shown in Fig. 2(b) are compared.
The correction leads to a much better visualization of brush strokes.
Looking at PTM-based relighting, it is interesting to note that even if light calibration ensure a better quality of
enhancements due to the improved normals, the removal of specular components results in loss of possibly relevant
information about the imaged object. This can be seen comparing relighted PTMs with corresponding relighted APA
visualized with our tool. Fig.19 shows this on the painting detail. PTM-based relighting represents similarly regions
where the surface has different specular behavior and the perception of depth is reduced by the absence of specular
effects, visible in RBF interpolation.
We plan, therefore, to investigate on possible improvements of interactive direct visualization of APA information
and on the development of novel enhancement methods that can be directly implemented in the APTool to allow
17Figure 15: Appearance profiles corresponding to the same material on flat patches are similar and regularly shaped when computed on light-
corrected images (bottom), while are irregular when lighting is not uniformed (top)
a better visual analysis of the information hidden in RTI stacks. PTM or HSH encodings are useful as they allow
compact storage of relightable images, but, imposing a drastically simplified reflectance model discarding relevant
information, they may result in information loss that may create serious problems to the subsequent surface analysis.
Our plan is to use smart compression techniques to obtain a compact representation of the full APA information
allowing an easier handling and more efficient direct visualization.
6. Discussion
Highlight RTI is quite popular, especially in the Cultural Heritage domain, to the point that it may be considered
one of the most successful computational photography techniques in that domain. It can be realized with a simple
camera, a simple light source and one (or more) reflective spheres. However, the framework commonly used for this
task has some limitations, and this can result in a low degree of repeatability of measurements, as well as in a poor
quality of extracted information, leading, in some cases, to the impossibility of effectively using the technique.
In this article, we have shown that, with slight modifications of the standard acquisition setup, it is possible to
significantly improve the quality of the fusion of a multi-light image collection, achieving a better reconstruction of
shape and material properties of the scene, as well as an improved quality of relightable images. Our approach realizes
a sort of integration of the classic H-RTI technique, usually based on uncalibrated lights and qualitative analysis, with
the Material Capture and Photometric Stereo approaches targeted at accurate shape (and reflectance) reconstruction,
but usually requiring very high-density acquisitions and/or light and camera calibration.
As with all practical setups, the proposed approach has also some limitations. First of all, the necessity of placing
more targets near the object, and the fact that we assume that the object to be imaged is mostly planar. The latter
18Albedo Albedo
diff/mean
MLIC 1 MLIC 2
corrected 0,558 0,548 1,81%
Paper1
non-corrected 0,717 0,518 32,25%
corrected 0,409 0,404 1,18%
Paper2
non-corrected 0,527 0,393 29,23%
corrected 0,391 0,385 1,60%
Paper3
non-corrected 0,508 0,381 28,45%
corrected 0,156 0,156 0,23%
Paper4
non-corrected 0,205 0,155 27,64%
corrected 0,548 0,536 2,22%
Paper5
non-corrected 0,710 0,510 32,77%
corrected 0,136 0,139 2,06%
Paper6
non-corrected 0,178 0,135 27,84%
Table 4: Albedo values measured on a different acquisition of the same material patches of Table 3. The correction procedure results in similar
values for similar materials.
assumption is, however, typically true in H-RTI applications, and can be resolved with the same iterative techniques
applied in PS settings. Moreover, in our current implementation, using our custom designed frame with the four
spheres and the coated aluminum bars, the size of the object to be captured is limited to a range from about 50x50 cm
to 1mx1m. For larger sizes, the placement of co-planar Lambertian targets to estimate the correction may be difficult
in on-site acquisitions. We are investigating, however, different light correction methods that may take into account
depth variations of the illumination. We are also investigating improved interpolation methods tuned for standard spot
lights.
Our current work focuses on the finalization and testing of our processing tools, that will be freely available for
the scientific community.
We are also investigating novel techniques for shape and material reconstruction, as well for feature detection
from MLIC. A challenging problem is, for example, the development of robust fitting techniques able to recover ma-
terial reflectance information independently from shape. Apart from the difficulty in modeling reflectance, releasing
hypotheses of Lambertian behavior, it is also necessary to consider that pixel information is not always depending
only on local shape and reflectance, but also to global effects like inter-reflections and projected shadows. The use
of classic outlier removal procedures, proposed in previous works [43], may be problematic due to the relatively low
number of samples and more specific heuristics for outlier rejection may be more effective.
Acknowledgments
This work was partially supported by the Scan4Reco project funded by European Union’s Horizon 2020 Frame-
work Programme for Research and Innovation under grant agreement no 665091 and by the DSURF project (PRIN
2015) funded by the Italian Ministry of University and Research. We also acknowledge the contribution of Sardinian
Regional Authorities under projects VIGEC and Vis&VideoLab. The authors wish to thank Opificio Delle Pietre
Dure, Vittorio Barra and Alberto Dal Chiele and for providing the artworks shown in our experiments.
References
[1] R. Basri, D. Jacobs, I. Kemelmacher, Photometric stereo with general, unknown lighting, International Journal of Computer Vision 72 (2007)
239–257.
[2] C.-H. Hung, T.-P. Wu, Y. Matsushita, L. Xu, J. Jia, C.-K. Tang, Photometric stereo in the wild, in: 2015 IEEE Winter Conference on
Applications of Computer Vision, IEEE, 2015, pp. 302–309.
[3] M. Mudge, T. Malzbender, C. Schroer, M. Lum, New reflection transformation imaging methods for rock art and multiple-viewpoint display.,
in: VAST, volume 6, Citeseer, 2006, pp. 195–202.
19You can also read


