A hidden layer of structural variation in transposable elements reveals potential genetic modifiers in human disease-risk loci
←
→
Page content transcription
If your browser does not render page correctly, please read the page content below
Downloaded from genome.cshlp.org on June 22, 2022 - Published by Cold Spring Harbor Laboratory Press

Research

A hidden layer of structural variation in transposable
elements reveals potential genetic modifiers in human
disease-risk loci
Elisabeth J. van Bree,1,8 Rita L.F.P. Guimarães,1,2,3,8 Mischa Lundberg,4
Elena R. Blujdea,1 Jimi L. Rosenkrantz,1 Fred T.G. White,1 Josse Poppinga,1
Paula Ferrer-Raventós,1 Anne-Fleur E. Schneider,1 Isabella Clayton,1 David Haussler,5
Marcel J.T. Reinders,6 Henne Holstege,2,3,6,7 Adam D. Ewing,4 Colette Moses,1
and Frank M.J. Jacobs1,7
1
  Evolutionary Neurogenomics, Swammerdam Institute for Life Sciences, University of Amsterdam, 1098 XH Amsterdam, The
Netherlands; 2Genomics of Neurodegenerative Diseases and Aging, Department of Human Genetics, Amsterdam Neuroscience, Vrije
Universiteit Amsterdam, Amsterdam UMC, 1081 HV Amsterdam, The Netherlands; 3Alzheimer Center Amsterdam, Department of
Neurology, Amsterdam Neuroscience, Vrije Universiteit Amsterdam, Amsterdam UMC, 1081 HV Amsterdam, The Netherlands;
4
  Mater Research Institute—University of Queensland, Woolloongabba, QLD 4102, Australia; 5UC Santa Cruz Genomics Institute,
and Howard Hughes Medical Institute, UC Santa Cruz, Santa Cruz, California 95064, USA; 6Delft Bioinformatics Lab, Delft University
of Technology, 2628 XE Delft, The Netherlands; 7Amsterdam Neuroscience, Complex Trait Genetics, University of Amsterdam,
Amsterdam, The Netherlands

        Genome-wide association studies (GWAS) have been highly informative in discovering disease-associated loci but are not
        designed to capture all structural variations in the human genome. Using long-read sequencing data, we discovered wide-
        spread structural variation within SINE-VNTR-Alu (SVA) elements, a class of great ape-specific transposable elements with
        gene-regulatory roles, which represents a major source of structural variability in the human population. We highlight the
        presence of structurally variable SVAs (SV-SVAs) in neurological disease–associated loci, and we further associate SV-SVAs
        to disease-associated SNPs and differential gene expression using luciferase assays and expression quantitative trait loci data.
        Finally, we genetically deleted SV-SVAs in the BIN1 and CD2AP Alzheimer’s disease–associated risk loci and in the BCKDK
        Parkinson’s disease–associated risk locus and assessed multiple aspects of their gene-regulatory influence in a human neu-
        ronal context. Together, this study reveals a novel layer of genetic variation in transposable elements that may contribute to
        identification of the structural variants that are the actual drivers of disease associations of GWAS loci.
        [Supplemental material is available for this article.]

Discovering the genetic variation underlying human diseases is a                    together constitute >42% of the human genome (Smit 1999;
common goal in human genetics, and the rapid increase of ge-                        International Human Genome Sequencing Consortium 2001;
nome-wide association studies (GWAS) has generated a vast cata-                     Audano et al. 2019; Linthorst et al. 2020). Although the vast major-
log of single-nucleotide polymorphisms (SNPs) associated with                       ity of TEs do not alter coding regions of our genome, some TE clas-
specific traits and diseases (MacArthur et al. 2017). In most cases,                ses harbor strong gene regulatory potential that can directly affect
GWAS do not identify the genetic variation that drives the trait                    gene expression levels (Jacobs et al. 2014; Wang et al. 2014;
but use SNPs as markers to highlight trait-associated loci through                  Chuong et al. 2016; Fuentes et al. 2018; Pontis et al. 2019). The
linkage disequilibrium (LD) (Edwards et al. 2013). This calls for                   TE-mediated regulatory effect on genes is highly tissue-specific
elaborate post-GWAS analysis to shed light on the genes and                         and has been shown to be particularly prominent in a neuronal en-
mechanisms involved in specific traits (Backman et al. 2021;                        vironment (Jacob-Hirsch et al. 2018; Trizzino et al. 2018; Pontis
Mortezaei and Tavallaei 2021). A comprehensive view of the genet-                   et al. 2019; Miao et al. 2020; Sundaram and Wysocka 2020). TEs
ic structural variants that exist within loci containing trait-associ-              are activated during aging, neurodegeneration, and neurological
ated SNPs is an essential first step to assessing how these variants                diseases, but whether this is a cause or a consequence of the disease
may lead to disease susceptibility on both genetic and functional                   pathology remains unknown in many cases (Frank et al. 2005; Li
levels (Eichler 2019).                                                              et al. 2013; Van Meter et al. 2014; Guo et al. 2018; Shpyleva
      One source of structural variation that has not been suffi-                   et al. 2018).
ciently considered comes from transposable elements (TEs), which                          Only TEs of the Alu, L1, and SVA (SINE-VNTR-Alu) families
                                                                                    can still actively spread through the genome, and new insertions
                                                                                    cause variation between individuals in the form of presence/
8
  These authors contributed equally to this work.
Corresponding author: F.M.J.Jacobs@uva.nl
Article published online before print. Article, supplemental material, and publi-   © 2022 van Bree et al. This article, published in Genome Research, is available
cation date are at https://www.genome.org/cgi/doi/10.1101/gr.275515.121.            under a Creative Commons License (Attribution-NonCommercial 4.0 Interna-
Freely available online through the Genome Research Open Access option.             tional), as described at http://creativecommons.org/licenses/by-nc/4.0/.

32:1–15 Published by Cold Spring Harbor Laboratory Press; ISSN 1088-9051/22; www.genome.org                                       Genome Research               1
                                                                                                                                     www.genome.org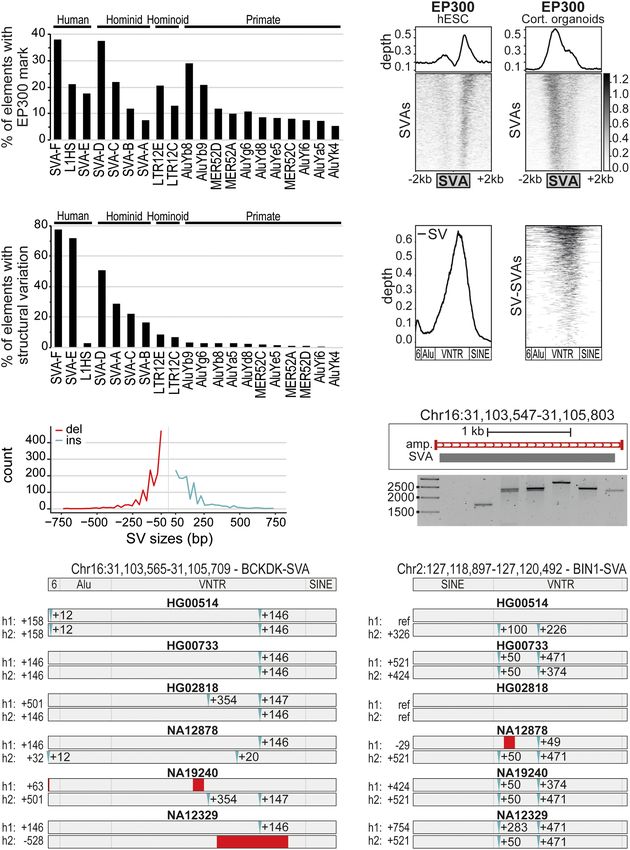
Downloaded from genome.cshlp.org on June 22, 2022 - Published by Cold Spring Harbor Laboratory Press

van Bree et al.

absence TE-insertional polymorphisms (Kazazian et al. 1988;              Results
Batzer et al. 1991; Brouha et al. 2003; Ostertag et al. 2003). TEs
can alter gene regulation in the locus in which they insert, such
that the presence or absence of a TE can lead to inter-individual dif-
                                                                         SVAs are a major contributor to inter-individual
ferences in gene expression. There are approximately 60,475 Alu,         structural variation
10,018 L1, and 6417 SVA TE-insertional polymorphisms known,              In our search for structural variations in TEs that may be associated
with new insertions occurring every 40, 63, and 63 births, respec-       with differential susceptibility to neurological disorders, we first
tively (Feusier et al. 2019; Collins et al. 2020). Some of these new     determined which TEs are likely to play a regulatory role in human
insertions have been linked to diseases (Makino et al. 2007;             neuronal gene expression. We specifically focused on TEs active in
Hancks and Kazazian 2016; Sekar et al. 2016; Payer et al. 2017;          neuronal cells, because previous research has associated aberrant
Payer and Burns 2019; Pfaff et al. 2021). Next to presence/absence       TE activation with several neurological disorders (Frank et al.
TE polymorphisms, structural variation within fixed TEs (TE inser-       2005; Li et al. 2013; Van Meter et al. 2014; Bragg et al. 2017; Guo
tions observed in all individuals in the human population) has           et al. 2018; Shpyleva et al. 2018). To detect TEs that may have a reg-
also been reported (Savage et al. 2013, 2014), although the preva-       ulatory influence on nearby genes in neuronal cells, we performed
lence of this type of structural variation has remained elusive. The     chromatin immunoprecipitation followed by deep sequencing
repetitive nature of TEs increases the propensity for unequal cross-     (ChIP-seq) for the enhancer-associated marker EP300 in human
over events or DNA polymerase slippage during meiosis, for which         embryonic stem cell (hESC)-derived cortical organoids (Eiraku
variable number of tandem repeats (VNTRs) are especially suscep-         et al. 2008; Visel et al. 2009). Highest neuronal EP300 enrichment
tible (Brookes 2013). SVA elements harbor unusually large VNTRs          in TEs was observed for the active classes of TEs in our genome, in-
as their internal segment and have a unique sequence composition         cluding LINEs and all members of the SVA family (Fig. 1A,B). These
compared to other VNTRs in our genome. The structural variation          data support previously published findings in which histone ChIP-
in VNTRs is particularly interesting because they are often associ-      seq showed SVAs become active in a neuronal environment
ated with gene-regulatory functions, and many genes have ac-             (Pontis et al. 2019).
crued VNTRs as essential regulatory elements for their expression               For the top 20 neuronally active TE classes, we analyzed inter-
(International Human Genome Sequencing Consortium 2001;                  individual structural variations. We used data from the recently
Fondon et al. 2008).                                                     published “patched human reference genome assembly” based
      It is becoming increasingly clear that gene-regulatory proper-     on 15 human genomes sequenced by Pacific Biosciences (PacBio)
ties of TEs were co-opted during evolution, leading to the integra-      long-read sequencing (Audano et al. 2019). In this assembly, struc-
tion of TEs as novel gene-regulatory elements in preexisting gene        tural variants of 50 bp or greater identified in any of the 15 individ-
expression networks (Cordaux and Batzer 2009; Chuong et al.              uals were included as alternate loci to improve the representation
2016). As such, TEs have become an integral part of normal human         of allelic diversity in the reference assembly. Whereas a low level of
gene regulation. Because our genome has become dependent on              structural variation was identified for almost all classes, we found
TEs for specific aspects of gene regulation, structural variation        an extraordinarily high level of structural variation in SVA ele-
within fixed TEs could account for inter-individual differences in       ments (Fig. 1C). Almost half of full-length SVAs were structurally
temporal or spatial aspects of gene expression. Despite the possible     variable in the human population. The biggest contribution
roles structurally variable TEs may play in human health or dis-         came from SVA-D, SVA-E, and SVA-F elements, representing the
ease, this level of structural variation has remained largely undoc-     evolutionarily youngest classes of SVAs, which contain the largest
umented. This is mainly a result of technical limitations associated     VNTR region. This region was highly enriched for structural varia-
with the highly repetitive DNA sequences within TEs, which               tions, together with the 5′ region, which contains a hexamer
makes identifying structural variations in TEs using short-read se-      repeat (Fig. 1D; Supplemental Fig. S1A). Most variations observed
quencing strategies extremely challenging. The development of            in SVAs were between 50 and 200 bp (Fig. 1E), but ∼20% of the var-
long-read sequencing techniques provides, for the first time, the        iations were >200 bp in size.
opportunity to accurately assess the level of structural variation              To validate these findings and to assess if any additional struc-
(Eichler 2019). This allows for the evaluation of possible associa-      tural variation in SVA elements was not correctly captured, we
tions between disease susceptibility and specific structural varia-      performed an additional BLAST-alignment-based analysis on five
tions found in fixed TEs in our genome (Audano et al. 2019;              of the PacBio genome assemblies (Supplemental Table S1). We
Chaisson et al. 2019; Sulovari et al. 2019; Ewing et al. 2020;           focused on SVA sequences present on Chromosome 1 in the
Ebert et al. 2021; Porubsky et al. 2021).                                GRCh38 assembly as a proof of principle and included small struc-
      In this study we discovered that SVA retrotransposons, a great     tural variations (20–50 bp difference in SVA size) that were not in-
ape-specific class of TEs, constitutes a major source of hidden ge-      cluded in previous analyses (Audano et al. 2019). We observed
netic variation that is not taken into account by conventional ge-       structural variation within 49.1% of full-length SVAs present on
netic case-control studies. We set out to investigate the biological     Chr 1, a slight increase over what was discovered in our first anal-
consequences of structural variability in SVAs, focusing on SV-          ysis. Structural variation was primarily observed in the center
SVAs in Alzheimer’s disease (AD)– and Parkinson’s disease (PD)–as-       (VNTR) and 5′ (hexamer) region of the SVA. The distribution of
sociated GWAS loci. We assessed the gene-regulatory influence of         structural variation between SVA classes was comparable to previ-
SV-SVAs in a human neuronal context by genetic deletion of SVAs          ous analysis, with most SV-SVA elements belonging to the youn-
in three disease-associated loci. Our findings highlight the             gest types.
importance of careful mapping of structural variations within                   To rule out sequencing or assembly errors leading to the ob-
fixed TEs in the human population and argue for their inclusion          served variation, we selected five human-specific SVAs in which
in complex trait genetics as a layer of genetic variation that may,      to validate the structural variations by PCR analysis. We confirmed
in some cases, confer the actual disease susceptibility to a GWAS-       structural variations within all five studied SVAs in a platform of
identified locus.                                                        236 human genomic DNA samples (Fig. 1F; Supplemental Fig.

2    Genome Research
       www.genome.org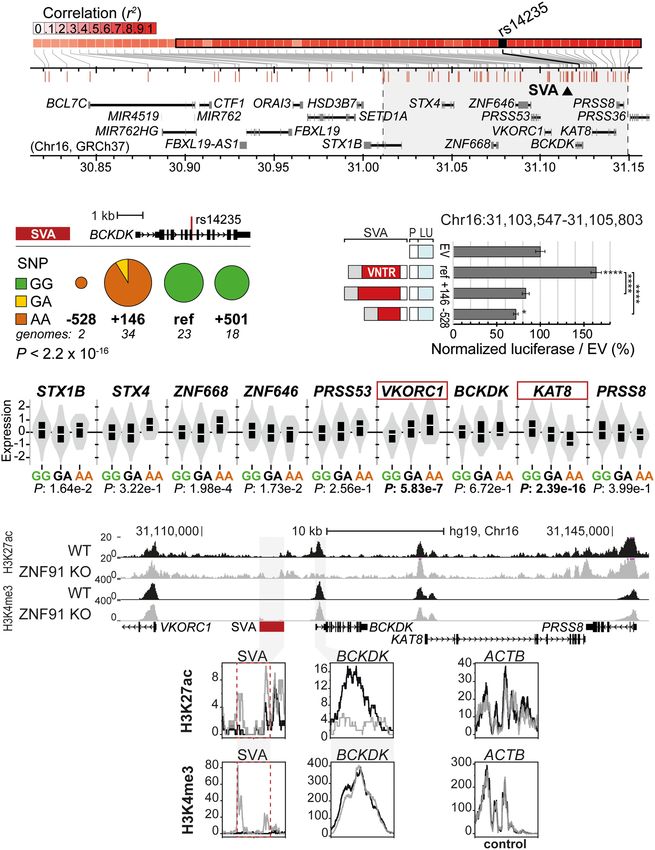
Downloaded from genome.cshlp.org on June 22, 2022 - Published by Cold Spring Harbor Laboratory Press
Structurally variable TEs in disease-risk loci
A B the actual variability in SVAs may be
even higher in the population than we
found based on the 15 unphased PacBio
genomes (Audano et al. 2019). Together
these data reveal that SVA elements are
a major source of structural variation be-
tween individuals.
SV-SVAs reside in gene-regulatory
regions
C D
We next determined whether SV-SVAs
have the potential to influence gene ex-
pression. Previous studies have shown
that SVAs have strong gene regulatory
potential and are identified as cis-regula-
tory elements by epigenetic marks
(Savage et al. 2013, 2014; Jacobs et al.
2014; Bragg et al. 2017; Trizzino et al.
2017; Pontis et al. 2019). In addition,
E F SVAs are enriched in open and active
chromatin regions in numerous tissues
and senescent cells, and show active epi-
genetic marks in the brain (De Cecco
et al. 2013; Trizzino et al. 2018; Pontis
et al. 2019). In further support of the reg-
ulatory potential of SVA elements, we
G H showed that an SVA-F element upstream
of a minimal promoter induced an 11.5×
increase in luciferase activity relative to
the empty vector control in mouse ESCs
(mESCs; P = 0.00227, two-sided t-test
with Bonferroni correction) (Fig. 2A).
mESCs were used to fully assess the
SVA’s regulatory potential using an ap-
proach described in Jacobs et al. (2014),
in which SVA activity is measured in a
cellular model system that lacks KRAB
zinc finger proteins, a family of endoge-
nous SVA repressors found in primates.
A much lower but still significant en-
hancement of luciferase activity by the
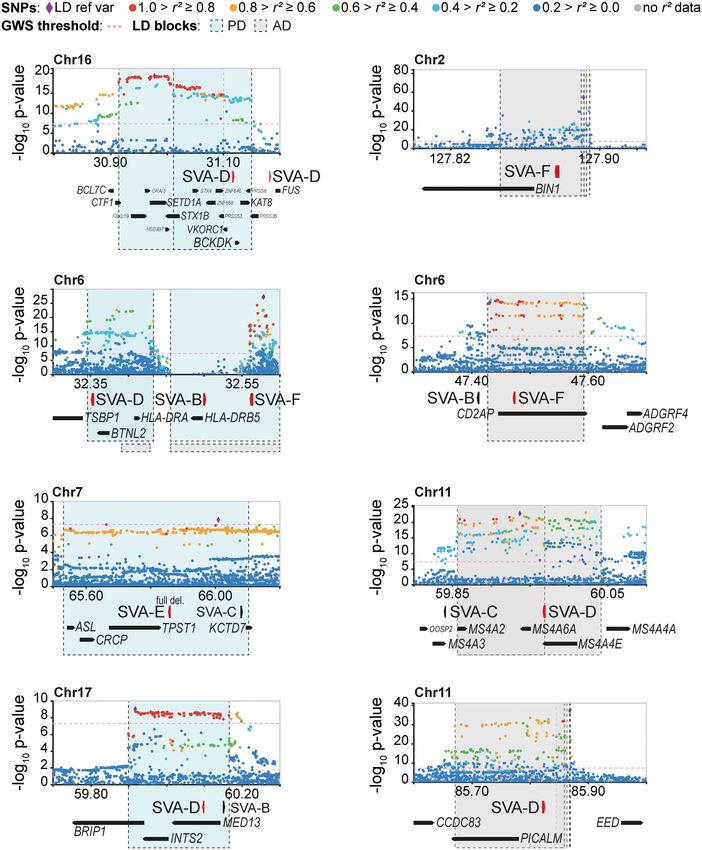
Figure 1. SVAs are a major contributor to inter-individual structural variation. (A) Percentage of trans-
posable elements with EP300 enhancer mark in cortical organoids; the top 20 enriched elements are
SVA-F element was also observed under
shown. (B) Coverage heatmaps at full-length SVAs (GRCh37) in hESCs and cortical organoids for conditions of KRAB zinc finger-mediated
EP300 (hESCs: average of two replicates; cortical organoids: average of two biological and two technical repression by the recently identified SVA
replicates). Bottom gray box: average size SVAs. (C ) Percentage of “full-length” TEs per class with struc- repressor ZNF91 (P = 0.00441, two-sided
tural variation based on Audano et al. (2019), grouped by the species they originated in. (D) Relative
t-test with Bonferroni correction) (Fig.
abundance of structural variation (left) and corresponding coverage heatmap (right) showing that
most structural variation resides in the VNTR region of SVAs. Approximate SVA structure is shown below. 2A; Jacobs et al. 2014; Haring et al. 2021).
(E) Distribution of structural variation (SV) sizes for insertions (ins) and deletions (del) in SVAs. (F) Example SVAs have also been shown to influ-
of structural variants for SVA in PCR-amplified region Chr 16: 31,103,547–31,105,803 (GRCh38 assem- ence gene expression through insertion
bly). PCR-amplified region shown in red. (G,H) Schematic overview of SV-SVAs in phased assemblies of near or within genes (Jacobs et al. 2014;
Ebert et al. (2021) of listed genomes for specified regions with approximate size shown. Estimated loca-
tion of insertions (blue) and deletions (red) compared to reference genome. Bragg et al. 2017; Trizzino et al. 2018;
Haring et al. 2021). We found that 82%
of SV-SVAs are located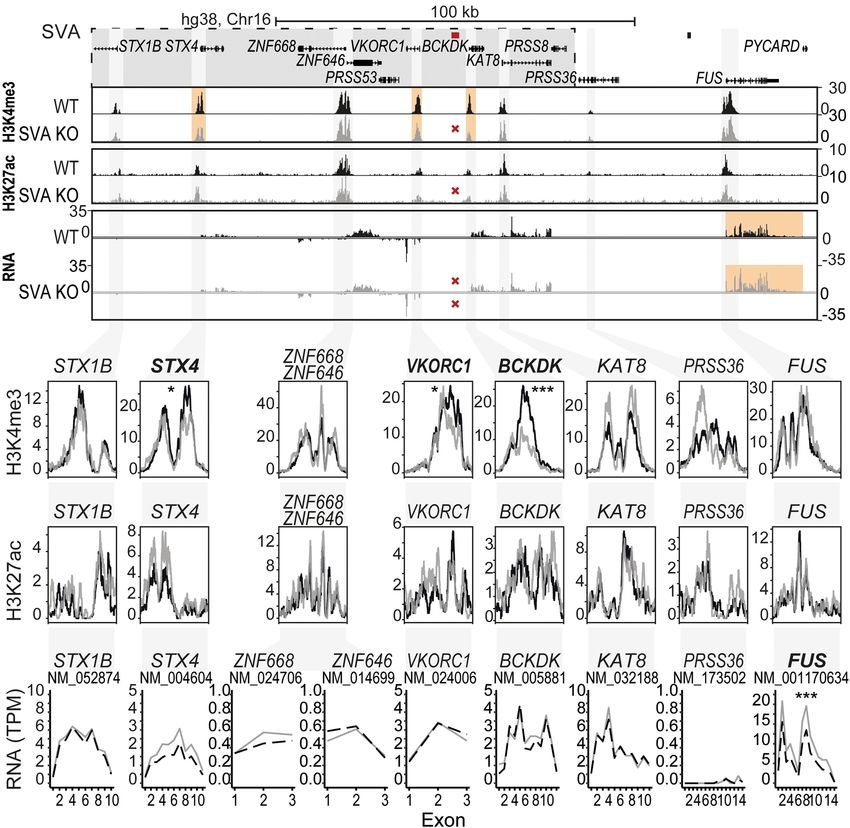
Downloaded from genome.cshlp.org on June 22, 2022 - Published by Cold Spring Harbor Laboratory Press

van Bree et al.

      A                                                   B                                                 amyotrophic lateral sclerosis (ALS), au-
                                                                                                            tism spectrum disorder (ASD), multiple
                                                                                                            sclerosis (MS), and schizophrenia. AD-as-
                                                                                                            sociated LD blocks contained 13 SVAs (in
                                                                                                            12 out of 94 LD blocks) and PD-associat-
                                                                                                            ed LD blocks contained 23 SVAs (in 19
       C               D                                                                                    out of 114 LD blocks). A substantial num-
                                                                                                            ber of SVAs were also found in LD blocks
                                                                                                            associated with schizophrenia (69 SVAs
                                                                                                            in 59 out of 470 blocks), ASD (38 SVAs
                                                                                                            in 28 out of 178 blocks), bipolar disorder
                                                                                                            (36 SVAs in 21 out of 151 blocks), and MS
                                                                                                            (19 SVAs in 13 out of 198 blocks). Only
                                                                                                            one SVA was found in ALS-associated
                                                                                                            LD blocks, but the number of identified
                                                                                                            ALS-associated loci was also low (15
                                                                                                            loci). The number of SVAs located within
                                                                                                            LD blocks was higher than the number
Figure 2. SV-SVAs reside in gene-regulatory regions. (A) Luciferase activity of construct without (EV)      expected by random distribution of
and with an SVA element (SVA_F) upstream of a minimal promoter (P) in mESCs. N3n9, two-sided t-             the elements for PD (2.6×, P < .00001,
test with Bonferroni correction, (∗∗ ) P < 0.01. Error bars: SEM. (B) Distribution of SV-SVAs (red) and
                                                                                                            χ2 test), ASD (2.1×, P < .00001), bipolar
non-SV-SVAs (gray) per distance to TSS. Only SVAs > 1 kb are shown. (C) Number of SV-SVAs and non-
SV-SVAs that are intragenic is comparable (χ2(1, N = 2154) = 1.10, P = 0.29). Only SVAs > 1000 bp are       disorder (2.3×, P < .00001), schizophre-
shown. (D) Box plots showing base mean expression ratio (human/rhesus) for transcripts with an intra-       nia (1.6×, P = .000106), and MS (1.9×,
genic SVA in humans (white; 1151) and without (gray; 23,296) in ESC-derived cortical organoids of 1- to     P = .00555), but not for AD (1.7×, P =
5-wk old. Red line shows 95% CI of 10,000× bootstrapped median of transcripts without an SVA with           .0545), neuroblastoma (1.7×, P = .586),
sample size of 1151. Wilcoxon rank-sum test: (∗∗∗∗ ) P < 0.0001, (∗∗∗ ) P < 0.001, (∗∗ ) P < 0.01, ns = not
significant.                                                                                                or ALS (1.3×, P = .868).
                                                                                                                  We further focused our investiga-
                                                                                                            tion on PD- and AD-associated loci,
intragenic, which was comparable to non-SV-SVAs (P = 0.29, χ2                    because aging is the greatest risk factor for those diseases, and
test) (Fig. 2C). This supports findings from previous work, in which             the epigenetic changes associated with aging can uncover the hid-
additionally a positive correlation between SVA number and gene                  den regulatory potential of TEs (Li et al. 2013; Guo et al. 2018). For
transcription was found (Gianfrancesco et al. 2019). To further an-              PD, 23 SVAs were located within 19 LD blocks, of which nine SVAs
alyze the intronic regulatory effect of SVAs on a genome-wide lev-               were structurally variable and one showed insertional polymor-
el, we compared the expression levels of genes with and without                  phisms in the population (Fig. 3A; Supplemental Fig. S3A). SV-
an intragenic SVA in cortical organoids derived from human and                   SVAs were also found intronic or close to the TSS of three other
rhesus macaque embryonic stem cells (Field et al. 2019). Notably,                well-studied PD-associated genes: NURR1, SYT11, and PARK7
rhesus macaques, like all non-great-ape species, do not contain any              (Supplemental Fig. S4A; Jankovic et al. 2005; Simón-Sánchez
SVAs in their genome. Human genes with an intragenic SVA dis-                    et al. 2009; Nalls et al. 2014, 2019). For AD, the 13 SVAs found
played a modest but significant increase in expression levels com-               within those LD blocks were located near highly validated AD
pared to the non-SVA ortholog in rhesus. This difference was not                 risk genes including BIN1, PICALM, and CD2AP (Fig. 3B; Hamza
observed for genes that lack intragenic SVAs in both human and                   et al. 2010; Jansen et al. 2019; Schwartzentruber et al. 2021).
rhesus (Fig. 2D; Supplemental Fig. S2). These data provide support               Eight of these SVAs were found to be structurally variable (Fig.
for an intronic regulatory role of SVAs. The location of SV-SVAs in              3B; Supplemental Fig. S3B). SV-SVAs were also found intronic or
close proximity to or within genes is consistent with the hypoth-                close to the TSS of five other well-studied AD-associated genes:
esis that these SVAs may have gene regulatory potential, and that                MS4A1, BACE1, PSEN1, DMXL1, and SPRED2 (Supplemental Fig.
structural variability within these elements could differentially                S4B; Sherva et al. 2014; Ma et al. 2015; Yu et al. 2016; Kelleher
regulate nearby genes.                                                           and Shen 2017; Schwartzentruber et al. 2021). The GWAS upon
                                                                                 which the LD blocks were based were performed without accurate
                                                                                 knowledge of the level of structural variation in TEs. Our analysis
Disorder-associated loci identified by GWAS are rich in SV-SVAs                  suggests that like any other structural variation near the tag
Previous research showed that insertional polymorphisms of TEs                   SNPs, structurally variable SVAs need to be considered as candidate
are in LD with trait-associated SNPs, constituting a potential caus-             causal factors for the disease risk contained within these loci. This
ative genetic variant for numerous human phenotypes (Payer et al.                emphasizes the need to assess the gene-regulatory roles of these
2017). We extended this approach beyond TE-insertional poly-                     specific SV-SVAs in more detail.
morphisms, asking whether we could detect SV-SVAs in LD with
established neurological disorder-associated SNPs, which could
thus have possible involvement in the development of these con-
                                                                                 SVA variants are associated with disease-risk SNPs
ditions. Using reported SNPs from the NHGRI-EBI catalog as                       and have differential gene regulatory potential
source, we considered a variety of complex diseases with a pre-                  Based on the regulatory potential of SVAs and their presence in
sumed major genetic component and searched for SVAs within                       neurological disease-associated loci, we hypothesized that struc-
disorder-associated LD blocks. We determined the presence of                     tural variation within SVAs could be a causal factor in disease
SVAs in disorder-associated LD blocks in AD, PD, bipolar disorder,               risk for a number of GWAS-identified trait loci. To test this, we first

4    Genome Research
        www.genome.org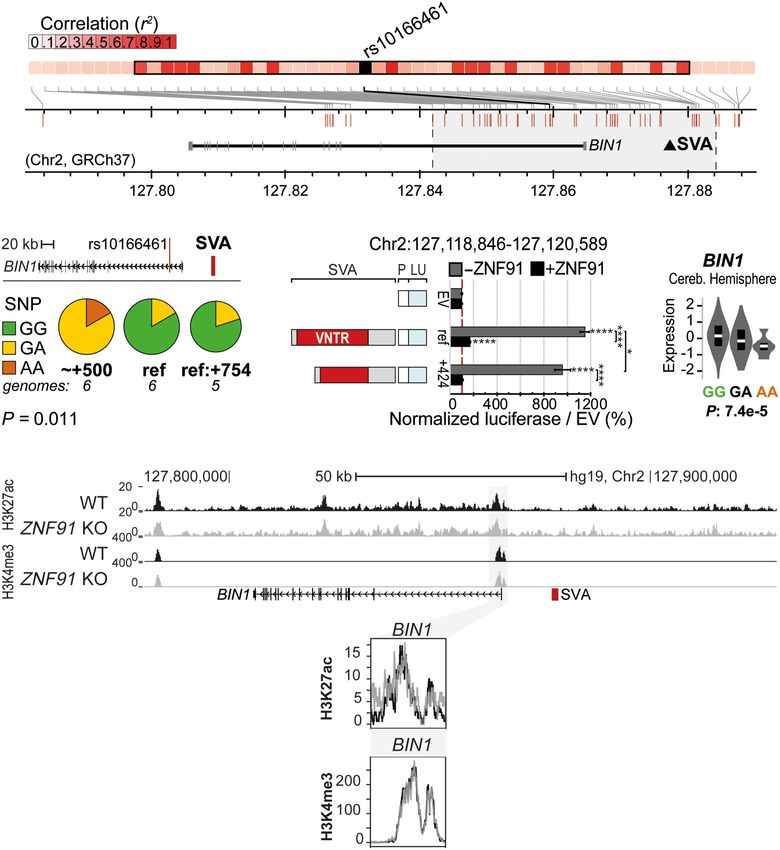
Downloaded from genome.cshlp.org on June 22, 2022 - Published by Cold Spring Harbor Laboratory Press
Structurally variable TEs in disease-risk loci
influence PD by modulating autophagic
flux (Chang et al. 2017). We identified
A B multiple structural variants for the
nearby SVA by PCR analysis (Fig. 1F;
Supplemental Fig. S1F) and analyzed
rs14235 in 76 individuals homozygous
for each structural variant of the nearby
SVA. There was a significant relationship
between the SNP alleles and the
SVA structural variants (P < 2.2 × 10⁻¹⁶,
Fisher’s exact test). The minor (risk) allele
was exclusively observed in individuals
containing the SVA variant with either
−528 bp or +146 bp structural variations,
whereas all individuals with the reference
variant and the +500 bp SVA variant were
homozygous for the ancestral (major) al-
lele (Fig. 4B). This indicates a strong link
between specific structural variants of
the SVA in this locus and the disease-asso-
ciated haplotype identified by GWAS.
This makes the SVA near BCKDK a poten-
tial candidate for carrying the actual
mechanistic cause for the association of
the minor (risk) allele of rs14235 with in-
creased Lewy body count and increased
risk of PD.
We next examined whether each of
the SVA structural variants associated
with the minor (risk) allele showed differ-
ent gene regulatory potential. Both SVA
variants (+146 bp and −528 bp) that
consistently occur in conjunction with
the minor allele showed significantly
reduced gene regulatory potential com-
pared to the reference variant/ancestral al-
lele (P < 0.0001, two-way ANOVA, Tukey’s
multiple comparison) (Fig. 4C). The dif-
Figure 3. SV-SVAs reside in Parkinson’s and Alzheimer’s disease–associated LD blocks. (A,B) Regional ference in reporter gene expression be-
SNP association plots with SV-SVAs (red) shown in LD blocks of PD (blue) (A) and AD (gray) (B). The as- tween the +146 bp variant and the
sociated SNPs (AD; de Rojas et al. 2021, PD; Nalls et al. 2019) are plotted with their respective meta-anal-
−8 reference SVA was still observed following
ysis genome-wide significant P-values (GWS [Genome-wide significance], P < 5 × 10 ; as −log10 values)
and are distinguished by linkage disequilibrium (r 2) of nearby SNPs on a blue to red scale, from r 2 = 0 to 1, the overexpression of ZNF91, a factor me-
based on pairwise r 2 values from the 1000 Genomes Phase3 (ALL) reference panel. Gene annotations: diating strong repression of SVAs in a hu-
NCBI RefSeq Select database. Assembly GRCh37, scale in Mb. man-cellular context (P = 0.0274, two-
way ANOVA, Tukey’s multiple compari-
son) (Supplemental Fig. S5A). This shows
focused on two human-specific SV-SVAs in loci associated with AD that structural variations within the SVA near BCKDK harbor highly
and PD. One of these SVAs was chosen as an example of an SVA differential gene regulatory potential, and each of these SVA vari-
nearby a gene body and the other of an SVA in a gene-poor region. ants may therefore have different effects on nearby gene expression.
Structural variants of these SVAs were identified by PCR, and the We next determined whether the presence of different SVA
presence of the disease-associated tag SNP was determined by structural variants could also influence gene expression in vivo.
Sanger sequencing. We focused on individuals homozygous for Based on the knowledge that the rs14235 SNP allele was signifi-
specific SVA structural variants to ensure a correct association be- cantly associated with the structural variant of the nearby SVA,
tween the risk SNP and the presence of a certain SVA variant. The we compared eQTL data for rs14235 in brain tissue. We examined
first SV-SVA we selected is located 2.7 kb from the TSS of the gene expression data from cortex and substantia nigra, two well-studied
encoding for branched chain ketoacid dehydrogenase kinase brain areas involved in PD, and found rs14235 was significantly as-
(BCKDK) (Figs. 3A, 4A,B). This gene has an exonic SNP, rs14235, sociated with VKORC1 and KAT8 expression in cortex (Fig. 4D).
for which the minor (risk) allele is associated with a 1.17× to KAT8 expression in the cortex was decreased in the presence of
1.36× increase in mean Lewy body count (P < 0.041–0.0026) the minor (risk) allele for SNP rs14235. KAT8 expression in substan-
(Nalls et al. 2014; Heckman et al. 2017). The putative mechanism tia nigra displayed a trend in the same direction (Supplemental Fig.
of involvement of BCKDK in PD development is not entirely clear, S5C). These data are consistent with the observed repressive regula-
but the nearby gene KAT8, which resides in the same LD block, may tory effect of the two SVA variants that coincide with the minor
Genome Research 5
www.genome.org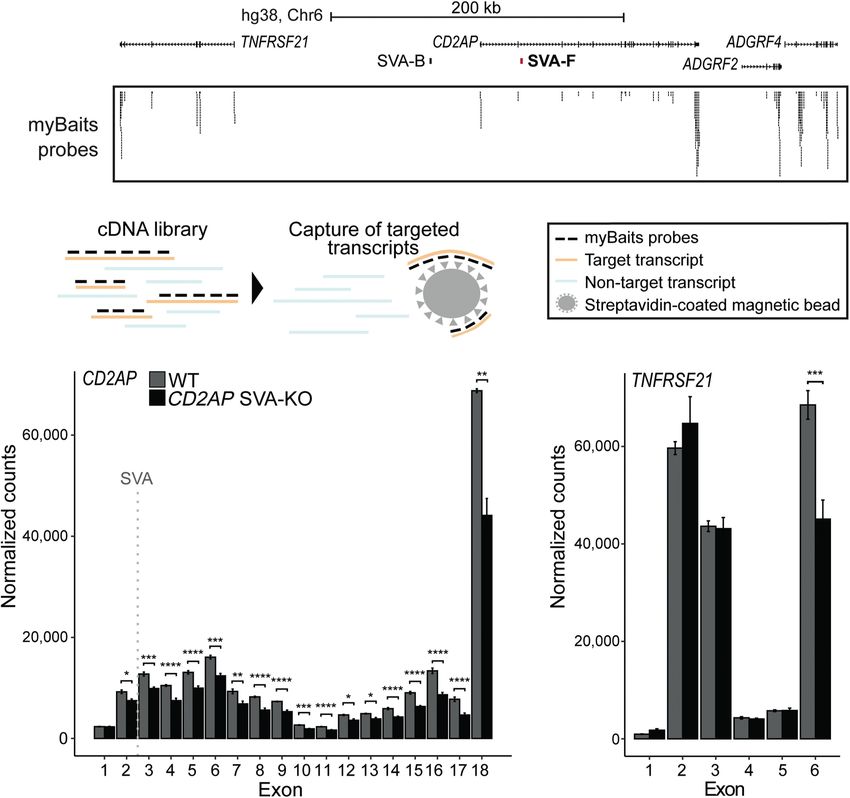
Downloaded from genome.cshlp.org on June 22, 2022 - Published by Cold Spring Harbor Laboratory Press
van Bree et al.
A crease in H3K4me3 in ZNF91 knockout
(KO) hESCs (Fig. 4E). We also found epi-
genetic alterations at the BCKDK promot-
er, indicating that in human ESCs, the
ectopic activation of the upstream SVA af-
fected the epigenetic state of the BCKDK
promoter.
The second SV-SVA we analyzed is
located 12 kb upstream of the TSS of the
AD-associated gene BIN1. The upstream
B C
region of this gene has been named the
second-most important susceptibility
locus in late-onset AD (LOAD) (http://
www.alzgene.org). BIN1 colocalizes and
interacts with tau protein, and SNPs up-
stream of BIN1 have been linked to in-
creased expression of the gene and risk
for LOAD (Seshadri et al. 2010; Carra-
D squillo et al. 2011; Hu et al. 2011; Lam-
bert et al. 2011, 2013; Lee et al. 2011;
Wijsman et al. 2011; Chapuis et al.
2013; Masoodi et al. 2013). The upstream
region of BIN1 contains a structurally var-
iable SVA (Figs. 3B, 5A,B) (Chr 2:
E 127,118,897–127,120,492, GRCh38), lo-
cated just 17 kb from the AD-associated
risk SNP rs10166461 (allele effect
−0.2636, P = 3.82 × 10⁻⁶) (Beecham et al.
2014). In a similar PCR validation to
determine the association of SVA variants
with the AD-associated SNP rs10166461,
we found that the risk allele was more of-
ten observed in individuals carrying the
+424 bp or +521 bp (∼+500) SVA variant,
and although the number of sequenced
individuals was limited, we found a sig-
nificant association between SNP allele
and SVA variant (P = 0.011, Fisher’s exact
test) (Fig. 5B). Structural variants of this
SVA associated with the minor (risk) al-
lele showed significant differential regu-
Figure 4. Structurally variable SVA near BCKDK links to a disease-associated SNP and has the potential latory potential in the luciferase reporter
2
to differentially regulate nearby genes. (A) Overview of LD block for rs14235, with area r > 0.8 highlight-
assay (P < 0.05, two-way ANOVA, Tukey’s
ed in gray. Approximate location of SVA marked with black triangle. (B) rs14235 genotyping analysis for
individuals homozygotic for BCKDK-SVA variants −600 (n = 2), ref (n = 23), +150 (n = 34), and +500 (n = multiple comparison) (Fig. 5C). In the
18). (Ancestral allele) G; (risk allele) A. Fisher’s exact test: P < 2.2 × 10⁻¹⁶. (C ) Schematic overview of lucif- presence of the SVA repressor ZNF91
erase constructs (P = minimal promoter, LU = luciferase gene) with BCKDK-SVA variants (Chr 16: this difference was not maintained. Fur-
31,103,547–31,105,803 GRCh38), with corresponding luciferase activity in transfected mESCs. N3n9,
∗∗∗∗ thermore, eQTL analysis revealed that in-
except BCKDK-SVA ref (n = 8). One-way ANOVA with Tukey’s multiple comparison, ( ) P < 0.0001,
∗
( ) P < 0.05. Error bars: SEM. (D) Analysis of eQTL data in cortex for rs14235 for genes within the LD block dividuals carrying the risk allele of
with r 2 > 0.8. Normalized expression is shown. Genes considered significant are shown in a red box. (E) rs10166461 displayed significantly lower
KO of the SVA repressor ZNF91 lowers H3K27ac at the promoter of BCKDK and increases H3K4me3 meth- expression of BIN1, but this effect was
ylation at the SVA near BCKDK in hESCs. ACTB shown as control enhancer region. (Top) Overview of locus, only observed in the cerebellum (Fig.
(bottom) magnification of regions of interest.
5D). Despite the apparent tissue-specific
association between rs10166461 and
(risk) allele (Fig. 4B–D). Individuals with the minor (risk) allele also changes in BIN1 expression, the direction of the gene expression ef-
showed decreased expression of KAT8, ZNF646, PRSS36, and RP11- fect corresponded with the results of our luciferase assays, in which
196G in other brain areas. No association of rs14235 with BCKDK the +424 bp variant (most often present in individuals with the risk
expression levels was found. To further assess the regulatory effect allele of rs10166461) had a significantly lower regulatory potential
of the SVA in this locus, we asked whether ectopic activation of the than the reference SVA variant (Fig. 5C). Consistent with the cere-
SVA would lead to changes in epigenetic marks in the BCKDK locus. bellum-specific association of rs10166461 with differences in BIN1
We previously showed that in hESCs carrying a ZNF91 genetic dele- expression, in cortical organoids we found no significant alter-
tion, SVAs become epigenetically activated (Haring et al. 2021). ations for H3K4me3 and H3K27ac histone marks in the BIN1 locus
This is also the case for the SVA near BCKDK, which showed an in- under ZNF91 KO conditions (Fig. 5E). We also examined eQTL data
6 Genome Research
www.genome.org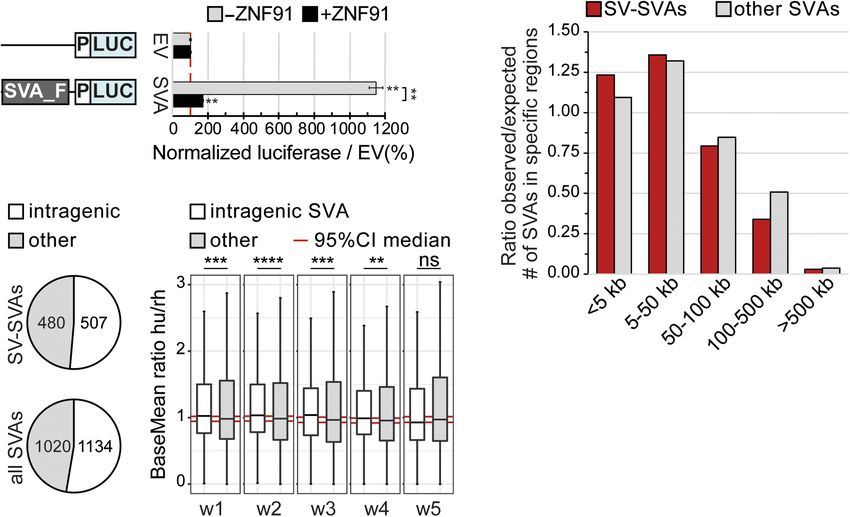
Downloaded from genome.cshlp.org on June 22, 2022 - Published by Cold Spring Harbor Laboratory Press

                                                                                             Structurally variable TEs in disease-risk loci

 A                                                                                                          BCKDK-SVA KO hESCs were subse-
                                                                                                            quently directed into a neuronal fate by
                                                                                                            generating cortical organoids to analyze
                                                                                                            the regulatory effect of the SVAs in a neu-
                                                                                                            ronal context (Fig. 6; Supplemental Figs.
                                                                                                            S6, S7). Five weeks after the onset of neu-
                                                                                                            ronal differentiation, organoids were
                                                                                                            harvested for RNA-seq and ChIP-seq.
                                                                                                            We supplemented a transcriptomic
  B                                     C                                               D                   profile of the loci in the respective SVA
                                                                                                            KO cells with ChIP-seq profiles of
                                                                                                            H3K4me3 and H3K27ac epigenetic
                                                                                                            marks to identify genes that may be un-
                                                                                                            der regulatory influence of the SVA.
                                                                                                                  Genetic deletion of the SVA located
                                                                                                            in the BCKDK locus resulted in a statisti-
                                                                                                            cally significant reduction in H3K4me3
                                                                                                            at the promoters of BCKDK, VKORC1,
  E                                                                                                         and STX4 (Fig. 6A,B; Supplemental Table
                                                                                                            S3). Although we observed an increase of
                                                                                                            H3K4me3 signal in part of the promoter
                                                                                                            of KAT8 and PRSS36, this result did not
                                                                                                            reach the threshold of significance. No
                                                                                                            significant changes were observed for
                                                                                                            H3K27ac, which was detected at a
                                                                                                            much lower level overall (Fig. 6C; Supple-
                                                                                                            mental Table S3). Despite the clear
                                                                                                            changes in histone marks, the RNA ex-
                                                                                                            pression levels of BCKDK, VKORC1,
                                                                                                            STX4, or KAT8 were not significantly al-
                                                                                                            tered in BCKDK-SVA KO neurons. In-
                                                                                                            stead, the deletion of the SVA in the
                                                                                                            BCKDK locus resulted in a strong increase
                                                                                                            in expression of the gene encoding RNA-
Figure 5. Structurally variable SVA near BIN1 links to a disease-associated SNP and has the potential to    binding protein FUS (FUS; adjusted P =
differentially regulate nearby genes. (A) Overview of LD block for rs10166461, with area r 2 > 0.8 high-    1.53 × 10⁻¹¹, DESeq2), located ∼75 kb
lighted in gray. Approximate location of SVA marked with black triangle. (B) rs10166461 genotyping          from the deletion site (Fig. 6D). Although
analysis for individuals homozygotic for BIN1-SVA variants ref (n = 6) and +424 or +521 (∼+500, n = 6)
                                                                                                            no direct link has been reported for FUS
and heterozygotic for ref and +754 (n = 5). Ancestral allele = G, risk allele = A. Fisher’s exact test: P =
0.0108. (C) Schematic overview of luciferase constructs (P = minimal promoter, LU = luciferase gene)        with PD, this gene is linked to other neu-
with BIN1-SVA variants, with corresponding luciferase activity in transfected mESCs with and without        rodegenerative diseases such as ALS,
ZNF91. Two-way ANOVA with Tukey’s multiple comparison. (∗∗∗∗ ) P < 0.0001, (∗ ) P < 0.05. Error bars:       frontotemporal dementia (FTD), and es-
SEM. (D) Analysis of eQTL data in cerebellar hemisphere for rs10166461 and BIN1. (E) KO of the SVA re-      sential tremor (ET) (Kwiatkowski et al.
pressor ZNF91 does not influence H3K27ac and H3K4me3 at the promoter of BIN1 in hESCs. (Top)
Overview of locus, (bottom) magnification of regions of interest.                                           2009; Vance et al. 2009; Mackenzie
                                                                                                            et al. 2010; Wu et al. 2013; Deng et al.
                                                                                                            2014). The expression of FUS was previ-
for other SV-SVAs in AD and PD loci. Significant differential expres-            ously shown to be controlled by an SVA directly upstream of the
sion associations for SNPs within the LD blocks overlapping these                FUS gene, which further supports our current observations (Savage
SVAs were observed for numerous genes, including CD2AP, HLA-                     et al. 2014). None of the other 61 genes in a window of 1 Mb up-
DRB1/5/6, PICALM, MS4A6A, MS4A4E, and APOE (see Supplemen-                       stream of and downstream from the SVA showed differential ex-
tal Table S2). Together, these data show the relationship between                pression upon SVA deletion, with the exception of SRCAP,
SV-SVAs and GWAS-identified risk SNPs and suggest that these                     located 404 kb from the SVA (Supplemental Fig. S8). Removal of
SVA variants could potentially be involved in disease susceptibility             the SVA 12 kb from the TSS of BIN1 did not result in detectable epi-
through gene regulation in these loci. Further functional research               genetic and transcriptional changes in the locus in the context of
on specific loci remains necessary to fully understand which and                 the cortex model system we used (Supplemental Fig. S6), but this
how SV-SVAs may contribute to disease development.                               may reflect the selective cerebellum-specific association of BIN1
                                                                                 expression with the risk allele and its associated SVA variant (Fig.
                                                                                 5D). Therefore, use of a model system for cerebellum rather than
Genetic deletion of SVA elements in AD/PD loci alters the                        cortex may be important for investigating the effect of SVA KO
epigenome and nearby gene expression                                             in the BIN1 locus.
To further investigate the gene-regulatory role of the SVAs in the                     In a final approach, we aimed to investigate the gene-regula-
BCKDK and BIN1 loci, we engineered genetic deletions of the                      tory role of an intronic SVA in CD2AP, another AD-associated gene
SVAs in hESCs using CRISPR-Cas9 technology. BIN1-SVA KO and                      (Fig. 3B). We engineered a genetic deletion of the SVA in hESCs

                                                                                                                         Genome Research             7
                                                                                                                            www.genome.org
Downloaded from genome.cshlp.org on June 22, 2022 - Published by Cold Spring Harbor Laboratory Press
van Bree et al.
A were observed for the vast majority of
control genes residing in other genetic
loci included in the RNA CaptureSeq
analysis (Supplemental Table S4).
Taken together, these results show
that structurally variable SVAs in impor-
tant neurological disease-associated loci
have the potential to affect the surround-
ing epigenome and/or transcriptome.
Although the genetic variants that cause
gene dysregulation remain undiscovered
for the majority of the GWAS-identified
disease-risk loci, our data present struc-
B tural variation in SVAs and other TEs as
novel potential genetic modifiers of
gene regulation in these loci.
Discussion
C
Our study reveals that structural varia-
tions in SVAs are previously unknown
candidates for causal genetic variants
not captured by conventional GWAS.
Multiple lines of research indicate that
D SVAs can influence the expression of
nearby genes (De Cecco et al. 2013; Sav-
age et al. 2013, 2014; Jacobs et al. 2014;
Bragg et al. 2017; Trizzino et al. 2017,
2018; Pontis et al. 2019; Haring et al.
2021), and the extensive structural vari-
ability that we observed in SVAs ge-
Figure 6. SVA deletion alters the epigenome and nearby gene expression. (A) Overview of locus. LD nome-wide suggests that this influence
block shown in gray box, location of SVA removed by CRISPR-Cas9 KO shown in red. (B–D)
could be highly variable within the hu-
Magnification of genes within a 200 kb region of deleted SVA. (B) H3K4me3 ChIP-seq, the mean of three
replicates is shown. (C) H3K27ac ChIP-seq, the mean of three replicates is shown. (D) Mean expression of man population. For two SVAs analyzed
three replicates shown per exon for transcripts. Adjusted P-value of DESeq2 is shown for the whole tran- in detail in this study, we find that specif-
script and ChIP peaks. (∗∗∗ ) P < 0.001, (∗ ) P < 0.05. Genes reaching statistical significance are indicated in ic SVA variants are significantly associat-
bold. ed with the presence of nearby risk SNPs
identified in GWAS, whereas other vari-
using CRISPR-Cas9 (Fig. 7A) and generated cortical organoids from ants are not. Although all individuals will carry a certain SVA in
the CD2AP-SVA KO hESCs. We performed targeted mRNA enrich- a disease-associated locus, the particular structural variation pre-
ment before RNA-seq (RNA CaptureSeq) to specifically enrich for sent within this SVA in each individual may have important con-
transcripts derived from the CD2AP locus and 38 other unrelated sequences. In fact, we showed that different SVA structural variants
control genes, allowing us to track the expression levels of each show differential gene regulatory potential in vitro. We propose
of the CD2AP exons separately. This was important because that inter-individual structural variation in SVA elements may be
intronic SVAs may differentially influence the expression level of an important genetic variable that may directly and functionally
exons upstream of and downstream from the SVA, as is observed link to disease risk. Furthermore, in those cases where an SVA influ-
for a pathogenic intronic SVA that leads to X-linked dystonia-par- ences gene expression in the locus, the structural variation in the
kinsonism (Bragg et al. 2017). Furthermore, this RNA CaptureSeq SVA may be an even more accurate indicator for disease risk than
approach increased the overall resolution of the selected gene tran- the risk SNP originally identified by GWAS.
scripts, allowing for a more accurate assessment of the conse- Previous research into structural variation within specific
quences of removal of the intronic SVA for CD2AP gene SVAs supports our hypothesis that these variations can be involved
expression (Fig. 7B). DESeq2 analysis comparing gene expression in disease. In X-linked dystonia-parkinsonism, the length of a dis-
in CD2AP-SVA KO cortical organoids to unedited control organo- ease-causing SVA insertion in an intron of the TAF1 gene displayed
ids revealed significantly lower expression levels for all CD2AP ex- differential gene regulatory potential and correlated with disease
ons downstream from the SVA insertion site (Fig. 7C). Of the two onset (Bragg et al. 2017). Two other SV-SVAs near ALS- and PD-
exons upstream of the SVA, exon 1 was not significantly affected associated genes were also shown to have differential regulatory
by SVA removal, and only a modest reduction was observed for potential, although in these cases the causal relationship to the
exon 2. Although the final exon of the nearby gene TNRFSF21 disease remains unproven (Savage et al. 2013, 2014). Our study re-
also showed a difference in expression between KO and unedited veals multiple SV-SVAs in AD- and PD-associated loci that are po-
controls, a consistent change in expression levels for TNRFSF21 tential contributors to disease susceptibility. eQTL data of SNPs
was not observed (Fig. 7D). No significant differences in expression in the BCKDK and BIN1 loci showed an association of the dis-
levels between CD2AP-SVA KO and unedited control organoids ease-risk allele to changes in gene expression. Importantly, for
8 Genome Research
www.genome.orgDownloaded from genome.cshlp.org on June 22, 2022 - Published by Cold Spring Harbor Laboratory Press
Structurally variable TEs in disease-risk loci
A tential of SVA variants could become
increasingly more prominent. For the
SVA in the PD-associated BCKDK locus,
along with an influence on the epigenet-
ic state of nearby gene promoters, we
found a possible gene-regulatory effect
on FUS, a gene located just outside of
the PD-associated LD block. These find-
B ings are compatible with the concept
that the causal variant within a disease-
associated locus could be a gene-regula-
tory element that influences the expres-
sion of genes inside and/or outside of
C D the LD block. Although there is no strong
support for a role of FUS dysregulation in
PD, FUS has been associated with other
neurodegenerative diseases such as ALS,
FTD, and ET (Kwiatkowski et al. 2009;
Vance et al. 2009; Mackenzie et al.
2010; Wu et al. 2013; Deng et al. 2014).
In addition, PINK1 and PARKIN, two
well-known PD-associated genes, were
found to be genetic modifiers of FUS-in-
duced neurodegeneration (Chen et al.
2016). Given the role of FUS in other neu-
rodegenerative diseases, it is not unlikely
that FUS dysregulation, caused by specif-
ic SVA variants in the BCKDK locus, is in
some way a contributor to the neuropa-
Figure 7. Intronic SVA deletion alters exon expression of CD2AP gene. (A) Overview of CD2AP locus. thology in PD, but whether FUS is indeed
Location of SVA removed by CRISPR-Cas9 KO shown in red. Probes from myBaits targeting CD2AP exons. regulated by the SVA in the BCKDK locus
(B) Schematic of capture of targeted transcripts with myBaits probes. (C,D) Normalized mean expression
of three replicates shown per exon of CD2AP and the nearby highly expressed gene TNFRSF21. Location
remains to be investigated in detail.
of SVA indicated with dashed gray line. Adjusted P-value from DESeq2 shown for each exon. (∗∗∗∗ ) P < Collectively, this study reveals an
0.0001, (∗∗∗ ) P < 0.001, (∗ ∗ ) P < 0.01, (∗ ) P < 0.05. extensive level of structural variation in
TEs that has escaped detection by SNP ar-
rays and short-read sequencing tech-
both loci the direction of gene expression change associated with niques. Our analysis stresses the importance of accurate mapping
the risk alleles was consistent with our luciferase assay data in and characterization of structural variations in TEs in disease-asso-
which different SVA variants were explored functionally. The ciated loci. The methods used by GWAS do not identify structural
two SVA variants associated with the risk allele rs14235 in the variations owing to their repetitive nature and size, so there may be
BCKDK locus displayed an expansion (+146 bp variant) and dele- numerous additional risk loci where the disease association is
tion (−528 bp variant) relative to the reference; however, both var- caused by structural variation in TEs. Whole-genome sequencing
iants showed a significant reduction in gene regulatory potential (WGS) is perfectly suitable for genotyping insertional polymor-
relative to the reference in the luciferase reporter assay. Potential phisms, however variations in repetitive sequences are still over-
mechanisms underlying differences in regulation of gene expres- looked. Ebert et al. (2021) describe a complementary method to
sion between SVA variants remain to be explored in future work. identify structural variations with haplotype-resolved assemblies
Removal of BCKDK and CD2AP SV-SVAs produced subtle but from long-read sequencing technology and genotype the identi-
significant changes on gene expression and epigenetic landscape, fied structural variations on short-read sequencing data for further
whereas no change was detected upon deletion of the SV-SVA in population analysis. Although this method allows for the discov-
the BIN1 locus. This is not completely unexpected, because SV- ery of structural variations on short reads, the limiting factor is still
SVAs are only one potential layer of gene regulation among highly repetitive DNA regions such as SVAs, thus giving an under-
many others. If SV-SVAs produced large changes in gene expres- representation of the true level of structural variability. Indeed, we
sion, we might expect the phenotypic consequences of these var- found that the poor genotype quality of the specific SVAs of inter-
iations to be evident in early life. On the contrary, it could be the est in the PanGenie callset of 1000 Genomes samples (Ebert et al.
case that the influence of SV-SVAs is highly tissue- or condition- 2021) made for a noninformative SVA-eQTL analysis. In the future,
specific and is not easily captured in our model systems. a targeted genotyping of SVAs using an alternative genotyper may
Structural variations in SVAs may be particularly important in be able to improve the SVA genotyping quality using short reads.
age-related neurological diseases, because the epigenetic changes Alternatively, long-read sequencing may be a better technology
associated with aging could uncover the latent regulatory poten- to fully characterize structural variations and their association
tial of these TEs (Li et al. 2013; Guo et al. 2018). In that sense, with disease, because it is estimated that ∼83% of insertions are
SV-SVAs may contribute to the progressive character of these dis- missed with short-read-calling algorithms (Chaisson et al. 2019).
eases, because with increased age the differences in regulatory po- Recently haplotype-resolved assemblies have been reported,
Genome Research 9
www.genome.orgDownloaded from genome.cshlp.org on June 22, 2022 - Published by Cold Spring Harbor Laboratory Press
van Bree et al.
which allow for more sensitive structural variation discovery by number of elements overlapping with a EP300 peak/expected)],
taking into account both alleles for each locus. This strategy out- the percentage of elements overlapping with a peak was reported
puts a much more accurate representation of the total structural (obs_hits/nb_of_TE_in_genome). See Supplemental Table S1 for
variability in the human genome, indicating that the structural output.
variation data set used in our study is an underrepresentation of
the total structural variation in the human population. Although RNA-seq
long-read sequencing is expensive and not yet widely used, it is a
matter of time before it becomes the standard way to perform ge- RNA isolation, library preparation, and sequencing
nome sequencing. The reliability of genetic disease susceptibility Between six and nine organoids were collected on day 35 after start
markers and predictions will be significantly enhanced once of differentiation, rinsed in medium, homogenized in 400 µL
GWAS include SNPs alongside all other structural variations, re- TRIzol (Invitrogen) by pipetting, and stored at −80°C for later
gardless of the size of these variants or whether they are located use. RNA was isolated according to the manufacturer’s protocol
within TEs. Finally, increased awareness of the hidden gene regu- with DNase I treatment (Sigma-Aldrich) and cleaned-up using
latory potential of noncoding DNA elements and the availability the RNA Clean & Concentrator-5 kit (Zymo Research). Libraries
of human model systems and genetic engineering to study func- were generated with the TruSeq Stranded Total RNA Library Prep
tional noncoding elements will allow us to functionally interro- (Illumina) kit, and 2 × 75 bp paired-end reads were sequenced by
MAD: Dutch Genomics Service & Support Provider of the
gate these variants to gain a better understanding of the
University of Amsterdam using a NextSeq 550 Illumina sequencer.
mechanism of disease. Ultimately, this may contribute to the dis-
covery of novel therapeutic targets and strategies for disease
treatment. RNA CaptureSeq
Samples of CD2AP-SVA KO and unedited control were used for
RNA CaptureSeq. RNA isolation of cortical organoids and library
Methods preparation were performed as described previously. Enrichment
of targeted transcripts was performed with biotinylated probes
Cell culture and SVA KO from myBaits Custom RNA-seq following the manufacturer’s stan-
hESCs were cultured and treated as described previously (Haring dard protocol v.5.00 (Arbor Biosciences, Ref #200320-91) based on
et al. 2021) to generate KOs of the SVAs located at Chr 2: Mercer et al. (2012). The cDNA libraries were pooled, and 100 ng
127,118,846–127,120,589, Chr 16: 31,103,565–31,105,709, and was used for capture. After capture, samples were amplified with
Chr 6: 47,505,039–47,506,780 (GRCh38) using the CRISPR-Cas9 14 PCR cycles and purified with 1× AMPure XP beads. The se-
system (Supplemental Fig. S7B–D). Cortical organoids were grown quencing was performed as described previously.
based on the methods described by Eiraku et al. (2008). See
Supplemental Material for details and full methods. Data analysis
Data were analyzed on the public Freiburg Galaxy server (Goecks
ChIP-seq et al. 2010; Afgan et al. 2018) (https://usegalaxy.eu). Reads were
trimmed using Trimmomatic (Bolger et al. 2014) version 0.36.5
ChIP for paired-end reads, removing adapters (ILLUMINACLIP
ChIP on EP300 was performed as described previously (Jacobs et al. TruSeq3 paired-end), cutting when average quality per base in a
2014), with an excess of EP300 antibody (C-20; sc-585 X; Lot 4-base sliding window was below 20, and dropping reads below a
B0211 and Lot E2610). For H3K27ac and H3K4me3 data, ChIP length of 30. Reads were mapped using HISAT2 (Galaxy Version
was based on Vermunt et al. (2014), with 5 µg H3K27ac (Abcam 2.1.0 + galaxy5) (Kim et al. 2019) against the built-in hg38.
ab4729, Lot GR3303561-2) and 6 µg H3K4me3 (Millipore 07- featureCounts (Galaxy Version 1.6.4 + galaxy2) (Liao et al. 2014)
473, Lot 3394198) per sample. ChIP-seq data analysis on EP300 was used to assign reads to NCBI RefSeq hg38 features with -p, -d
was performed as described previously (Jacobs et al. 2014). For 75 -D 900 -B -C. Output was used for DESeq2 (Galaxy Version
the full procedure, see Supplemental Material. 2.11.40.6 + galaxy1) (Love et al. 2014) using default settings.
bamCoverage (Galaxy Version 3.3.2.0.0) from the deepTools2
package (Ramírez et al. 2016) was used to generate coverage tracks
Library preparation and sequencing
(bin size 1) and scale these with a scaling factor based on the num-
Paired-end indexed ChIP DNA libraries were prepared using ber of uniquely assigned reads from featureCounts. Scaled cover-
Illumina TruSeq ChIP Sample Preparation Kit according to the age tracks were merged using wiggletools (Zerbino et al. 2014)
guidelines, with minor exceptions (see Supplemental Material). mean, and wig files transformed to bigWig files using the
For H3K27ac and H3K4me3, 2 × 75 bp paired-end sequencing wigToBigWig script (http://hgdownload.soe.ucsc.edu/admin/
was performed by MAD: Dutch Genomics Service & Support exe/). See Supplemental Table S3 for DESeq2 output.
Provider of the University of Amsterdam using a NextSeq 550
Illumina sequencer. EP300 data were sequenced on an Illumina
Differential exon usage analysis
HiSeq 2000 sequencing device.
To visualize differential exon usage (Fig. 6D; Supplemental Fig.
S6B,C), raw RNA-seq data were preprocessed and analyzed with
EP300 enrichment in TE classes the RNA-seq analysis pipeline (https://github.com/KoesGroup/
EP300 summit and peak files of replicates were merged and only Snakemake_hisat-DESeq), with the following modification of the
peaks of which the summit overlapped with a repeat were kept featureCounts rule using “exon” as feature type: Snakefile, line
to increase specificity. These 19,030 peaks were used as input for 194 featureCounts -p -t exon -g exon_id -T 8 -F GTF -O -M -a
the TE-analysis pipeline (https://github.com/4ureliek/TEanalysis) {input.gff} -o {output} {input.bams}. Preprocessed reads were
(Kapusta et al. 2013) to calculate repeat classes significantly en- mapped to hg38 and reads were assigned to NCBI RefSeq hg38 fea-
riched for EP300. For the top 20 enriched elements [log2(observed tures. The read count files were used as input for differential exon
10 Genome Research
www.genome.orgDownloaded from genome.cshlp.org on June 22, 2022 - Published by Cold Spring Harbor Laboratory Press
Structurally variable TEs in disease-risk loci
usage analysis. From here on, analysis was performed in R (version plotHeatmap (Galaxy Version 3.3.2.0.1) for only SV-SVAs (987).
3.4.1) using the packages dplyr (version 1.0.2; https://cran.r- For Figure 1E, sizes of structural variations overlapping with SVAs
project.org/package=dplyr), reshape2 (version 1.4.4) (Wickham were plotted in R (R Core Team 2019) using ggplot2 (Wickham
2007), and tidyr (version 1.1.2; https://cran.r-project.org/ 2016) geom_freqpoly() with 60 bins. The lines from 0 to 50 and
package=tidyr). The NCBI RefSeq hg38 annotation file was modi- −50 to 0 bp were manually removed, because no structural varia-
fied to contain only exon information and filtered based on ca- tions with these sizes were present in the data. For Figure 1, G
nonical transcript IDs and coding region. Read counts file was and H, BLAST (Altschul et al. 1990) was used to search for the
merged with prefiltered annotation file through a translation table SVAs of interest plus 500 bp flanks in the depicted genomes (Ebert
and exon counts normalized to transcript per million. Data were et al. 2021), and MUSCLE (Unipro UGENE) (Okonechnikov et al.
displayed using ggplot2 (version 3.3.3; https://ggplot2.tidyverse 2012) was used for alignment to interpret the results. SVA regions
.org) (Wickham 2016). were determined based on the repeat browser (Fernandes et al.
2020). Manually curated results were visualized using Adobe Illus-
trator CC (Adobe Inc.). See Supplemental Table S1 for sequences
Capture data analysis and information about data. Analysis of intragenic SVAs was per-
RNA CaptureSeq data were preprocessed and analyzed with formed on the public European Galaxy server (https://usegalaxy
the RNA-seq analysis pipeline (https://github.com/BleekerLab/ .eu). The hg38 NCBI RefSeq GTF file was filtered for transcripts,
snakemake_rnaseq). Preprocessed reads were mapped to hg38, al- converted to BED12 using Convert GTF to BED12 (Galaxy Version
lowing up to 20 multimappers during the alignment. Reads were as- 357), sorted using BEDTools (Quinlan and Hall 2010) SortBED
signed to Ensembl V104, counting features for both transcripts and (Galaxy Version 2.29.2) and overlapped with SV- and non-SV-
exons. From here on, analysis was performed in R (version 4.1.0) us- SVAs using BEDTools (Quinlan and Hall 2010) ClosestBed (Galaxy
ing the packages tidyverse (version 1.3.1) (Wickham et al. 2019), re- Version 2.29.2). TSSs were generated from the hg38 NCBI RefSeq
shape2 (version 1.4.4) (Wickham 2007), and plyr (version 1.8.6) transcript GTF file and the GenomicRanges package (version
(Wickham 2011). The read counts file was used as input for differen- 1.44.0; https://bioconductor.org/packages/release/bioc/html/
tial exon usage analysis with DESeq2 (version 1.32.0) (Love et al. GenomicRanges.html) was used to determine locations relative
2014). To correct for variability in control loci presumably unaffect- to TSS in R (version 4.1.0) (R Core Team 2019). See Supplemental
ed by SVA KO, size factor was estimated based on all captured genes Table S1 for information. Differences in distribution of SV- and
(Supplemental Table S1) excluding genes located in the CD2AP lo- non-SV-SVAs were tested using a χ2 test of independence. For dis-
cus (Fig. 7A). See Supplemental Table S4 for DESeq2 output. tance to TSS: χ2(4, N = 2154) = 7.4468, P = 0.1141. For intragenic
versus non-intragenic: χ2(1, N = 2154) = 1.10, P = 0.29. For number
of SV-SVAs within 50 kb of TSS: χ2(1, N = 987) = 172.3, P < 2.2 ×
Structural variation analysis 10−16. For number of SVAs in AD/PD LD blocks: PD (23/8.8,
Structural variant data were retrieved from Audano et al. (2019) χ2 (df: 1) = 23.195, P < .00001), ASD (38/17.8, χ2 (df: 1) = 23.057, P
and alternate loci were removed. For each repeat class of interest, < .00001), bipolar disorder (36/15.6, χ2 (df: 1) = 26.939, P <
regions with one or both ends outside the repeat that overlapped .00001), schizophrenia (69/43.6, χ2 (df: 1) = 15.018, P = .000106),
> 95% with the total repeat length were filtered out to exclude MS (19/10.2, χ2 (df: 1) = 7.691, P = .00555), AD (13/7.7, χ2 (df: 1)
full insertions from the analysis. Transposable elements that = 3.696, P = .0545), neuroblastoma (1/0.6, χ2 (df: 1) = 0.296, P =
showed EP300 (enhancer) marks in cortical organoids were select- .586), and ALS (1/0.8, χ2 (df: 1) = 0.0276, P = .868).
ed, and the coordinates were extracted from RepeatMasker (UCSC
Genome Browser hg38). The alternate haplotypes were removed
from each TE subclass, and distribution plots were used to select Genome-wide analysis of structural variation within TEs
a minimum length per TE subclass (Supplemental Table S1), which Structural variations in SVAs were additionally analyzed by align-
was used as criteria to filter the elements. All analyses were per- ing reference SVA sequences with SVAs identified in WGS files
formed using GenomicRanges package version 1.36.1 (https (GCA_002180035.3_HG00514_prelim_3.0_genomic.fna, HG007
://bioconductor.org/packages/release/bioc/html/GenomicRanges 33_prelim_1.0, HG01352_prelim_2.1, HG02059_prelim_1.0, NA
.html) in R version 3.6.0 (2019-04-26) (Lawrence et al. 2013; R 19240_prelim_3.0), using the te-polymorphisms-analysis.py
Core Team 2019). For script, see Rcode_SVsinTEs in Supplemental script (see Supplemental Code). Because this analysis included ex-
Code. Because the annotation of SVAs in RepeatMasker for hg38 tensive manual interpretation of output, only SVAs on Chromo-
includes many SVA fragments near one another, we merged these some 1 were analyzed in five individuals to confirm high
using the join_sva.py code (see Supplemental Code). For Figure structural variability in SVAs. In short, reference sequence and
1D, structural variation locations were plotted at SVAs using data 500 bp flanking sequences were retrieved from hg38 using the
of Audano et al. (2019) and the deepTools (Ramírez et al. 2016) Bio.SeqIO package from Biopython (Cock et al. 2009). lastdb (Kieł-
package at the Galaxy platform (Goecks et al. 2010; Afgan et al. basa et al. 2011) was used to build an index of the WGS files. SVA-
2018). To include hexamer repeats not annotated in the Repeat- flanking sequences with ≥90% similarity to reference were identi-
Masker (hg38 assembly) as SVA, simple repeats at the 5′ side of fied in the sequencing contigs using lastal (Kiełbasa et al. 2011),
SVAs with a size >1000 bp were merged with the SVA if they and the sequence in between the flanks with the highest similarity
were within 20 bp of each other using BEDTools (Quinlan and was stored as SVA sequence. Pairwise sequence alignment of refer-
Hall 2010) merge. The structural variation data were filtered as de- ence SVA sequence and SVA sequence identified in contigs was
scribed previously. Insertions were transformed into deletions for performed using EMBOSS Needle or Stretcher (Myers and Miller
clarity of overlap (insertions were represented as only 1 bp overlap, 1988) to determine structural variation relative to the reference
which were not clearly visible in the heatmap). computeMatrix genome.
(Galaxy Version 3.3.2.0.0) was used to prepare the data for profile
plotting with the following settings: regions were scaled to the
mean size of SVAs containing structural variation (1908 bp), ‐‐bin- LD block analysis
Size 1, ‐‐sortRegions descend, ‐‐sortUsing mean, ‐‐missingDataAs- Linkage disequilibrium (LD) blocks (threshold r 2 ≥ 0.8) were deter-
Zero True. Heatmap and coverage plots were generated using mined with the SNiPA Block Annotation tool (https://snipa
Genome Research 11
www.genome.orgYou can also read