A comparative analysis of sport and economic success through the example of top- and mid-ranking Hungarian water polo clubs - AKJournals
←
→
Page content transcription
If your browser does not render page correctly, please read the page content below
A comparative analysis of sport and economic
                                     success through the example of top- and
                                     mid-ranking Hungarian water polo clubs

International Review of         Anett Mészáros1, Bence András Bács2, Éva Bácsné Bába3p                                          and
Applied Sciences and            Tamás Madarász3
Engineering
                                1
                                    DVSE Waterpolo Kft, Debrecen, Hungary
                                2
DOI:                             Department of Accounting, Institute of Accounting and Finance, University of Debrecen, Debrecen,
10.1556/1848.2022.00436         Hungary
© 2022 The Author(s)            3
                                    Institute of Sport Management, University of Debrecen, Debrecen, Hungary

                                Received: December 6, 2021 • Accepted: January 6, 2022

ORIGINAL RESEARCH               ABSTRACT
PAPER
                                The biggest question of professional sports is how to compete successfully in the global economic
                                framework, simultaneously in terms of the sport and in economic terms. As a result, in addition to
                                indicators measuring sports-related effectiveness, the need for an economic analysis of sport has also
                                emerged. Most academic research into the economic aspects of sports are related to the analysis of
                                North American major league sports, as well as to European football. Water polo is also a spectator
                                team sport, yet its economic analysis is almost entirely missing. In this article, we present an economic
                                analysis of the operation of five men’s water polo teams – the top four teams in terms of the sports
                                results and one from the mid-range – competing in the highest-level national championship in
                                Hungary. Our aim is to determine, on the basis of the analysis of the data, the relationship between
                                effectiveness in sports and the economic background of the teams.
                                    It can undoubtedly be concluded that, in addition to appropriate professional decisions, it is the
                                economic situation of a club that has a clear impact on their effectiveness; in other words, up to a certain
                                point, the more disposable funds and wider range of assets a sports company has, the more effectively it
                                can prepare and the better results it will have in the various domestic and international championships
                                and tournaments. CIT (corporate income tax benefits, “TAO” in Hungarian) support is fundamentally
                                important in the field of youth sports development. While professional sports in Hungary are built on
                                the development of junior players, there is still no clear link between the successfulness of the adult and
                                the junior teams. The first-division teams of the clubs providing the best junior players are frequently
                                in the mid-range or occasionally among the weakest teams in the national championship.
                                    Our research has shown that apart from the fact that some teams are extremely successful in the
                                water polo championship, the outcome of many matches becomes quite predictable. Based on these, the
                                uncertainty of the outcome is compromised, and the championship becomes less exciting and also loses
                                some of its audience.

                                KEYWORDS
                                business aspects in sport, economic success, sport success, water polo championship, predictable outcome

                                1. INTRODUCTION
p
  Correspondent author.
                                The role of sport has increased and changed significantly in recent years. Originally a private,
E-mail: bacsne.baba.eva@econ.
unideb.hu                       leisure-time pursuit of individuals based on movement, now such activities also count as
                                sports that are already devoid of the original characteristics. One of the most important
                                changes is that sport has gained an economic significance. The emergence of such business
                                aspects is a phenomenon that is both sport and country-specific. It is linked, on the one hand,
                                to the inherent characteristics of the given sport (the inner values, sets of rules, method of

                                                                                               Unauthenticated | Downloaded 06/16/22 04:41 PM UTC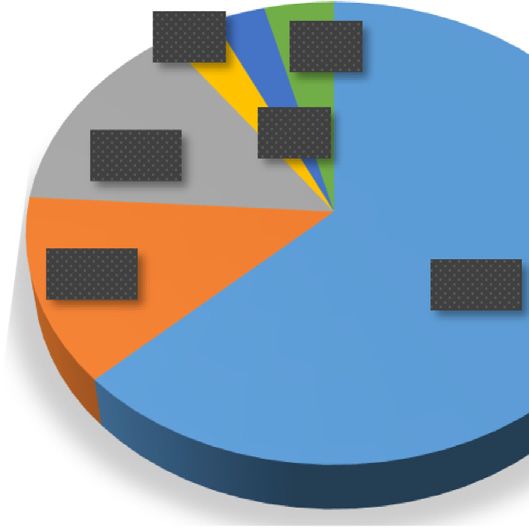
2                                                                   International Review of Applied Sciences and Engineering

conduct, duration, location, as well as the resulting media         recent decades, the role of the state is still crucial. After the
capacity of the sport concerned), and to other characteristics      political changes in 1989/1990, the state first withdrew from
(the economic system, level of development, cultural tradi-         supporting sport almost entirely, partly because investments
tions of the given country, external social and economic            were needed in other fields at the time, and partly because –
changes) [1]. It is a phenomenon specific to sports disci-           based on examples from Western countries – decision-
plines that business aspects have mostly had an impact in           makers believed in the spontaneous development of a self-
professional and spectator sports. Spectator sports are pur-        financing system of sport [6]. However, this expectation has
sued by professional athletes, and because of the nature of         not been met and, in fact, many companies formerly sup-
these sports, they have high entertainment value, they are          porting sports have either gone out of business or dis-
visually spectacular, well-suited to broadcasting, and there-       continued the support of sports organisations. Having
fore easy to sell. For spectators, the subject of the exchange is   recognized this problem, the state sought to grant certain
the ability to watch others play sports, i.e. they pay to enjoy     subsidies to sport, mainly in the form of tax reliefs (e.g. 1%
the spectacle of athletes pursuing the given sport [2]. These       of the personal income tax) [7, 8]. A stronger role under-
sports are primarily team sports, e.g. association football         taken by the state in sports financing can be linked to the
(soccer), basketball, handball, etc. [3]. The formation of          Sport XXI National Sport Strategy, for the implementation
sports-focused enterprises is particularly characteristic in        of which a major sport development action plan has been
case of these sports. According to András [4], sports com-          developed.
panies are entities that provide the organisational frame-              The next major form of state support was the intro-
works for sports-related business activities. In terms of the       duction of the system of CIT (corporate income tax benefits,
form, they are typically business associations, while in terms      “TAO” in Hungarian) support [9, 10]. This was enacted by
of their size, they are mostly in the category of small en-         way of Act LXXXII of 2011, which has created an oppor-
terprises. A characteristic feature of sports companies is that     tunity for taxpayers subject to corporate income tax (i.e.
they operate with a dual, occasionally conflicting system of         businesses) to support five spectator team sports (football,
aims. The requirement of effectiveness in both the sport and        handball, basketball, ice hockey and water polo). This form
in the area of economic operations is present in varying            of support can take two possible forms: companies can
degrees, but simultaneously. Based on the decision of the           either deduct the amount of support they provide as an
owners, it is the responsibility of the management to find the       expense, thereby reducing their tax base and therefore the
balance between the two. This dual system of aims is also           tax liability, or they can reduce the amount of the tax due by
reflected in another aspect, as the phenomenon of dual value         the amount of the support [11].
creation also appears in case of sports companies [5]. This             For sports other than the above five, the “Priority Sports
means that it is necessary to create value for the customers        Development” (KSF) system provided state resources for
and for the owners at the same time [1].                            operations. Sixteen different sports have been included in
    The biggest question of professional sports is how to           this support category (table tennis, athletics, wrestling,
compete successfully in the global economic framework,              rowing, judo, canoeing and kayaking, cycling, skating,
simultaneously in terms of the sport and in economic terms.         boxing, pentathlon, volleyball, sports shooting, tennis,
As a result, in addition to indicators measuring sports-            gymnastics, swimming, and fencing) [12, 13].
related effectiveness, the need for an economic analysis of             For the purposes of the present research, the presenta-
sport has also emerged.                                             tion of support for spectator team sports is highlighted, as
    Most academic research into the economic aspects of             water polo falls into this category. A brief description of the
sports are related to the analysis of North American major          Hungarian CIT (TAO) support system is also provided here,
league sports, as well as to European football. Water polo is       as this is a scheme that is unique to Hungary. The main
also a spectator team sport, yet its economic analysis is           revenue streams of commercial sports companies come from
almost entirely missing. In this article, we present an eco-        consumers (spectators), broadcasting royalties, sponsorship,
nomic analysis of the operation of five men’s water polo            merchandising products and player transfers. Each source of
teams – the top four teams in terms of the sports results and       revenue can be understood as a market (consumer market,
one from the mid-range – competing in the highest-level             market of broadcasting rights, sponsorship market,
national championship in Hungary. Our aim is to deter-              merchandising market and players market). The functioning
mine, on the basis of the analysis of the data, the relationship    of these markets has been analysed in detail by many re-
between effectiveness in sports and the economic back-              searchers [14, 15, 16, 17, 18]. In Hungary, however, spec-
ground of the teams.                                                tator team sports also received another significant source of
                                                                    revenue through the introduction of the CIT (TAO) support
                                                                    system [19, 20, 21]. This support system is needed mostly
2. REVIEW OF THE RELEVANT LITERATURE                                because fully market-based sports system has not yet been
                                                                    established in Hungary [22, 23, 24]. At the same time, it
Examining the operation of the system of sports today               should also be pointed out that the funding received through
globally, we can differentiate between state and business-          this revenue stream can only be used by the sport organi-
funded systems. In Hungary, although the strengthening of           sations supported for the development of specific areas,
business-type elements has been clearly recognisable in             such as:

                                                                                             Unauthenticated | Downloaded 06/16/22 04:41 PM UTC
International Review of Applied Sciences and Engineering 3
–the performance of youth sports development activities, 3% 4%
–covering expenses incurred in connection with competitions, Football
–personnel-type expenses, 3%
14% Handball
–investments in and refurbishments of fixed assets, also
including infrastructural developments to meet safety Basketball
requirements, 13% 63% Waterpolo
–tasks related to education and training [25].
Hockey
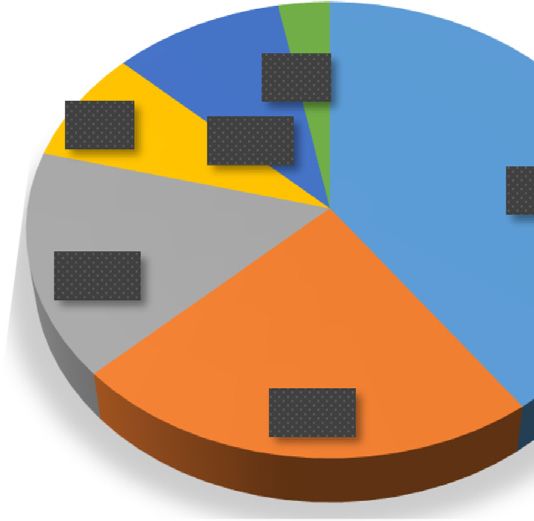
Between 2011 and 2019, the total approved amount of
support received via the CIT (TAO) system was approxi- Volleyball
mately HUF 913 billion. Different sports receive varying
degrees of support (Fig. 1), with the highest amount given
to football [26, 27, 28] and the lowest to volleyball; how- Fig. 2. The distribution of the issued competition licences among
ever, it should also be mentioned in this context that spectator sports
volleyball has been considered a spectator team sport only Source: Based on the report by the Hungarian Football Federation [29]
since 2017.
In terms of distribution of the support according to the
above legal titles, the largest share was for youth sports 3. MATERIALS AND METHODS
development activities at 47%, followed by investments in
fixed assets (also including real estate development pro-
In recent seasons, typically there were 16 teams competing
jects), and only the remaining 10% was used for other
in the highest-level water polo league in Hungary called
purposes, such as personnel-type expenses (not including
“E.ON Men’s Nationwide Championship I” (commonly
the wage costs of professionals working in youth sports
abbreviated “OB I”). If we examine the final results of the
development), competitions or the remuneration of con-
championship in the past six seasons, we can find that it was
tributors. These proportions clearly reflect that the main
always the same four teams (Eger, FTC, OSC and Szolnok)
objective of the system is to support the development of the
that finished in the top four positions, although their order
next generation of athletes. The proportion of holders of
changed from year to year. Therefore, we focused our
valid competition licences in the abovementioned sports is
research on these top four clubs, and we also included in the
shown in Fig. 2.
sample a fifth one, examining the results of DVSE of
On the basis of the above, it can be seen that the support
Debrecen, which is a middle-ranking team in the champi-
provided meant immense help for sports organisations and
onship. Each of the entities operating the teams examined
youth development programmes; at the same time, the
are economic associations, specifically Hungarian limited
reasonable use of the support is strictly controlled by the
liability companies (“kft.”).
competent national federations.
In the course of our analysis, we examined the sport and
These significant amounts of state support also appeared
economic results of the water polo clubs in Men’s Nation-
in the reports of Hungarian water polo clubs, increasing the
wide Championship I.
levels of their balance sheet assets and liabilities. In the
The sport results achieved by the teams can be found in
present research project, we examined the economic man-
the database available via the website of the Hungarian
agement, the assets, financial and income positions of water
Water Polo Federation, back to the 2012/2013 season. The
polo clubs competing in the highest league of the Hungarian
list of players in each club playing in the given champion-
championship.
ship and season is also available in the database, which can
be used to further refine the team’s strength in the sport, in
addition to its ranking achieved on the team level.
In addition to the sports results, to analyse also the
3% economic management of the clubs, we used the data of the
8% Football simplified annual reports of the sports companies available
10%
40% Handball through the electronic report filing portal published by the
Basketball Company Information and Electronic Company Pro-
16% Waterpolo ceedings Assistance Service of the Ministry of Justice. Via
Hockey this website, one can access the general annual reports
Volleyball
closing the business years, as well as the supplementary
23% notes to those reports, for all sports companies included in
the business register and operating in Hungary.
Using these data, we analysed sports performance, the
Fig. 1. The share of spectator team sports in the total amount of assets, financial and income positions of the companies, and
support granted between 2011 and 2019 the interrelationships between these.
Source: Based on the report by the Hungarian Football Federa- We have examined the composition of liabilities, which
tion [29] provides information on the company’s equity ratio, its
Unauthenticated | Downloaded 06/16/22 04:41 PM UTC
4                                                                    International Review of Applied Sciences and Engineering

viability and dependence on outside capital. Indicators of the       the analysis of profitability can be interpreted, we essentially
capital structure need to be examined with care, since the           took into account the values of three profitability indicators:
capital needs in different sectors (manufacturing, commerce          ROA, ROE and ROS, i.e. the profitability relative to assets,
or service) are very different [30].                                 equity and sales revenue [30].
                                                                         The value of the squad of players can be only deducted
                                       D=E=F=G
            Capital structure ¼ P                                    on the basis of personnel-type expenses; however, due care
                                    Equity and Liabilities           should be exercised when relying on these data. There are no
  Liquidity indicators provide information on the com-               publicly available values of similar accuracy for sale reve-
pany’s short-term solvency and readiness to pay.                     nues, and therefore, only the scale of these can be estimated
                                                                     and compared.
                                          Current assets                 Once we learn about the economic management of each
           General liquidity ratio ¼
                                       Short-term liabilities        of the organisations, it is possible to make comparisons
   The higher value indicates that the company is expected to        between them.
be able to meet its short-term payment obligations in a                  We started this process by comparing the structure of the
timely manner and to finance its operating costs in the near         clubs’ economic management. Since the main activities of
future. By contrast, the low value of the indicator may              each of these businesses is sport-related activities, no sig-
suggest that the company has problems in meeting its short-          nificant differences were expected in their structures of
term obligations, which may also cause operational diffi-            economic management. In the next step, we examined the
culties. The ideal value of the indicator is between 1.3 and         financial position of the enterprises concerned, looking for
1.7. In many cases, it is worth examining the quick liquidity        differences or similarities between the data.
ratio and the cash-level liquidity ratio as well to obtain a             The investigation also extended to comparisons between
complete picture of the liquidity position of the enterprise,        their revenues, the amounts of CIT (TAO) support and the
but the sporting organisations examined typically have re-           personnel-type expenditures. In order to further analyse the
ceivables and liquid assets, and therefore the general               differences and similarities, we examined how many per-
liquidity ratio more or less includes the values of the addi-        manent members their first-division squad consists of, and
tional indicators. Although payment difficulties are not ex-         how many of them are of junior age.
pected in the case of a high value of the indicator, proper              We compared the values obtained against the results of
attention should be paid to the fact that an excessively high        the teams in the past six seasons of the OB I championships.
value of the liquidity indicators is not favourable for the          As two of the organisations presented have been operating
enterprise either. This is due to the fact that although the         in their current form only since 2014, the examination of the
risk is low, maintaining assets can be costly and the profit-        previous seasons was not relevant, but six seasons are a
ability level decreases without committing too much of the           sufficiently long period to identify certain trends in the
liquid assets [30].                                                  results.
                                                                         Last but not least, we examined whether the results of the
    Net working capital ¼ Current assets  Short-term liabilities    first-division team and the junior teams are correlated.
                                                                         In the course of the analysis of the data obtained, we
   In case of net working capital, the main criterion is
                                                                     were looking for the relationships between a team’s sport
compliance with the principle of matching, namely that the
                                                                     successes and their economic background.
financing of long-term assets should be matched with long-
term liabilities, while short-term assets with short-term
liabilities. If the value is positive, the current value of short-   4. RESULTS
term assets exceeds the liabilities, which means that a part of
the short-term assets are financed from long-term liabilities.
If the value of the indicator is negative, then the amount of
                                                                     4.1. The economic analysis of the examined sport
short-term liabilities exceeds the value of short-term assets,       organisations
which means that there are long-term assets financed from            The company’s equity ratio is increasing, as a result of the
short-term liabilities.                                              year-on-year increase in after-tax revenue. The company
    Debt indicators provide information on the company’s             does not create provisions. Even though the proportion of
long-term solvency and willingness to pay. For debt, we              liabilities varies in the capital structure, its value is kept at
examine the degree of indebtedness (Debt/Σ Equity and                almost the same level, so that its proportion can decrease. As
Liabilities), which shows the ratio of debt in case of which         regards the capital structure, it can be observed that the
the lowest possible value is favourable [30].                        value of deferred incomes and accrued expenses is signifi-
                                      Equity
                                                                     cant (Table 1).
                  Equity ratio ¼                                         The liquidity ratio has varied quite significantly in recent
                                   Debts þ Equity
                                                                     business years. For 2019, the indicator is well above the ideal
   In the analysis of profitability, the profit categories are       ceiling of 1.7. This leads to the conclusion that the company
examined in relation to a projection basis. In case of loss          does not currently have and is not expected to have a
after tax, the analysis of profitability is not relevant. Where      liquidity problem. The increasing value of the liquidity ratios

                                                                                              Unauthenticated | Downloaded 06/16/22 04:41 PM UTC
International Review of Applied Sciences and Engineering 5
Table 1. Economic indicators of FTC Waterpolo Kft
2014 2015 2016 2017 2018 2019
Indicators of the capital structure
Equity ratio 22% 13% 4% 1% 1% 11%
Ratio of provisions 0% 0% 0% 0% 0% 0%
Ratio of liabilities 32% 87% 30% 19% 18% 8%
Ratio of deferred income and accrued 46% 27% 73% 82% 81% 81%
expenses
Liquidity indicators
General liquidity ratio 2.42 0.73 2.91 1.11 1.64 7.37
Net working capital (eFt) 25,561 19,031 170,978 7,274 41,742 370,207
Debt stock
Debt ratio 32% 87% 30% 19% 18% 8%
Profitability indicators
ROA 11% 29% 0.1% 1% 2% 10%
ROS 41% 68% 0.3% 4% 3% 87%
Source: Own editing (2021) based on the organisation's simplified annual accounts.
is related to the increase in net working capital, and it can be In most business years, the liquidity indicators are below
observed that in terms of changes in short-term assets and the ideal range of 1.3–1.7 Due to these low values, long-term
short-term liabilities, the value of short-term assets increases liquidity problems may also arise. The negative net working
more than the value of short-term liabilities. capital also suggests a risk of liquidity problems. This value
While payment difficulties are not expected, due care indicates that part of the fixed assets are financed by short-
should be paid to the fact that an excessively high value of term loans.
the liquidity indicators is not favourable for the enterprise The high level of indebtedness also reflects the above,
either, since maintaining assets can be costly and the prof- namely that the company has a high level of debt relative to
itability level decreases without committing too much of the its equity. Based on the high amount of debt and negative
liquid assets. The level of indebtedness was extremely high in taxed profit, the analysis of profitability indicators is not
2015, which was due not to the high level of liabilities but to relevant.
the low level of assets. Since then, this indicator has In the economic analysis of Szolnok Waterpolo Sport
decreased steadily, and has reached a low figure of 8% by Club Kft., it is important to bear in mind that in the case of
2019. The enterprise does not currently have to be con- this company, the adult and the junior teams are competing
cerned with the danger of over-indebtedness. In the six in the framework of the same enterprise (Table 3).
business years examined, FTC Waterpolo Kft. had a loss Although the company’s economic management is good
after taxes only once, in 2015. The amount of after-tax in terms of paying attention to low debt and ensuring that it
profits has since increased, including an eight-fold increase has sufficient liquidity, the company’s profitability is still
from 2018 to 2019. Accordingly, the return on assets (ROA) low. The profitability indicators were close to 0, due to the
and the return on sales (ROS) indicators also increased. low level of after-tax profits, but they are at least positive
The high proportion of liabilities can be clearly seen in unlike in case of many other companies.
the company’s capital structure. In addition, the equity ratio The Eger water polo club fundamentally keeps the level
of the company is low, as it only has low or negative after- of its liabilities at a low level, and it does not have any sig-
tax results (Table 2). nificant outstanding amounts. The proportion of deferred
Table 2. Economic indicators of OSC Waterpolo Kft
2014 2015 2016 2017 2018 2019
Indicators of the capital structure
Equity ratio 5% 1,150% 4,261% 49% 25% 4%
Ratio of provisions 0% 0% 0% 0% 0% 0%
Ratio of liabilities 24% 846% 4,361% 51% 125% 96%
Ratio of deferred income and accrued 71% 404% 0% 0% 0% 0%
expenses
Liquidity indicators
General liquidity ratio 4.16 0.11 0.01 1.09 0.46 0.48
Net working capital (eFt) 11,655 8,719 9,757 13,251 22,505 15,623
Debt stock
Debt ratio 24% 846% 4,361% 51% 125% 96%
Source: Own editing (2021) based on the organisation's simplified annual accounts.
Unauthenticated | Downloaded 06/16/22 04:41 PM UTC6 International Review of Applied Sciences and Engineering
Table 3. Economic indicators of Szolnok Waterpolo Sport Club Kft
2014 2015 2016 2017 2018 2019
Indicators of the capital structure
Equity ratio 35% 36% 33% 32% 32% 33%
Ratio of provisions 0% 0% 0% 0% 0% 0%
Ratio of liabilities 3% 4% 9% 9% 10% 12%
Ratio of deferred income and accrued 61% 59% 59% 59% 58% 55%
expenses
Liquidity indicators
General liquidity ratio 5.35 3.90 1.87 1.88 2.29 1.92
Net working capital (eFt) 210,913 176,745 101,022 115,021 179,148 155,681
Debt stock
Debt ratio 3% 4% 9% 9% 10% 12%
Profitability indicators
ROA 18% 0.02% 4% 0.06% 0.08% 0.07%
ROE 51% 0.06% 13% 0.19% 0.25% 0.23%
ROS 53% 0.07% 14% 0.25% 0.27% 0.26%
Source: Own editing (2021) based on the organisation's simplified annual accounts.
incomes and accrued expenses in the undertaking is signif- The company does not create provisions. The amount of
icant. During the period examined, the liquidity of the deferred incomes and accrued expenses is significant
company decreased from an extremely high value to well (Table 5).
below the ideal value, while its net working capital turned The situation of the sports undertaking is also inadequate
from positive to negative (Table 4). as regards its financial position. The overall liquidity ratio
If this tendency also continues in the future, it may lead did not reach the ideal value of 1.3–1.7 in any year, and is
to long-term liquidity problems in the sports company. In even decreasing from year to year. On the basis of this, it is
accordance with the above, the level of indebtedness is also expected that the company will have liquidity problems. The
increasing, but it is not high except for 2019. The profit- persistently low negative value of the net working capital
ability indicators also show that the company had negative also shows that the company’s financial leeway is rather
after-tax results in the past 3 business years, and therefore, limited, and it may even become insolvent.
the interpretation of the indicators is not relevant. The above is further supported by the debt ratio ac-
The examination of the capital strength of the Debrecen cording to which the liabilities of the company are high. The
company demonstrates that it has long been significantly analysis of profitability indicators is not relevant in the case
below the critical level 30%, and is in fact a negative value. of DVSE Kft., since the value of the after-tax profit is
This value results from the fact that the owner’s equity is negative year after year.
negative, which is generated by the continuous negative af-
ter-tax result. In addition, the proportion of liabilities is also 4.2. Comparison of the economic characteristics of
high, so it can be concluded that the debt of the company is
the sport organisations examined
significant and constantly increasing, while it should also be
noted that this debt is not owed to external partners, but to On the basis of the asset and capital structure indicators
the parent organisation, Cívis Póló Waterpolo Sport Club. examined separately for each sport organisation, first of all it
Table 4. Economic indicators of Eger Waterpolo Kft
2014 2015 2016 2017 2018 2019
Indicators of the capital structure
Equity ratio 14% 43% 42% 39% 4% 12%
Ratio of provisions 0% 0% 0% 0% 0% 0%
Ratio of liabilities 4% 5% 7% 4% 10% 44%
Ratio of deferred income and accrued 83% 52% 51% 57% 85% 68%
expenses
Liquidity indicators
General liquidity ratio 26.71 13.79 5.74 9.88 2.00 0.28
Net working capital (eFt) 86,787 93,385 52,176 60,508 23,538 68,162
Debt stock
Debt ratio 4% 5% 7% 4% 10% 44%
Source: Own editing (2021) based on the organisation's simplified annual accounts.
Unauthenticated | Downloaded 06/16/22 04:41 PM UTCInternational Review of Applied Sciences and Engineering 7
Table 5. Economic indicators of DVSE Waterpolo Kft
2014 2015 2016 2017 2018 2019
Indicators of the capital structure
Equity ratio 64% 149% 305% 668% 732% 290%
Ratio of provisions 0% 0% 0% 0% 0% 0%
Ratio of liabilities 84% 106% 301% 719% 758% 330%
Ratio of deferred income and accrued 81% 142% 104% 49% 74% 60%
expenses
Liquidity indicators
General liquidity ratio 1.19 0.94 0.22 0.08 0.08 0.22
Net working capital (eFt) 3,015 827 68,550 153,840 183,984 188,793
Debt stock
Debt ratio 84% 106% 301% 719% 758% 333%
Source: Own editing (2021) based on the organisation's simplified annual accounts.
can be concluded that the assets-related characteristics of the positive, such profit was found to be relatively low in its
sports companies were similar in terms of proportions. proportions. This is due to the fact that even the mainte-
As can be expected in case of a sport-related activity, the nance of the majority of Hungarian sports companies is
fixed assets consisted predominantly – and quite often difficult, as they do not operate on a market basis, and
entirely – of tangible assets. The current assets of the sports therefore they hardly generate any profit or often none at all.
companies examined consist of receivables and liquid assets, On the basis of Tables 1 and 2, it can be seen that FTC
with the proportions of these showing differences only. Waterpolo Kft. and Szolnok Waterpolo Sport Club Kft. have
Similarities can also be found in terms of the companies’ the largest volume of assets. Although the company in
capital structures. One such similarity is that none of the Szolnok has an outstanding high volume of fixed assets, the
companies creates provisions. This is due to the fact that majority of this consists of real estate property. Further, it
there is fundamentally no activity or investment that would should also be kept in mind that in case of this club, the
justify the creation of provisions. Another similarity is that adult and the junior teams operate within the same
the liabilities in each case are short-term liabilities, which organisation.
means that the companies have no subordinated or long- The average value (in thousand HUF) of the main assets
term liabilities. Further, the high proportion of deferred components of the sports companies examined are shown in
incomes and accrued expenses is also apparent. This is Table 6 for each the six financial years under review, in a
because the financial year does not correspond to the breakdown according to balance sheet groups.
championship season in case of any of the companies, and
therefore the incomes have to be treated as deferred incomes
as they are not used in full within the current year, in case of
4.3. Analysis of the income positions
CIT (TAO) support either. In order to analyse the income positions of the companies,
Another common characteristic feature is that the prof- we have examined the highlighted lines of the profit and loss
itability indicators can only be interpreted in a few cases, as statements: the average values of revenues, personnel-type
the after-tax result of the sport companies was often a expenses and after-tax results. In case of revenues, it can be
negative value (loss). Even where the after-tax result was observed that the revenue of Szolnok by far exceeds the
Table 6. Average balance sheet groups between 2014 and 2019 (in thousands of HUF)
FTC OSC Szolnok Eger DVSE
Waterpolo Waterpolo Waterpolo Waterpolo Waterpolo
Kft. Kft. Sport Club Kft. Kft. Kft. Sum.
Assets
Fixed assets 146,450 11,170 1,083,813 102,056 7,416 1,350,905
Current assets 160,552 15,735 267,285 65,891 22,126 531,588
Deferred income and accrued 448 306 31,926 415 975 34,070
expenses
Equity and liabilities
Equity 10,966 1,211 462,263 32,367 113 461 390,923
Provisions – – – – – –
Obligations 61,097 25,827 110,863 24,519 120,956 343,261
Deferred income and accrued 235,397 2,596 809,897 111,477 23,099 1,182,466
expenses
Source: Own editing (2021) based on the organisation's simplified annual accounts.
Unauthenticated | Downloaded 06/16/22 04:41 PM UTC8 International Review of Applied Sciences and Engineering
revenues of the other teams (although it should be noted found, as their personnel-type expenditure was almost
that this revenue also includes HUF 100 to 130 million of identical in the last four financial years, with by far the
CIT (TAO) support per year for the purpose of youth sports lowest value in 2019 compared to the teams examined.
development). In addition, the revenues of FTC and Eger At the same time, it should be noted that personnel-type
also stand out. Surprisingly, the revenues of OSC do not expenses cover the salaries of several employees, and in
significantly exceed those of DVSE, but in recent financial order to get a more nuanced picture of the distribution of
years, their revenues have steadily increased. these amounts, we should also take into consideration the
Eger Waterpolo Kft. and FTC Waterpolo Kft. applied for employee headcounts. For this purpose, I used the team data
the largest amount of CIT (TAO) support, but these included on the official websites of the clubs. This headcount is not
grants for tangible assets (real estate), for which 30% own the number of players in the tournament, but in the “per-
resources were required, and these investments are carried manent” squad of players. Based on the database of the
out with ex-post funding, i.e. the organisations must have Hungarian Water Polo Federation, it can be seen that the
sufficient capital for them. In the case of Szolnok and squad of Eger was the largest with 20 players, followed by
Debrecen, these grants were typically pre-financed tangible DVSE which had 19 players. In the case of Eger, there were 5
assets investments in equipment, machinery and sports players of junior age playing in the championship, while in
equipment. It is conspicuous that OSC did not make use of case of DVSE there were 3. By contrast, the squads of FTC
CIT (TAO) support until 2019, and submitted an application and OSC consisted of 15 players each, and Szolnok’s squad
for a low amount of support only for the 2020/21 season. included 14 players, all of them adults. Overall, it can be
After the examination of revenues, the next step is the concluded that, in the case of Eger and DVSE, the player’s
comparison of personnel-type expenses. It is important to salaries were distributed among more players.
emphasise that, although the salary of professional athletes is
included in this line, far-reaching conclusions cannot be 4.4. The analysis of sport performance in case of the
drawn from these expenses. This category also includes the teams examined
wages of other sports professionals, including in the case of
Szolnok the wages of youth sports development pro- Table 8 summarises the rankings achieved by the teams in
fessionals. The comparison can provide as an idea of the recent seasons. It should be noted here that the 2019/20
value of the squad of players, which is only a rough estimate, season, due to the COVID-19 pandemic, was suspended in
and not an accurate amount. March 2020, after the first match of the middle-stage, and
Table 7 clearly shows that FTC has the largest personnel- then closed without final results announced, and therefore,
type expenditure, followed by Szolnok, and then by Eger, the data in the table show the points at the time of the
whose expenditure is less than half of the first two. The suspension of the season.
fourth one is DVSE, and then OSC with an almost identical The research was carried out before the end of the 2020/
amount. 21 season, so the rankings for this season were determined
Another interesting fact is that in 2018 FTC saw a large, on the basis of the points won in the 20th round of the
almost HUF 130 million increase after the cooperation with regular season.
Telekom, which increased by a further HUF 100 million in All in all, we can see that FTC finished consistently in the
2019. In 2019, the personnel-type expenditure of FTC first place since 2017. It has an outstanding squad of players,
Waterpolo Kft. was more than five times higher than that of which is indicated by the fact half of the Hungarian national
DVSE in the same year. In the case of Szolnok, the amount team consists of players from FTC, and that the club also has
of the expenditure was balanced in the financial years excellent results in international tournaments. OSC has also
examined: it did not have any significant variation, but it had outstanding performance, with a number of players also
somewhat continuously increased. Eger experienced a sharp included in the national team, but they have not been able to
increase from year to year, with a six-fold increase in the win the national championship recently. Another top team is
amount of staff personnel-type expenditure from 2014 to Szolnok, in the seasons examined, this club of great history
2019. In the case of OSC, there was also a steady increase, finished in first place most often. Szolnok has several players
but from 2017 to 2018, this increase was more steep, almost on the Hungarian national team, including the latter’s goal-
threefold. For DVSE, there was no outstanding increase keeper for years, as well as several players on the national
Table 7. Average revenues and personnel expenses between 2014 and 2019
FTC OSC Szolnok Waterpolo Eger DVSE
Waterpolo Kft. Waterpolo Kft. Sport Club Kft. Waterpolo Kft. Waterpolo Kft. Sum.
Net sales 102,846 29,767 412,721 171,981 41,156 758,471
Other revenues 258,466 55,420 310,016 112,262 24,518 760,681
CIT (TAO) support 56,530 - 21,326 59,810 16,640 154,306
Personal expenses 269,435 69,217 246,550 109,719 82,531 777,452
Profit after tax 10,739 7,647 33,668 –4,308 –35,783 –3,331
Source: Own editing (2021) based on the organisation's simplified annual accounts.
Unauthenticated | Downloaded 06/16/22 04:41 PM UTCInternational Review of Applied Sciences and Engineering 9
Table 8. Rankings achieved by teams
FTC OSC Szolnok Waterpolo Eger DVSE
Waterpolo Kft. Waterpolo Kft. Sport Club Kft. Waterpolo Kft. Waterpolo Kft.
2014/2015 4 2 1 3 10
2015/2016 4 3 1 2 9
2016/2017 4 3 1 2 11
2017/2018 1 4 2 3 8
2018/2019 1 2 3 4 8
2019/2020 1 2 3 4 15
2020/2021 3 2 1 7 14
Source: Own editing (2021) based on the results in the MVLSZ database (downloaded: 03/04/2021).
teams of other countries. Eger is also a team of significant In addition to this striking difference, it can also be seen that
history and traditions. In recent years, they always finished none of the teams are profit-oriented, and with the excep-
the championship in or near the top 3 positions. Eger also tion of FTC their profitability is close to zero, and in many
has several players on the Hungarian national team, and they cases they in fact produce negative tax results. This allows us
are also proud of building heavily on their own junior to conclude that, on the one hand, their fixed assets are of
players. DVSE is fundamentally a middle-ranking team in higher combined value, and they also have more liquid as-
the championship, and it does not have players on the na- sets through their revenues; at the same time, they also use
tional team, but it builds heavily on its junior base of players up these from year to year to the maximum extent. As result,
and those developed by themselves. In this generally young the best teams are able to compete in better conditions, both
team, junior players are also given an opportunity to make an in terms of infrastructure and financially. Teams are able to
appearance in the first division, but at the same time the team prepare, train, travel and participate in domestic matches
is not able to achieve outstanding results. more comfortably, or in case of injuries, they have the
Ultimately, a comparison with the successes of the junior possibility for more expensive and more efficient treatments.
teams does not show a close link with the performance of the Furthermore, what is also quite important, these teams also
teams in the OB I championship. Several players on junior have the possibility to sign more experienced, but at the
national teams of different age groups are playing in the same time also more expensive players, as also reflected in
teams of Eger and Debrecen, and among the teams outside the related cost items.
of Budapest they have outstanding junior development However, it can also be concluded that the financial
programmes, on which they also build in the adult teams, management of the professional teams is not significantly
but in the junior championships they usually finish in the affected by CIT (TAO) support. Although it helps in their
middle ranks. In the case of Szolnok, we can see similar operations, and the majority of organisations use this sup-
results: overall they have middle-ranking junior teams. The port for purchasing tangible assets, but it does not play a
junior teams of OSC are lagging behind the other clubs: decisive role. Among the teams examined, the CIT (TAO)
there were several seasons where they did not play in the support received was used for immovable property in-
championship or finished the season without any results. vestments in two cases; however, such transactions, also
FTC is a club from Budapest where the teams are closest to presuppose large amounts of own resources. Revenues from
the top 3 positions, also in the junior championships. other sources are fundamentally predominant.
Overall, however, we can conclude that the best junior teams CIT (TAO) support is fundamentally important in the
are those of KSI, BVSC-Zugló and UVSE, whose adult teams field of youth sports development. While professional sports
mostly finish in the middle range of the championship, just in Hungary build on the development of junior players,
like DVSE. In addition to the fact that there is no close there is still no clear link between the successfulness of the
correlation between the results of the first division and ju- adult and the junior teams. The first-division teams of the
nior teams, we can also conclude that the CIT (TAO) sup- clubs providing the best junior players are frequently mid-
ports are used according to their main purpose, namely for ranking or occasionally among the weakest teams in the
financing of youth sports development. For this purpose, the national championship. At the same time, the best adult
majority of the teams in the national championship receive teams can easily sign young players, and the cost of their
HUF 200–300 million per season, which ensures their development also does not cause problems, and the young
smooth operation and participation in the championships. players can be integrated in to the professional team for
further development.
On the basis of these factors, it can undoubtedly be
5. DISCUSSION concluded that, in addition to appropriate professional de-
cisions, it is the economic situation of a club that has a clear
Based on the above, it is clear that there is a difference of impact on their effectiveness; in other words, up to a certain
scales between the top teams and the mid-ranking team, not point, the more disposable funds and wider range of assets a
only in terms of results, but also in their financial situations. sports company has, the more effectively it can prepare and
Unauthenticated | Downloaded 06/16/22 04:41 PM UTC10 International Review of Applied Sciences and Engineering
the better results it will have in the various domestic and first-division teams, as the first-division teams of the clubs
international championships and tournaments. providing the best junior players are frequently in the mid-
As Hungarian sports financing also shows the elements range or occasionally among the weakest teams in the na-
of the European sport model, there is no salary cap in tional championship.
Hungary as opposed to the American model, so there is no Therefore, we can conclude that there is a close link
limit on the remuneration of a player or a full club team. As between the sport results of a team and its economic back-
a result, there are huge differences between the teams in a ground; namely, the stronger the economic background is,
championship. This difference increases over time, as larger the more successful the given team is in national and in-
sponsors and supporters primarily invest in successful teams ternational championships and tournaments, provided that
and are more willing to cooperate with these. the appropriate professional decisions are also made. At the
This trend is not beneficial in the long term, as the un- same time, this raises further questions about the potential
certain outcome is greatly compromised due to the fact that for economic growth in the long term, since apart from the
there are several matches in a championship where it is not a fact that some teams are extremely successful, the outcome
question which team will win even before the players jump of many matches becomes quite predictable. Based on these,
into the water. Moreover, with the change in the organisa- the uncertainty of the outcome is compromised, and the
tion of the championship, namely that it only consists of the championship becomes less exciting and also loses some of
regular season and the play-off (each team playing a home its audience.
and away match with each other team), the number of
matches that do not hold any particular excitement in terms
of their outcome further increases, in comparison with the ACKNOWLEDGEMENTS
earlier regular season – middle stage – play-offs format.
Although water polo is considered in Hungary as a na- The preparation of this publication was supported by project
tional sport, since both the clubs and the national team are EFOP-3.6.1-16-2016-00022. The project was realized with
among the top of the world, the audience of the sport is still support from the European Union, with co-funding pro-
small. In general we can say that people almost only follow vided by the European Social Fund.
Hungarian water polo during the Olympic games and other
international events of high media attention. If a part of the
matches are fully one-sided and predictable, this will further
decrease the attention of the audiences.
REFERENCES
The professional staff of the Hungarian Water Polo
Federation is continuously striving to make the sport [1] K. András and I. Gergely, “A hivatásos vízilabda üzleti verseny-
interesting, exciting and faster with various changes to the képessége a médiaképesség tükrében–szabálymódosítások a vízi-
rules – in line, of course, with the international rules – but labdában,” 2015.
the balance between the strengths of the teams is still greatly [2] F. Dénes, “A futball eladásának közgazdasági alapjai,” Marketing
distorted. In addition to such modifications, it would be & Menedzsment, vol. 32, no. 3, pp. 9–17, 1998.
reasonable to introduce a set of rules on the squads of [3] T. Sárközy, “A sport mint nemzetstratégiai ágazat. Előnyök és
players, which idea has been suggested on multiple occa- hátrányok, hosszú távú kilátások5 sport as a strategic sector in the
sions, but was always discarded. Such rules could include national economy. Benefits, drawbacks and long-term perspec-
setting a maximum number of foreign players allowed on tives,” Polgári Szemle: Gazdasági ÉS Társadalmi Folyóirat, vol. 13,
each team, as well as limiting how many members of the nos 4-6, pp. 143–59, 2017.
national team each club can sign. [4] A. Krisztina, “Üzleti elemek a sportban”, Doktori (PhD) érteke-
zéstervezet, BKÁE Gazdálkodástani PhD Program, 2002.
[5] A. Chikán, Vállalatgazdaságtan. Budapest: Aula Kiadó Kft., 2003.
6. CONCLUSIONS [6] E. Rojo-Labaien, Á. R. Díaz, and J. Rookwood, Sport, Statehood
and Transition in Europe: Comparative Perspectives from Post-
By way of summary, we can say that there are many simi- soviet and Post-socialist societies. Routledge, 2020.
larities, but also a few major differences between the struc- [7] K. Ráthonyi-Odor and A. Borbély, “Sport-finanszírozás-eredmé-
tures of the water polo clubs examined. It is a similarity that nyesség? 5 Sports–financing–success?,” Testnevelés, sport, tudo-
they all work as sports companies; at the same time, the mány, vol. 2, nos 1-2, pp. 67–72, 2017.
assets at the disposal of a top team, and especially within [8] G. Kiss and J. Szabó, A sportvezetés, - szervezés és a sportmarketing
that the size of the liquid assets, can be several times as much alapjai. Szeged: Szegedi Egyetem Kiadó, Juhász Gyula Felsőokta-
as a middle-ranking team has. The research also showed that tási Kiadó, 2009.
CIT (TAO) support, on the basis of its main purpose, is [9] P. Berkes, “Marketingorientációs tényezők a honi professzionális
indispensable for youth sports development; however, its labdarúgás szponzorációs piacának tükrében,” Doktori értekezés.
role in case of professional clubs is not significant, since the Budapest: SOTE Nevelés-és Sporttudományi Doktori Iskola, 2008.
majority of their revenues comes from sponsorship and [10] B. Faragó, “A sportstratégiai ágazat erősödése Magyarországon a
other forms of support. It was also observed that there is no 2011-2016-os időszakban,” Tér-Gazdaság-Ember, vol. 3, pp.
close correlation between the results of the junior and the 94–109, 2017.
Unauthenticated | Downloaded 06/16/22 04:41 PM UTCInternational Review of Applied Sciences and Engineering 11
[11] P. Farkas and M. Fanici, “A TAO kedvezményezett csapatsportok információi alapján,” Int. J. Eng. Manage. Sci., vol. 4, no. 3, pp.
támogatóinak felmérése,” Magyar Sporttudományi Szemle, vol. 14, 117–25, 2019.
no. 53, pp. 30–4, 2013. [22] S. S. Andersen, B. Houlihan, and L.T. Ronglan, Managing elite
[12] T. Madarász, “Néhány választott egyéni sportág jelenlegi helyze- sport systems: Research and Practice. Routledge, 2015.
tének és versenyképességének elemzése Magyarországon,” Int. J. [23] E. Gulyás and T. Sterbenz, “A TAO közgazdasági racionalitása,”
Eng. Manage. Sci., vol. 1, no. 1, pp. 1–20, 2016. Published: A felsőoktatás szerepe a sportban, az élsportban és az
[13] Zs. Gősi and Zs. Bukta, “Sportszövetségek a kiemelt sportágfej- olimpiai mozgalomban, különös tekintettel a társasági adóból (TAO)
lesztés tükrében,” Taylor, vol. 11, no. 2, pp. 46–55, 2019. támogatott sportágak helyzetére és a támogatások hasznosítására.
[14] D. Funk, K. Alexandris, and H. McDonald, Consumer behaviour Tanulmánykötet Debreceni Egyetem Gazdálkodástudományi és
in sport and events. Routledge, 2008. Vidékfejlesztési Kara, Debrecen, pp. 117–30, 2014.
[15] M. Yoshida and J. D. James, “Customer satisfaction with game and [24] Magyar Labdarúgó Szövetség (MLSZ), TAO-Gráf, Jelentés a támo-
service experiences: Antecedents and consequences,” J. Sport gatási rendszer eredményeiről, 2020. https://tao-palyazatok.mlsz.hu/
Manag., vol. 24, no. 3, pp. 338–61, 2010. adat/dokumentum/5631/dokumentumok/taograf-2020.pdf.
[16] E. C. Da Silva and A. L. Las Casas, “Sport fans as consumers: An [25] P. Váczi, E. Boda, J. Herpainé Lakó, and A. Müller, “A Tao rendszer
approach to sport marketing,” Br. J. Marketing Stud., vol. 5, no. 4, hatásainak felmérése a magyar kosárlabda csapatoknál5 Assessing
pp. 36–48, 2017. Effects of the TAO System on Hungarian Basketball Teams,”
[17] R. Copeland, W. Frisby, and R. McCarville, “Understanding the Testnevelés, sport, tudomány, vol. 2, nos 1-2, pp. 79–82, 2017.
sport sponsorship process from a corporate perspective,” J. Sport [26] D. I. Fűrész and A. Takács, “A magyar látványsport-támogatási
Manag., vol. 10, no. 1, pp. 32–48, 1996. rendszer hatása a verseny kiegyensúlyozottságára,” Közgazdasági
[18] S. Szymanski, “The assessment: The economics of sport,” Oxford Szemle, vol. 68, no. 10, pp. 1089–108, 2021.
Rev. Econ. Policy, vol. 19, no. 4, pp. 467–77, 2003. [27] G. Bardóczy, “A látvány-csapatsport támogatások helyzete, per-
[19] Z. Bács and É. Bácsné Bába, “A TAO támogatási rendszer hatása és spektívái,” Publised: A felsőoktatás szerepe a sportban, az
szervezeti kezelése Debrecenben,” in A felsőoktatás szerepe a sport- élsportban és az olimpiai mozgalomban, különös tekintettel a
ban, élsportban és az olimpiai mozgalomban, különös tekintettel a társasági adóból (TAO) támogatott sportágak helyzetére és a
társasági adóból (TAO) támogatott sportágak helyzetére és a támo- támogatások hasznosítására című konferencia tanulmány kötete
gatások hasznosítására, L. Petridisz (szerk.), Debreceni Egyetem Debrecen, pp. 50–72, 2014.
Gazdaságtudományi és Vidékfejlesztési Kar, 2014, pp. 22–36. [28] R. Károly, “A TAO támogatásról – közérthetően,” in Piac és Profit,
[20] Zs. Gősi, “A társasági adó támogatásban részesülő sports- 2018. https://piacesprofit.hu/kkv_cegblog/a-tao-tamogatasrol-
zövetségek gazdasági helyzete5 The economic situation of sport kozerthetoen/.
federations receiving support from corporate tax,” GRADUS, vol. [29] R. Balogh, “Áldás vagy átok: A TAO hatása a magyar labdar-
6, no. 3, pp. 82–7, 2019. úgásra,” Magyar Sporttudományi Szemle XVIII. évf/72. szám, pp.
[21] D. Kerezsi, Z. Bács, E. Böcskei, Z. Zéman, T. Tarnóczi, and V. 25–8, 2017.
Fenyves, “Magyarországi sporttevékenységet végző vállalkozások [30] V. Fenyves and T. Tarnóczi, Gazdasági elemzés – Gyakorlati
kiegészítő mellékletének összehasonlító elemzése az általános rész jegyzet. Debrecen: Debreceni Egyetem, 2013, p. 130.
Open Access. This is an open-access article distributed under the terms of the Creative Commons Attribution 4.0 International License (https://creativecommons.org/
licenses/by/4.0/), which permits unrestricted use, distribution, and reproduction in any medium, provided the original author and source are credited, a link to the CC
License is provided, and changes – if any – are indicated. (SID_1)
Unauthenticated | Downloaded 06/16/22 04:41 PM UTCYou can also read