A Campus-Level View of Outlook Email Traffic - University of ...
←
→
Page content transcription
If your browser does not render page correctly, please read the page content below
A Campus-Level View of Outlook Email Traffic

                                  Zhengping Zhang                                                           Carey Williamson
                    Nanjing University of Aeronautics and                                                   University of Calgary
                                Astronautics                                                                cwill@ucalgary.ca
                            University of Calgary
                     zhang.zhengping@ucalgary.ca

ABSTRACT                                                                                         A decade ago, most academic institutions provided their
This paper presents a workload characterization study of                                      own email service [9]. However, because of limited IT bud-
Outlook email traffic, as viewed at a campus scale. Us-                                       gets, security concerns, and the growing volume and com-
ing a combination of passive and active approaches to net-                                    plexity of email, small email service providers rarely have the
work traffic measurement, we identify the key components in                                   resources required to maintain a high-quality email service.
the email delivery infrastructure, and then characterize the                                  In particular, they are often slow in adopting new standards
email traffic on our campus network, using a month of em-                                     or fixing security vulnerabilities [10].
pirical network measurement data. The main observations                                          In recent years, many universities have migrated their
from our study include the complexity of modern email ser-                                    email to large cloud-based service providers [27], such as
vices, the strong diurnal patterns for human-driven email                                     Google’s Gmail or Microsoft’s Outlook (a.k.a. Office 365).
activities, and the low throughput achieved for large email                                   Our own university is one example of this. In 2014, the
attachments.                                                                                  University of Calgary started to transfer its email service to
                                                                                              Outlook, which is one of the most popular email services. By
                                                                                              the end of 2016, all email users at the University of Calgary
CCS Concepts                                                                                  were switched to this service provider. This cloud-based
•Networks → Network Performance Evaluation;                                                   email service is now used on a daily basis by 32,000 stu-
                                                                                              dents and 3,000 faculty and staff.
Keywords                                                                                         In this paper, we conduct an in-depth measurement study
                                                                                              of how this cloud-based email service is being used by our
Network Traffic Measurement, Outlook Email, Workload                                          campus community, and how well it performs. We first
Characterization                                                                              investigate how the Outlook email service is provided, in-
                                                                                              cluding its key components. Then we present a high-level
1.     INTRODUCTION                                                                           overview of our campus email traffic. Finally, we present a
  Electronic mail (email) has grown and changed dramati-                                      detailed workload characterization study, and identify some
cally since its first inception on the Internet in 1969. From                                 performance-related issues for Outlook email.
humble beginnings with SMTP (Simple Mail Transfer Proto-                                         There are two major technical challenges in our work.
col), the maild daemon, and the sendmail program on Unix-                                     First, Outlook email relies on a number of other sub-services,
based systems, email has since used a variety of mail ac-                                     including authentication, spam filtering, and content deliv-
cess protocols, including POP (Post Office Protocol), IMAP                                    ery. Each sub-service in turn has distinct usage, configura-
(Internet Mail Access Protocol), and HTTP (Hyper-Text                                         tion, and workload characteristics. It is difficult to analyze
Transfer Protocol). Among these protocols, Web-based email                                    email service as a whole without adequate understanding of
using HTTPS is prevalent today, and has helped make email                                     its underlying sub-services. Second, for security reasons, all
one of the most popular services on the Internet.                                             email traffic is encrypted using either SSL or TLS [13, 22].
  In the last two decades, numerous personal, business, and                                   Having all application-layer data obfuscated makes it diffi-
commercial email services have emerged, including Gmail,                                      cult to conduct our analysis, for which only TCP/IP packet
Outlook, Yahoo!, and Zoho. Based on worldwide email ser-                                      header information is available.
vice statistics, there are over 3.7 billion email users around                                   To address these challenges, we employ both passive and
the world, and this number is projected to reach 4.2 billion                                  active measurement approaches in our workload study. Via
by the end of 2022 [25].                                                                      passive monitoring at the campus edge router, we have col-
                                                                                              lected more than two years of network traffic data, a month
Permission to make digital or hard copies of all or part of this work for personal or
                                                                                              of which is used for our analysis in this paper. By using
classroom use is granted without fee provided that copies are not made or distributed         active measurement approaches, we are able to better un-
for profit or commercial advantage and that copies bear this notice and the full cita-        derstand the workflow of Outlook, including the application
tion on the first page. Copyrights for components of this work owned by others than           layer. For this purpose, we also rely upon several Outlook
ACM must be honored. Abstracting with credit is permitted. To copy otherwise, or re-
publish, to post on servers or to redistribute to lists, requires prior specific permission   technical documents [17, 18, 19].
and/or a fee. Request permissions from permissions@acm.org.                                      The results of our measurement study show that Outlook
                                                                                              email usage has strong diurnal and weekly patterns on our
c 2018 ACM. ISBN 978-1-4503-2138-9.                                                           campus network. The connection duration, as well as vol-
DOI: 10.1145/1235
ume of data exchanged, vary with the type of service being Besides, This approach is commonly used for traffic mea-
used. We also identify several performance-related issues for surement, which can be generalized to study other Email
Outlook email service. systems as well.
The rest of this paper is organized as follows. Section 2
reviews prior related work on network traffic measurement. 3.1 Passive Measurement
Section 3 introduces the methodology used for our study. In passive measurement, data is gathered by listening to
Section 4 discusses the five main components involved in the Internet traffic passively. Specifically, it does not gener-
email delivery. In Section 5, we present a high-level overview ate any additional traffic of its own. This approach is used
of Outlook related traffic, while Section 6 provides an in- for collecting network statistics or evaluating network per-
depth analysis. Finally, Section 7 concludes the paper. formance, especially using long-term measurements.
In our work, we use the network traffic collected by an En-
2. RELATED WORK dace DAG network monitor, which is installed at the edge
router of our campus network. The functionality of our mon-
Network traffic measurement is a widely-adopted approach
itor is similar to that of Wireshark [6], but uses specialized
for analyzing network usage and understanding network ap-
hardware to capture packets at multi-Gigabit rates. The
plication performance. Such studies can provide not only
monitor is equipped with two Intel Xeon E5-2690 CPUs, 64
a statistical characterization of the network ecosystem, but
GB RAM, and 5.5 TB of hard disk for data storage.
also help identify anomalies, misconfigurations, or perfor-
We use the Bro [20] intrusion detection system to process
mance limitations within the network. A tutorial introduc-
our dataset. Bro takes the headers of all captured Internet
tion to network traffic measurement is provided in [26].
traffic as input, and produces hourly connection-level sum-
From the 1990’s to the present, researchers have charac-
maries as output. Since the vast majority of email-related
terized many kinds of network applications, including Web
traffic uses HTTPS, our primary interest is the SSL logs, as
traffic [1, 4], peer-to-peer applications [3], video stream-
well as connection logs [12]. Collectively, these logs describe
ing services [5, 14], and email [10]. For example, Arlitt et
the TCP connection information, including transport-layer
al. [1] characterized the workload of Internet Web servers,
endpoints, number of packets transferred, and number of
and identified ten common properties that are still promi-
payload bytes sent/received.
nent in today’s Web traffic. Crovella et al. [8] discovered
self-similarity in Web traffic, based on traces collected from
both clients and servers. 3.2 Active Measurement
Video traffic has also been a main subject of study. For We also employ active measurement approaches for un-
example, Cha et al. [5] studied user-generated videos on derstanding network activities. This approach allows us to
YouTube, while Gill et al. [14] studied YouTube usage on test the behaviour of Outlook email services under different
a campus network. More recently, Laterman et al. [16] pro- scenarios (e.g., login, email sending, email reading, logout).
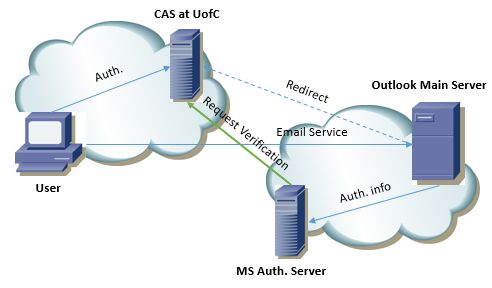
vided a campus-level characterization study of two popular The main tool we use is the Man-In-The-Middle (MITM)
video streaming services (Netflix and Twitch), and identified proxy [7], as illustrated in Figure 1. This setup allows us
the similarities and differences between these two services. to decrypt HTTPS messages in our own test email sessions.
In recent years, several email-related measurement stud- These traces are used to discern essential information missed
ies have been conducted. Dominik et al. [24] presented a in passive measurement of encrypted email traffic.
flow-based classification of Webmail traffic. By extracting
features from HTTPS flows, their method can detect Web-
mail traffic with high accuracy, even when it is encrypted.
Elieb et al. [10] presented a comprehensive measurement
study of SMTP security extensions. This research indicated
that top mail providers are more proactive in adopting new
security configurations. Ramachandran et al. [21] charac-
terized the properties of spammers, and developed an ap- Figure 1: Example of MITM proxy configuration
proach to detect spam based on network-level footprints.
In [11], Steven et al. discussed privacy issues in email trans-
We also use other common tools to conduct active mea-
fers. They pointed out that third-party tracking is a problem
surements, such as MaxMind for IP address geolocation,
in commercial email. In [15], Trinabh et al. addressed the
traceroute for routing, and ping for network latency.
tradeoffs between email privacy and essential functions such
as spam filtering. They showed that spam filtering is still
achievable, even with end-to-end encryption.
3.3 Server Classification
These recent prior works focus on the privacy and secu- In our logs, we identify Outlook email-related traffic us-
rity of email. However, to the best of our knowledge, the ing specific IP address ranges. However, Outlook email itself
workload of email traffic itself has not been studied, which consists of several different components, and each has differ-
provides the primary motivation for our work. ent IP ranges. Therefore, we introduce these components
here, along with the IP ranges for each.
The servers supporting Outlook email can be divided into
3. METHODOLOGY three main categories [17]: Main Server (Portal and Ex-
In general, network traffic measurement approaches can change Online), Content Distribution Network (Exchange
be divided into passive and active measurement, based on Online CDN), and Spam Filtering (Exchange Online Protec-
the data collection mechanism. For a fuller picture of how tion). Table 1 summarizes the IP ranges for these services,
Outlook email works, we use both approaches in our work. along with the underlying SMTP, POP, and IMAP services.Table 1: IP ranges for different services involved in Outlook email.
Service Domain Name IP Address Location Port
13.107.6.156 Redmond, WA
portal.office365.com
Portal and Exchange Online 52.109.2.136 San Francisco, CA 443
40.97.0.0/16
*.office365.com 40.100.0.0/16 Redmond, WA
40.101.0.0/16
23.41.182.156
104.125.231.63
r1.res.office365.com
Exchange Online CDN 184.27.135.86 Seattle, WA 443
...
r4.res.office365.com 23.36.176.113 Vancouver, BC
23.103.157.42
Exchange Online Protection protection.outlook.com Toronto, ON 443
23.103.157.10
SMTP server smtp.office365.com 40.97.0.0/16 Redmond, WA 587
POP3 server outlook.office365.com 40.97.0.0/16 Redmond, WA 995
IMAP server outlook.office365.com 40.97.0.0/16 Redmond, WA 993
3.3.1 Main Servers 4.1 Login
The Main Servers in Outlook have several responsibilities, There are three ways to access the Outlook email service:
including the sending and receiving of email messages, de- Outlook PC application, Outlook Mobile application, and
livering shared resources, and maintaining the connection the Outlook Web site. The Mobile application approach is
between clients and the Outlook server. The Main Server very similar to the PC application, therefore, we will focus
uses a Class B IP address range: 40.97.0.0/16. In addition, on the other two approaches.
two other Class B IP ranges are used for additional servers: Using Outlook email via the Outlook application is the
40.100.0.0/16 and 40.101.0.0/16. most common approach. In general, the login process is
straightforward. The application first leads the users to
3.3.2 CDN Nodes outlook.office365.com to enter their email address. When a
The Exchange Online CDN is used to deliver shared re- valid ucalgary.ca email address is typed, the login process
sources, such as icons and scripts. Microsoft indicates that is redirected to the Central Authentication Service (CAS) at
both Azure and Akamai nodes can be used to assist with con- the University of Calgary for authentication. Once authen-
tent delivery. However, only two CDN nodes are observed ticated, users are issued an authentication token, which can
in email delivery for our campus, namely r1.res.office365. be used to access all Office365 services, including Outlook,
com and r4.res.office365.com. Based on our understanding, Word, and PowerPoint. TCP connections are established
r1.res is used to support mobile devices, while r4.res han- with several other servers, such as *.aria.microsoft.com
dles requests from desktop PCs. In both cases, the resources and nexus.officeappps.live.com. However, these servers
are stored publicly on these nodes. That is, as long as you are shared with other Office365 services, and are not directly
know the corresponding URL, you can access these shared related to the Outlook email service. Therefore, we simply
resources without authentication (i.e., using HTTP). ignore them in our discussion.
Compared with the application-based approach, the login
3.3.3 Protection Server process through a Web browser is rather complex. Several
Outlook Protection is a spam filtering server to maintain different servers are involved in the initial step of email ser-
email security. If an email is potentially malicious, it is for- vice. The most frequently observed ones include the Lo-
warded to the Protection server, which decides whether to gin Portal (login.microsoftonline.com), the Delve ser-
deliver the email or tag it as spam. Generally, the Protection vice (loki.delve.office.com), the Aria service for Web
server is invisible to users, since it is a hidden step in the browsers (browser.pipe.aria.microsoft.com) and the Web
email delivery process. However, the SMTP server within shell (webshell.suite.office.com). In a Web-based sce-
our campus can talk to it directly. Based on our analysis, nario, more steps are inherently required to support the ser-
the traffic between these two specific servers is dominated vice. However, there are many superfluous TCP connec-
by spam-related activities initiated from compromised com- tions, such as Delve and Skype, which are not essential to
puters within our campus network. the email service.
4.2 Authentication
4. EMAIL SESSION STRUCTURE The authentication traffic occurs between the CAS server
In this section, we present a structural analysis of the net- within our campus network and the authentication server at
work communication involved in the Outlook email service. Microsoft’s data center. When a user attempts to login to
We divide the Outlook email services into five major steps: Outlook from the University of Calgary domain, Microsoft’s
Login, Authentication, Email Sending, Email Receiving, and authentication server asks the CAS server to check the user’s
Logout. Other less common interactions are ignored. We identity, since all the authentication information is stored
present a brief introduction of the mechanisms in each step, locally at the University of Calgary. If a user modifies his
to better understand how the email services are provided. or her password, a new authentication process is required.Figure 2 shows the Authentication step for Outlook email. 5.1 Authentication Server
Figure 3a shows the number of TCP connections launched
between CAS and the Outlook Authentication server. Ignor-
ing the 3-day monitor outage early in the month, there are
strong diurnal and weekly patterns seen. There are 8,000-
10,000 TCP connections every hour during the busy part of
each work day, with a slight decline on weekends.
The peak hour often appears early in the morning, reflect-
ing the typical workday schedule for most people. However,
Authentication traffic continues throughout the day and into
the evenings. The explanation is that no matter where the
user is when doing authentication (i.e., at work, at home, or
on travels), it is captured by the monitor, since the Authen-
tication server is physically on our campus.
Figure 2: Authentication by Outlook and CAS (green line)
5.2 Main Server
The main server (Portal and Exchange Online) handles
4.3 Sending Email most of the Outlook email traffic. In total, we recorded over
The sending of email is relatively straightforward. The 100 million individual TCP connections during our month-
email content is always sent directly to the Outlook main long observational period. These connections were all launched
server, using the HTTP POST method. If there are email by clients within our campus, targeting the Outlook Main
attachments, these get handled in one of two different ways, Server. This workload indicates how heavily the Outlook
depending on their size. Small attachments are sent di- email service is used within our campus.
rectly to attachment.outlook.office.com. Large attach- Figure 3b shows the number of TCP connections initi-
ments (20 MB or more) are redirected to OneDrive. ated for Outlook email in every hour of each day during the
month of February 2018. A strong diurnal pattern is evident
4.4 Receiving Email in this data.
Incoming email is received through a periodic detection On typical weekdays, the peak hour usually appears in
procedure. After the login step, several parallel connections late morning or early afternoon, with a slight downward dip
(typically 3 or 6) are maintained between the client and during the noon-hour lunch break (see Figure 4). The peak
the Outlook servers. The client periodically sends (every hour of a day often has more than 500,000 individual TCP
minute) an HTTP POST request to the Outlook server to connections. However, this number declines rapidly in mid-
check for new messages. Interestingly, the update interval to-late afternoon, as people start leaving campus for the day.
for the Web-based approach is only 10 seconds. Hence, when There is often a small peak in the evenings as well, indicating
new email comes in, the Web-based Outlook often alerts the that some people check their email just before bedtime.
user much sooner than the application-based version. Interestingly, the average email traffic early in the work
week (e.g., Monday to Wednesday) is always slightly higher
4.5 Logout than that later in the week (e.g., Thursday and Friday).
There are several ways to end an email session, such as se- This indicates either more people on campus on those days
lecting “Sign Out” in the PC or browser Outlook application, (consistent with our earlier measurements of the Learning
or manually closing the browser window. In general, TCP Management System on our campus network [23]), or that
connections should be terminated through a four-way hand- people are more active in email activities at the beginning
shake using FIN and ACK flags. However, Outlook does not of each week. The weekends have a lower volume of email
use a normal FIN to terminate the session. Instead, a RST traffic, with the peak hour below 100,000 TCP connections.
flag is commonly witnessed in the logout step, regardless of Also, the peak hour during weekends tends to be in the
how the session was terminated. This phenomenon is a long- evenings, rather than mid-day.
standing issue with Microsoft’s TCP implementation [2]. Our university’s Reading Week break (February 19-23,
Another interesting observation from our measurements 2018) is also evident in Figure 3b. Traffic volumes are lower
is that connections with CDN nodes are terminated with because of the statutory holiday (February 19), for which
both FIN and RST flags. To be specific, the client sends a the traffic is similar to that of a weekend. For the remain-
FIN, followed shortly by an RST, to force connection termi- ing four days of that week, the average volume of traffic is
nation. As a result, there is no ACK for the original FIN a bit lower than normal workdays, but the diurnal pattern
from the server. In general, about 35% of the connections remains the same. Although many students are away dur-
with the Outlook server are terminated with RST, with the ing the break, there are still many other faculty, staff, and
remainder ending properly. This seems to be caused by non- students working on campus.
standard TCP configurations from Microsoft.
5.3 CDN Nodes
As mentioned earlier, there are two CDN nodes providing
5. TRAFFIC OVERVIEW the Exchange Online CDN service. Figure 3c shows the
In this section, we provide an overview of the Outlook number of CDN-related TCP connections in each individual
traffic on our campus network in February 2018 (Figure 3). hour of our data. The diurnal and weekly patterns are still
We investigate the traffic for each sub-service separately to apparent, though the number of connections is much lower.
show the distinctive patterns within different services. The peak hour on a weekday typically has 6,000 to 8,000Hourly TCP Connection Counts for Authentication Server (February 2018) Hourly TCP Connection Counts for Outlook Main Server (February 2018) Hourly TCP Connection Counts for CDN Nodes (February 2018) Hourly TCP Connection Counts for Protection Server (February 2018)
1e+06 1e+06 1e+06 1e+06
r4.res
r1.res
100000 100000 100000 100000
TCP Connection Count
TCP Connection Count
TCP Connection Count
TCP Connection Count
10000 10000 10000 10000
1000 1000 1000 1000
100 100 100 100
10 10 10 10
0 100 200 300 400 500 600 0 100 200 300 400 500 600 0 100 200 300 400 500 600 0 100 200 300 400 500 600
Time in Hours Time in Hours Time in Hours Time in Hours
(a) Authentication server (b) Main server (c) CDN server (d) Protection server
Figure 3: Hourly Counts of TCP Connections Initiated for Email-related Traffic (February 2018)
weekdays. This suggests some machine-initiated email ac-
600000
Hourly TCP Connection Counts for Outlook Main Server (February 12-16, 2018)
Mon Feb 12
tivities, rather than human-driven activities. We believe
Tue Feb 13
Wed Feb 14
Thu Feb 15
that these patterns reflect spam-related activity between our
500000 Fri Feb 16
campus SMTP server and the Protection server.
400000
TCP Connection Count
300000
6. DETAILED ANALYSIS
In this section, we focus on two important features of Out-
200000
look email traffic, namely the duration and data volume of
100000 each individual TCP connection. These two features reflect
the network-level workload of each connection. It also sheds
0
0 6 12
Time in Hours
18 24
some light on how the Outlook email service performs.
We use a similar structure to the previous section to present
the results, with Authentication, Protection, Main Server,
Figure 4: Detailed Hourly Count of TCP Connections with and CDN traffic analysis. However, we supplement our anal-
Outlook Main Server ysis with two new features. First, the communication with
the Main Server is divided into two groups, based on how
connections are terminated (i.e., FIN or RST). Second, we
TCP connections for r1.res and r4.res, respectively. explore the reasons for the load imbalance between the two
These connection counts are a lot lower than for the Main CDN nodes. Therefore, in this section, there are six (rather
Server, since CDN nodes are not directly involved for send- than four) graphs for each analysis.
ing/receiving emails. The nightly peak does not show up in 6.1 Connection Duration
the CDN workload either. This may indicate that although
people check their email at night, CDN nodes are rarely We study the duration of each TCP connection between
involved. Similarly, the volume of traffic to CDN nodes re- our campus network and the Outlook email-related services.
mains low during Reading Week. This duration is the elapsed time between the start (i.e.,
Another interesting observation is that the workloads of SYN) and the end (i.e., FIN or RST) of each TCP con-
the two CDN nodes are not balanced. Specifically, r4.res nection. In our analysis, we classify TCP connections into
has about 20% more traffic than r1.res. This may indicate one of three categories, namely short (less than 10 seconds),
that there are more PC Outlook users than mobile users. medium (between 10 seconds and 5 minutes), and long du-
We explore these differences further in Section 6. ration connections (over 5 minutes). The latter (long) are
typically used to maintain state between the client and the
5.4 Protection Servers Outlook email server.
The Online Protection server is responsible for spam fil- 6.1.1 Authentication Server
tering and other related services. Hence the number of On- Figure 5a shows the TCP connection durations with the
line Protection connections represents effort spent process- Authentication server. The communication patterns have
ing (potentially) suspicious email traffic. very consistent durations, with most connections lasting 1
In our campus network, all incoming email messages are to 5 seconds. This result makes sense, since the initial login
first sent to the Protection server for a spam filtering check. procedure often finishes within a few seconds.
This is true regardless of the originating domain (i.e., in-
ternal or external to the U. of Calgary) of the email mes- 6.1.2 Protection Server
sage. However, externally-generated messages receive the Figure 5b shows the TCP connection duration with the
most rigorous scrutiny. Protection server. These results show that the Protection
Figure 3d plots the Online Protection traffic in each indi- connections last 120 to 200 seconds. Considering that the
vidual hour. The diurnal and weekly patterns remain, but default timeout for persistent connections in Microsoft’s In-
the peak hour often appears at around 9:00 AM, and drops ternet Information Server (IIS) is 2 minutes, it is clear that
rapidly afterwards. Also, the count of TCP connections in these sessions use persistent TCP connections.
the peak hour fluctuates a lot. Surprisingly, the workload
during Reading Week is not reduced, compared with other 6.1.3 Main Serverwith about 35% of the sessions having this duration. This
1.0
discrepancy suggests that mobile-based Outlook has smaller
1.0
data transfers with CDN nodes than PC Outlook. We ex-
0.8 0.8
plore this further in the next section.
0.6 0.6
6.2 Data Traffic Volume
CDF
CDF
0.4 0.4
0.2 0.2
Our next analysis focuses on the number of data bytes
exchanged on the TCP connections. Since TCP allows full-
0.0 0.0
0.1s 1s 2s 10s 1min 5min 1h 0.1s 1s 2s 10s 1min 5min 1h
duplex communication, we do a separate analysis of inbound
Duration of sessions with Authentication Server Duration of sessions with Protection Server and outbound data traffic. Specifically, traffic that goes from
(a) Authentication (b) Protection the Internet to the University of Calgary campus is consid-
ered inbound, and that in the opposite direction is consid-
ered outbound.
1.0 1.0
0.8 0.8
0.6 0.6
1.0 1.0
CDF
CDF
0.4 0.4
0.8 0.8
0.2 0.2
0.6 0.6
CDF
CDF
0.0 0.0
0.1s 1s 2s 10s 1min 5min 1h 0.1s 1s 2s 10s 1min 5min 1h 0.4 0.4
Duration of sessions with Main Server (FIN) Duration of sessions with Main Server (RST)
0.2 0.2
(c) Main Server (FIN) (d) Main Server (RST) outbound outbound
0.0 inbound 0.0 inbound
1K 10K 100K 1M 10M 1K 10K 100K 1M 10M
Volume of data Exchanged with Authentication Server Volume of data Exchanged with Protection Server
1.0 1.0
(a) Authentication (b) Protection
0.8 0.8
0.6 0.6
1.0 1.0
CDF
CDF
0.4
0.4 0.8 0.8
0.2
0.2 0.6 0.6
CDF
CDF
0.0
0.1s 1s 2s 10s 1min 5min 1h 0.1s 1s 2s 10s 1min 5min 1h 0.4 0.4
Duration of sessions with r1.res Duration of sessions with r4.res
0.2 0.2
(e) CDN node r1.res (f) CDN node r4.res outbound outbound
0.0 inbound 0.0 inbound
1K 10K 100K 1M 10M 1K 10K 100K 1M 10M
Figure 5: CDF of TCP Connection Duration for Email- Volume of data Exchanged with Main Server (FIN) Volume of data Exchanged with Main Server (RST)
related Traffic (February 2018) (c) Main Server (FIN) (d) Main Server (RST)
1.0 1.0
Figure 5c and Figure 5d show the durations of connections 0.8 0.8
with the Outlook Main Server. These connections have a 0.6 0.6
wide range of durations, no matter how the sessions ended.
CDF
CDF
0.4 0.4
For FIN connections, 50% are short, 45% are medium du-
ration, and only 5% are long. For RST connections, less 0.2 0.2
outbound outbound
than 20% are short, about 60% are medium duration, and 0.0 inbound 0.0 inbound
20% are long. The long sessions maintain state between the 1K 10K 100K 1M 10M 1K 10K 100K 1M 10M
Volume of data Exchanged with r1.res Volume of data Exchanged with r4.res
client and the Outlook email servers. Recalling that 35% of
(e) CDN node r1.res (f) CDN node r4.res
the connections are terminated with RST, we can infer that
more than 60% of the long connections are not terminated Figure 6: CDF of TCP Connection Data Volume for Email-
properly. related Traffic (February 2018)
6.1.4 CDN Nodes
The duration of connections with r1.res and r4.res are
shown in Figure 5e and Figure 5f, respectively. In general, 6.2.1 Authentication Server
all connections with CDN nodes have a medium duration. Figure 6a shows the data volumes exchanged with the Au-
This implies connections with CDN nodes are not termi- thentication server. These results show consistent volumes
nated immediately after the data transfer. No long dura- for both inbound and outbound traffic. The typical volumes
tions are witnessed in these connections. are 3 KB for inbound, and 12 KB for outbound. The data
There are also some perceptible differences in the CDFs exchanged with the Authentication server involves user in-
for the two CDN nodes. For node r1.res, around 30% of formation, such as user credentials and (perhaps) some type
the connections lasts 10 seconds. On the other hand, for of certificate. Our results show that these have a small and
connections with r4.res, a one-minute duration is typical, consistent size for all users.6.2.4 CDN Nodes
0.0 outbound 0 outbound
Figure 6e and Figure 6f show the data volume for the
inbound inbound two CDN nodes. As evident from the graphs, the workloads
0.5
1 for r1.res and r4.res differ. For both nodes, the volume
1.0
1.5 2
of inbound traffic varies widely (e.g., from 30 bytes to 2
LLCDF
LLCDF
2.0 MB), while outbound traffic does not (e.g., from 100 bytes
3 to 5 KB). There are also some distinct step-like patterns
2.5
3.0 4
in the CDFs. For r1.res, about 40% of the inbound sizes
1K 10K 100K 1M 10M 10 100 1K 10k 100k 1M 10M 100M
are about 8 KB, and 20% are about 40 KB. For r4.res,
Volume of data Exchanged with Main Server bits per second about 15% of the inbound traffic is near 8 KB, with most of
(a) Transfer size (bytes) (b) Throughput (bps) the transfers larger than this. The frequently observed sizes
indicate popular shared resources, such as icons or scripts.
Figure 7: LLCD plots for Main Server TCP Connections Upon login, users are required to download dozens of scripts,
some of which are relatively large (e.g., 200 KB). Also, since
the scripts are updated frequently, the inbound data volumes
6.2.2 Protection Server change over time.
Figure 6b shows the volume of data exchanged with the
Protection server. The sizes for outbound traffic vary a lot 7. CONCLUSION
(from 1 KB to 1 MB), reflecting the typical size distribution In this paper, we presented a detailed measurement study
for email messages. On the other hand, the inbound traffic is of Outlook email service at the University of Calgary. Out-
extremely consistent in its size, perhaps reflecting a standard look email is a cloud-based service, and is heavily used by
set of email headers for the spam filtering report. Our results faculty, staff, and students at our university. However, the
suggest that the Protection server typically receives a single service itself has a very complex implementation.
email message as input. No matter what is received, the The main contributions in our work are a better under-
Protection server returns about 4,800 bytes as a reply. standing of the operation of Outlook email, and a work-
load characterization of email usage on our campus net-
6.2.3 Main Server
work. We first identified four email-related services sup-
Figure 6c and Figure 6d show the data volumes exchanged porting Outlook email, namely Authentication, Protection,
between clients and the Main Server. The two distributions Main Server, and CDN. All these servers show strong daily
are similar, regardless of how the session is terminated (FIN and weekly patterns, which reflects the human-driven activ-
or RST). The only difference appears in connections with ities in email usage. However, based on the different roles
low data volume. For FIN connections, about 15% of them for these servers, the characteristics of the workloads for
have less than 1 KB of inbound data, and less than 2 KB these different servers are distinct from each other. Second,
of outbound data. For RST connections, however, only 4% we introduced the five major structural components in an
of them have these structural characteristics. This result email session. Finally, we presented our overall and detailed
implies that (short) sessions with limited data exchange are measurement of network traffic with distinct email-related
more likely to be terminated normally, while medium or long servers. The results reflect the usage of Outlook email ser-
duration connections are more likely to have a RST. vice at the campus scale.
Most inbound and outbound connections have less than We identified several performance-related issues related
1 MB of data volume. For example, 90% of them exchange to Outlook email. First, in the initialization step, Out-
less than 100 KB of data. However, a few connections have look builds many parallel TCP connections with extrane-
very large data transfers. The largest inbound data volume ous servers, such as Delve and Skype, which are never used.
seen was 1.7 GB. Figure 7a shows a Log-Log Complementary These increase the delay for email session initialization. Sec-
Distribution (LLCD) plot of the transfer sizes. This graph ond, although the TCP implementation at the server sup-
has power-law structure, showing evidence of a heavy-tailed ports TCP window scaling, the maximum advertised re-
distribution. ceiver window on the server is only 64 KB. This setting
We also calculate the average throughput (in bits per results in unduly low throughput when uploading large at-
second) for TCP connections with the Main Server (see tachments. Finally, Outlook uses TCP resets to terminate
Figure 7b). Most connections have very low throughput. many of its TCP connections. While this does not in itself
This is not unexpected, since users maintain sessions re- cause particular performance problems, it is non-standard,
gardless of whether there is new email or not. However, and limits the effectiveness of TCP/IP traffic analysis using
the largest outbound throughput achieved by any TCP con- passive network measurements. Since all RST comes from
nection is only about 12 Mbps, which is disappointing for Microsoft, a redesign on both client and server side of Out-
large data transfers, especially over a Gigabit network. Fur- look Email Service could alleviate this problem.
thermore, the throughput achieved by outbound connections
is markedly lower than that for inbound connections. The
highest throughput we witnessed reaches 50 Mbps. Detailed Acknowledgements
investigations using Wireshark show that inbound connec- The authors thank University of Calgary Information Tech-
tions use TCP window scaling (1 MB) to improve through- nologies (UCIT) for facilitating the collection of our network
put, while outbound connections are limited to a maximum traffic measurement data, and the ICNCC 2018 reviewers for
TCP window size of 64 KB. This constrains the effective their constructive feedback on our work. Financial support
throughput, especially when uploading large email attach- for this work was provided in part by Canada’s Natural Sci-
ments. ences and Engineering Research Council (NSERC) throughthe Discovery Grants program. Electronics, Control and Computer Science, Vol. 4,
No. 1, pp. 13–26, 2018.
8. REFERENCES [14] P. Gill, M. Arlitt, Z. Li, and A. Mahanti, “YouTube
[1] M. Arlitt and C. Williamson, “Internet Web Servers: Traffic Characterization: A View from the Edge”,
Workload Characterization and Performance Proceedings of ACM IMC, pp. 15–28, San Diego, CA,
Implications”, IEEE/ACM Transactions on November 2007.
Networking, Vol. 5, No. 5, pp. 631–645, October 1997. [15] T. Gupta, H. Fingler, L. Alvisi, and M. Walfish,
[2] M. Arlitt and C. Williamson, “An Analysis of TCP “Pretzel: Email Encryption and Provider-supplied
Reset Behaviour on the Internet”, ACM Computer Functions are Compatible”, Proceedings of ACM
Communication Review, Vol. 35, No. 1, pp. 37-44, SIGCOMM Conference, pp. 169–182, Los Angeles,
January 2005. CA, August 2017.
[3] N. Basher, A. Mahanti, A. Mahanti, C. Williamson, [16] M. Laterman, M. Arlitt, and C. Williamson, “A
and M. Arlitt, “A Comparative Analysis of Web and Campus-level View of Netflix and Twitch:
Peer-to-peer Traffic”, Proceedings of the 17th World Characterization and Performance Implications”,
Wide Web Conference, pp. 287–296, Beijing, China, Proceedings of SCS SPECTS, pp. 1–8, Seattle, WA,
May 2008. July 2017.
[4] L. Breslau, P. Cao, L. Fan, G. Phillips, and [17] Microsoft, Office 365 URLs and IP Address Ranges.
S. Shenker, “Web Caching and Zipf-like Distributions: https://docs.microsoft.com/en-us/microsoftteams/
Evidence and Implications”, Proceedings of IEEE office-365-urls-ip-address-ranges.
INFOCOM, pp. 126-134, New York, NY, 1999. [18] Microsoft, Server Settings of Office 365 Email Service.
[5] M. Cha, H. Kwak, P. Rodriguez, Y. Ahn, and https://support.office.com/en-us/article/
S. Moon, “I Tube, You Tube, Everybody Tubes: server-settings-you-ll-need-from-your-email-provider.
Analyzing the World’s Largest User-Generated [19] Microsoft, Office 365 Content Delivery Network.
Content Video System”, Proceedings of ACM Internet https://docs.microsoft.com/en-us/sharepoint/dev/
Measurement Conference (IMC), pp. 1-14, San Diego, general-development/office-365-cdn.
CA, November 2007. [20] V. Paxson, “Bro: A System for Detecting Network
[6] L. Chappell and G. Combs, Wireshark Network Intruders in Real-time”, Computer Networks, Vol. 30,
Analysis: The Official Wireshark Certified Network No. 23-24, pp. 2435–2463, 1999.
Analyst Study Guide, Protocol Analysis Institute, [21] A. Ramachandran and N. Feamster, “Understanding
Chappell University, 2010. the Network-level Behavior of Spammers”, Proceedings
[7] A. Cortesi, M. Hils, T. Kriechbaumer, et al., of ACM SIGCOMM Conference, pp. 291–302, Pisa,
mitmproxy: A Free and Open Source Interactive Italy, September 2006.
HTTPS Proxy, 2010-2018. https://mitmproxy.org/. [22] E. Rescorla, SSL and TLS: Designing and Building
[8] M. Crovella and A. Bestavros, “Self-similarity in Secure Systems, Addison-Wesley, 2001.
World Wide Web Traffic: Evidence and Possible [23] S. Roy and C. Williamson, “Why is my LMS so slow?
Causes”, IEEE/ACM Transactions on Networking, A Case Study of D2L Performance Issues”, Proceedings
Vol. 5, No. 6, pp. 835–846, December 1997. of ISCA Computers and Their Applications (CATA),
[9] J. Drucker and H. Goldstein, “Assessing the Regional Las Vegas, NV, pp. 34-39, March 2018.
Economic Development Impacts of Universities: A [24] D. Schatzmann, W. Mühlbauer, T. Spyropoulos, and
Review of Current Approaches”, Intl. Regional Science X. Dimitropoulos, “Digging into HTTPS: Flow-based
Review, Vol. 30, No. 1, pp. 20–46, 2007. Classification of Webmail Traffic”, Proceedings of
[10] Z. Durumeric, D. Adrian, A. Mirian, J. Kasten, ACM IMC, pp. 322–327, Melbourne, Australia,
E. Bursztein, N. Lidzborski, K. Thomas, V. Eranti, November 2010.
M. Bailey, and J. Halderman, “Neither Snow nor Rain [25] H. Tschabitscher, “How many email users are there?”,
nor mitm...: An Empirical Analysis of Email Delivery https://www.lifewire.com/ accessed Oct. 10, 2018.
Security”, Proceedings of ACM IMC, pp. 27–39, [26] C. Williamson, “Internet Traffic Measurement” IEEE
Tokyo, Japan, October 2015. Internet Computing, Vol. 5, No. 6, pp. 70–74, 2001.
[11] S. Englehardt, J. Han, and A. Narayanan, “I Never [27] S. Zhang, S. Zhang, X. Chen, and X. Huo, “Cloud
Signed Up for This! Privacy Implications of Email Computing Research and Development Trends”,
Tracking”, Proceedings of Privacy Enhancing Proceedings of IEEE International Conference on
Technologies Symposium, pp. 109–126, Barcelona, Future Networks, pp. 93–97, 2010.
Spain, July 2018.
[12] I. Foster, J. Larson, M. Masich, A. Snoeren,
S. Savage,and K. Levchenko, “Security by Any Other
Name: On the Effectiveness of Provider-based Email
Security”, Proceedings of ACM SIGSAC Conference
on Computer and Communications Security,
pp. 450–464, Denver, CO, October 2015.
[13] T. Fowdur, S. Aumeeruddy, and Y. Beeharry,
“Implementation of SSL/TLS-based Security
Mechanisms in E-commerce and E-mail Applications
using Java”, Journal of Electrical Engineering,You can also read